Grey Model for Evaluation and Analysis of
Competitiveness in the Packaging and Testing
Industry
Chong-Rong Huang Kuo-Wei Lin*
Dept. of Business Administration, Hsuan Chuang University,
Hsinchu City, Taiwan
The integrated circuit (IC) packaging and testing industry is an important link in the semiconductor industrial chain that may decide the success or failure of the foundry industry. The purpose of this study was to compare the competitiveness of the packaging and testing industry in the rear section of the foundry process in Taiwan. Starting from the financial data of six listed companies and using Grey theory, this study summarizes their five factors of competition: scale, growth, profit, efficiency and risks. The study confirmed that the model is able to effectively compare the competitiveness of corporations in the same industry.
Keywords: Competitiveness, foundry, outsourced assembly and test, financial analysis, grey theory
JEL:C02, C60
Semiconductor refers to a substance that can
conduct electric current under some
circumstances, while it can be used as an
insulator under other circumstances (Bouguezzi et
al., 2016; Tirkel, 2013). An integrated circuit (IC)
means that on a semiconductor substrate, many
electronic circuits are combined into various
electronic components, such as diodes and
transistors through oxidation, etching, and
diffusion, and laminated onto a small area to
complete certain logic functions (AND, OR, NAND
etc.) and to further achieve pre-set circuit
functions (Wang and Pan, 2016; Zhao and Wu,
2016). The raw material of a semiconductor is
“silicon” of sand. Silicon itself is an insulator, but
if we add a small amount of impurity atoms, it
will become a little conductive, but not too
conductive, semiconductor (Li and Schlichtmann,
2015). If we further divide a small silicon into
several areas and add different impurity atoms
into each area, the semiconductor turns into a
very small volume of a current switch through this
special design. After combining different kinds of
switches, a firm can produce a chip used for
mobile phones or computers with various zoom
and control functions.
The semiconductor industry chain includes the
IP (Intellectual Property) design industry and the
IC design industry in the upstream; IC
manufacturing, wafer fabrication and related
production processes and testing equipment,
photo mask, and other businesses in the
mid-stream; and the IC packaging and testing industry
in the downstream (Cesaroni and Piccaluga,
2013). The most important industry here is IC Manuscript received June, 4, 2016; revised September 5, 2016; accepted
packaging and testing, because it ultimately may
decide the success or failure of a semiconductor
product. IC packaging uses a plastic, ceramic, or
metal substance to coat the grain of a finished
wafer so that the grain can avoid contamination
and be easily assembled. This industry also helps
to design for achieving better effects of electrical
connection and heat radiation from the wafer and
electronic system.
IC testing can be divided into two stages. One
is the wafer testing before packaging, which
mainly tests the electric properties. The other is
the IC finished product test, which mainly tests IC
functions and whether the electric properties and
heat radiation are normal so as to ensure product
quality. The IC packaging and testing industry in
Taiwan is the global industry leader. Its yearly
output value of over $10 billion makes a great
contribution to the economic development of
Taiwan. Therefore, this study establishes a Grey
theory model to compare the competitiveness of
Taiwan’s IC packaging and testing industry.
Grey Competitive Model
Prior research indicates that Grey theory can be
effectively applied to overcome unpredictability
problems in cases of discrete data and deficient
information (Rajesh et al., 2015). The key
advantage of grey theory is that it is reliable to
generate satisfactory consequence utilizing a
relatively small amount of data or with great
factors variability (Thakur and Anbanandam,
2015). Lin et al. (2012) used the TOPSIS model
to analyze the competitiveness of five automakers
in Taiwan. Following that, Lin et al. (2013)
employed a Grey theory model to compare the
competitiveness of ten semiconductor
manufacturing firms in Taiwan. Both models
obtained good results. Thus, this study once
more utilizes Deng’s (1989) Grey theory to
analyze the competitiveness of the packaging
and testing industry in the rear section of foundry
process in Taiwan. The study steps are given
below:
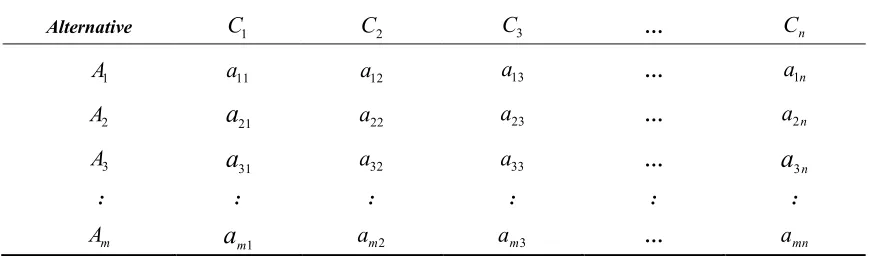
- Construction of Decision Matrix
A decision matrix is a list of values that helps
decision makers to identify and analyze sets of
information and further develops a list of options
(Cao et al., 2015; Gul and Guneri, 2016). A list of
weighted criteria were established in this study
and each option against those criteria was
evaluated. After evaluating each alternative,
performance values of each attribute were
obtained and with them we construct a decision
matrix shown in Table 1.
Each alternative has n appraisal index and could
be written as:
Alternative
C
1C
2C
3 …C
n
A
1a
11a
12a
13 …a
1n
A
2a
21a
22a
23 …a
2n
A
3a
31a
32a
33 …a
3n: : : : : :
A
ma
m1a
m2a
m3 …a
mn
[
,
,
,...,
,...,
]
32
1 i i ij in
i
i
a
a
a
a
a
A
(1)study, is the
i
th corporationIn the
that was appraised and compared,
C
j is thej
thcompetitiveness indicator, and
a
ij is theperformance value of the
j
th competitivenessindicator of the
i
th corporation.- Normalized Decision Matrix
Because the magnitude order of each
comparison index is different, if we put them on
the same standard for comparison, then it is not
fair and justified. Hence, we have to first
normalize the values. In this study, we make a
reference to the method introduced by Jiang et
al. (1988) and separately use “the higher the
better” and “the lower the better” models to
process each element of various comparison
indices according to the attribute of the index.
The target model of “the higher the better” is:
ij ij
ij ij
ij
a
i
a
i
a
i
a
x
min
max
min
(2)
The target model of “the lower the better” is:
ij ij
ij ij ij
a
i
a
i
a
a
i
x
min
max
max
(3)
In this study, except for the equity multiplier
that is the target model of “the lower the better”,
all the other comparison indices are target
models of “the higher the better.” Therefore, we
are able to obtain the normalized value
x
ij of thej
th competitiveness index of thei
th corporation.Here,
x
ij is the competition comparison indexvalue after the normalization process.
- Determine the Object Weight
Because the importance of each comparison
index is different, we have to give each index a
weight
w
j and have to satisfy the rule that thetotal value of all weights should be equal to 1.
1
1
n
j j
w
(4)
Diakoulaki et al. (1995) argued that when the
looser the results measured by a group of indices
are, the higher the importance will be for the
group of measurement indices, and so when the
standard deviation is higher, the greater the
weight will be. Therefore, when determining the
weight value, one must first obtain the standard
deviation
j of each measurement index. Theweight value of each measurement index can
then be obtained with the following formula.
nj j j j
w
1
(5)
- Establish Standard Alternative
0
A
The standard alternative is the alternative with the
values of the best condition picked from each
comparison index. It is defined as:
]
,...,
,
,
[
01 02 03 00
x
x
x
x
nA
(6)In this study, the best index value is the
maximum value of each competitiveness
i
comparison index after the normalization process
- that is:
ij j x i x max
0
i
1
,
2
,
3
,...,
m
(7)- Establish a Difference Matrix
We now calculate the difference between each
index and standard alternative index to the
following difference matrix:
mn m m m n n n...
.
..
.
.
.
...
...
...
3 2 1 3 33 32 31 2 23 22 21 1 13 12 11Note that
ij is the difference between thej
thcompetitiveness comparison index of the
i
thcorporation and the standard alternative index
after the normalization process - that is:
ij
x
ij
x
0j (9)- Calculate Grey Relational Coefficient
The Grey relational coefficient of the
j
thcompetitiveness index of the
i
th corporation andstandard alternative index is obtained by following
formula: max max min
ijij
(10)
In which:
ij
j i
min minmin
i
1
,
2
,
3
,...,
m
,
j1,2,3,...,n (11)Here,
min is the minimum value of thedifference matrix.
ij
j i
max maxmax i1,2,3,...,m
,
j1,2,3,...,n (12)Here,
max is the maximum value of thedifference matrix.
Note that
[
0
,
1
]
is the identificationcoefficient designed to adjust the difference
between the values of the individual Grey relation
coefficients. It usually takes the value of 0.5.
- Obtain Grey Relational Grade
The correlation between each alternative and
standard alternative is obtained through the
following formula:
n j j ij iw
R
1
(13)Here,
i
R
is the Grey relational grade between thei
th corporation and the standard alternative. Agreater value represents that the corporation is
closer to the standard alternative, and the
performance value of their competitiveness
comparison will be higher.
Selection for Competitiveness Indicators’ Evaluation
Jin (2004) pointed out that the comparisons of
enterprise competitiveness in China should
include four factors: scale, growth, profit, and
brand. However, because the measurement value
of the indicator of a brand factor does not easily
establish an objective standard measurement,
this study therefore makes a reference to the
model of Lin et al. (2012, 2013), who divided the
comparison index into five factors: scale, growth,
profit, efficiency, and risks. Table 2 shows the
evaluation indicators of each factor and
Application of Grey Competitiveness Model
In this study we selected six listed packaging and
testing firms from the foundry industry of Taiwan.
They are Advanced Semiconductor Manufacturing
Co. (ASE), Siliconware Precision Industry Co.,
Ltd. (SPIL), Powertech Technology Co., Ltd.
(PTI), ChipMos Technologies Ltd. (Chip MOS),
Chipbond Science and Technology Co., Ltd.
(Chipbond), and King Yuan Electronics Co., Ltd.
(KYEC Group). We extracted data from their
public financial statements (see Table 3) to
explore each corporation’s competitiveness.
Calculating the financial data of the six listed
companies in Table 3 according to the methods
shown in Table 2, we obtained the decision
matrix shown in Table 4.
According to the target methods of “the higher
the better” and “the lower the better” as shown in
formula (2) and formula (3), we next normalized
the data as shown in Table 4. Except for the
equity multiplier evaluation indicator in the risk
factor that has to be calculated according to the
target method of “the lower the better” as given
in formula (3), the rest of the evaluation
indicators are the greater the more competitive,
which have to be calculated according to the
target method of “the higher the better.” Thus
we obtained the normalized data as shown
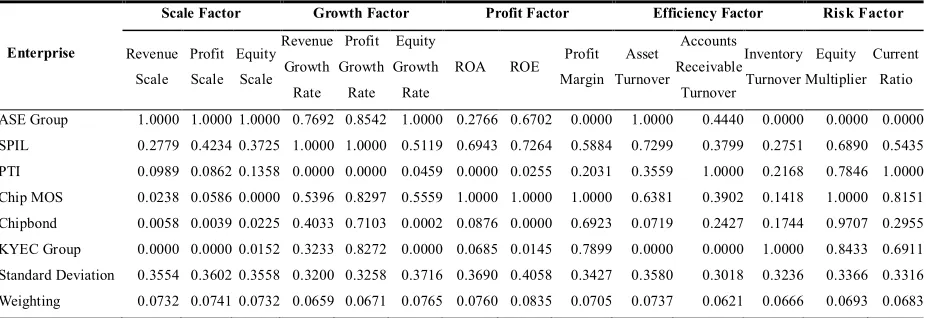
in Table 5. We further calculated the standard
deviation of each evaluation indicator from the
normalized data and then substitute them into
formula (5) to obtain the weight value of each
evaluation indicator.
Categ ory Rat io Formula
Scale Factor
Revenue Scale 2014 Revenue / To tal 20 14 Revenue of all En terp rises Profit Scale 2014 Profit / To tal 2 014 Profit of all En terprises Equ ity Scale 2014 Equ ity / To tal 2014 Equ ity of all Enterpr is es
Gro wth Fac tor
Revenue Growth Rate (2014 Revenue / 2013 Revenu e) - 1
Profit Gro wth Rate (2014 Prof it / 2013 Profit) – 1 Equ ity Growth Rate (2014 Equ ity / 2 013 Equ ity) - 1
Pro fit Factor
ROA 2014 Net Profit / 2014 Average Asset
ROE 2014 Net Profit / 2014 Average Equ ity
Profit Mar gin 2014 Net Profit / 2014 Re venue
Eff iciency Factor
Asset Turno ver 2014 Revenue / 2014 Average Asse t
Acco unts Receivab le Turnover 2014 Revenue / 2014 Average Accou n ts Receivab le Inven tory Turno ver 2014 Cos t / 2014 Average In ven to ry
Ris k Fa ctor Equ ity Mu ltip lier 2014 Assets / 2014 Equ ity
Current Ratio 2014 Cu rren t Assets / 201 4 Current Liab ility
Table 2: Definitions of Evaluation Indicators for the Five Factors
Enterprise Revenue Profit Asset Equity Cost Accounts
Receivable Inventory
Current Assets
Current Liabilities
ASE Group 8,465,652 799,153 11,018,630 5,227,239 6,699,230 1,746,002 1,456,615 5,277,358 3,668,774
SPIL 2,740,754 387,044 4,280,860 2,379,179 2,048,521 612,604 144,546 1,821,460 859,901
PTI 1,321,011 146,048 2,291,449 1,304,597 1,101,340 138,633 85,191 943,342 350,779
Chip MOS 726,009 126,302 1,142,706 688,389 555,384 158,872 56,242 676,660 275,284
Chipbond 583,412 87,210 1,322,765 790,618 442,857 158,561 33,990 635,134 351,269
KYEC Group 537,048 84,453 1,310,549 757,475 375,986 115,308 9,445 426,377 185,143
Because the optimal value after normalization
should be 1, the value of each element in
standard alternative
A
0, which was establishedby formula (6), is 1. We now substitute them into
formula (8) and formula (9) and establish the
difference matrix as shown in Table 6.
From Table 6, we can see that
min
0
and1
max
. Substituting each
value into formula(10), we next obtain the Grey relational coefficient
in Table 7. We then multiply the Grey relational
coefficient by the weight value in Table 1 and
sum them up through formula (13) to figure out
the Grey relational grade given in Table 7.
A higher value represents being closer to the
standard alternative and denotes a corporation
with higher competitiveness. From Table 7, we
note that the top one is ASE, followed in order by
Enterprise
Scale Factor Growth Factor Profit Factor Efficiency Factor Ris k Factor
Revenue Scale
Profit Scale
Equity Scale
Revenue Growth Rate
Profit Growth
Rate Equity Growth
Rate
ROA ROE Profit
Margin Asset Turnover
Accounts Receivable
Turnover Inventory Turnover
Equity Multiplier
Current Ratio
ASE Group 0.5890 0.4902 0.4689 0.1671 0.4994 0.2459 0.0780 0.1696 0.0944 0.8267 5.3370 5.1392 2.1079 1.4385
SPIL 0.1907 0.2374 0.2134 0.1978 0.9909 0.1544 0.1013 0.1743 0.1412 0.7175 4.8978 15.4285 1.7993 2.1182
PTI 0.0919 0.0896 0.1170 0.0647 -2.3811 0.0669 0.0626 0.1156 0.1106 0.5663 9.1435 13.2464 1.7564 2.6893
Chip MOS 0.0505 0.0775 0.0618 0.1365 0.4167 0.1626 0.1184 0.1973 0.1740 0.6804 4.9682 10.4424 1.6600 2.4580
Chipbond 0.0406 0.0535 0.0709 0.1184 0.0139 0.0584 0.0675 0.1134 0.1495 0.4515 3.9587 11.6628 1.6731 1.8081
KYEC Group 0.0374 0.0518 0.0680 0.1077 0.4084 0.0583 0.0664 0.1147 0.1573 0.4225 2.2967 42.5408 1.7302 2.3030
Table 4: Decision Matrix of Business Competitiveness Comparison Indices
Enterprise
Scale Factor Growth Factor Profit Factor Efficiency Factor Ris k Factor
Revenue
Scale Profit
Scale Equity
Scale Revenue
Growth
Rate Profit
Growth
Rate Equity
Growth
Rate
ROA ROE Profit
Margin Asset
Turnover Accounts
Receivable
Turnover Inventory
Turnover Equity
Multiplier Current
Ratio
ASE Group 1.0000 1.0000 1.0000 0.7692 0.8542 1.0000 0.2766 0.6702 0.0000 1.0000 0.4440 0.0000 0.0000 0.0000
SPIL 0.2779 0.4234 0.3725 1.0000 1.0000 0.5119 0.6943 0.7264 0.5884 0.7299 0.3799 0.2751 0.6890 0.5435
PTI 0.0989 0.0862 0.1358 0.0000 0.0000 0.0459 0.0000 0.0255 0.2031 0.3559 1.0000 0.2168 0.7846 1.0000
Chip MOS 0.0238 0.0586 0.0000 0.5396 0.8297 0.5559 1.0000 1.0000 1.0000 0.6381 0.3902 0.1418 1.0000 0.8151
Chipbond 0.0058 0.0039 0.0225 0.4033 0.7103 0.0002 0.0876 0.0000 0.6923 0.0719 0.2427 0.1744 0.9707 0.2955
KYEC Group 0.0000 0.0000 0.0152 0.3233 0.8272 0.0000 0.0685 0.0145 0.7899 0.0000 0.0000 1.0000 0.8433 0.6911
Standard Deviation 0.3554 0.3602 0.3558 0.3200 0.3258 0.3716 0.3690 0.4058 0.3427 0.3580 0.3018 0.3236 0.3366 0.3316
Weighting 0.0732 0.0741 0.0732 0.0659 0.0671 0.0765 0.0760 0.0835 0.0705 0.0737 0.0621 0.0666 0.0693 0.0683
Table 5: Normalized Comparing Indices
Enterprise
Scale Factor Growth Factor Profit Factor Efficiency Factor Risk Factor
Revenue Scale
Profit Scale
Equity Scale
Revenue Growth
Rate Profit Growth
Rate Equity Growth
Rate
ROA ROE Profit
Margin Asset Turnover
Accounts Receivable
Turnover Inventory Turnover
Equity Multiplier
Current Ratio
ASE Group 0.0000 0.0000 0.0000 0.2308 0.1458 0.0000 0.7234 0.3298 1.0000 0.0000 0.5560 1.0000 1.0000 1.0000 SPIL 0.7221 0.5766 0.6275 0.0000 0.0000 0.4881 0.3057 0.2736 0.4116 0.2701 0.6201 0.7249 0.3110 0.4565
PTI 0.9011 0.9138 0.8642 1.0000 1.0000 0.9541 1.0000 0.9745 0.7969 0.6441 0.0000 0.7832 0.2154 0.0000
Chip MOS 0.9762 0.9414 1.0000 0.4604 0.1703 0.4441 0.0000 0.0000 0.0000 0.3619 0.6098 0.8582 0.0000 0.1849 Chipbond 0.9942 0.9961 0.9775 0.5967 0.2897 0.9998 0.9124 1.0000 0.3077 0.9281 0.7573 0.8256 0.0293 0.7045 KYEC Group 1.0000 1.0000 0.9848 0.6767 0.1728 1.0000 0.9315 0.9855 0.2101 1.0000 1.0000 0.0000 0.1567 0.3089
Chip MOS, SPIL, KYEC, PTI, and Chipbond.
DISCUSSION
ASE, ranked top on the list, has been aggressive
in the global IC packaging and testing industry by
expanding capacity. The firm is ranked number
one on four factors: scale, growth, efficiency and
risks. Although ASE’s factor of profit is not the
highest, it is able to rapidly respond to changes in
the external operating environment, allowing them
keep the number title in the global packaging and
testing industry. Therefore, this research ranks
ASE as being No. 1 in comprehensive
competitiveness.
In second place is Chip MOS, with a scale
factor of four. However, because Chip MOS is
able to precisely foresee investment planning and
strictly control costs, its profit factor is the best
among the six firms. Because it maintains steady
profit growth, its overall competitiveness is in
second place.
Third place is for SPIL. It has rapidly
expanded its capacity and ranks at the top for
three factors: scale, growth, and profit. Its risk
factor is ranked in the middle. SPIL’s operation
strategy is steady growth, and hence its
comprehensive competitiveness is ranked third.
In fourth place is for KYEC. Despite its scale
factor being ranked in last place, it has
continuously invested in the expansion of new
plants to increase the production of CMOS
sensors, consumer electronic components,
MEMS, and the capacity of part logic IC testing.
Hence, KYEC’s growth, profit, efficiency, and risk
factors are ranked in the middle. It has also
adopted an operation strategy of steady growth.
Therefore, its comprehensive competitiveness is
in fourth place.
PTI is on fifth number. Due to over-reliance
on orders from Japanese DRAM giant Elpida,
when Elpida shocked the DRAM industry and
unexpectedly filed for bankruptcy on February 27,
2012, all of PTI’s scale, growth, and profit factors
slid to last place. As a result, its overall
competitiveness slid to fifth place.
Last place is for Chipbond, as its four factors
of scale, growth, profit, and efficiency are all at
the bottom. This shows that Chipbond has been
unable to rapidly respond to changes in the
external operating environment. As a result, its
pace of capacity expansion and vertical
technology integration is slower compared to the
other firms. Thus, Chipbond’s overall
competitiveness is ranked last. Enterprise
Scale Factor Growth Factor Profit Factor Efficiency Factor Risk Factor Grey Relational
Grade Rank Revenue
Scale Profit Scale
Equity Scale
Revenue Growth Rate
Profit Growth
Rate Equity Growth
Rate
ROA ROE Profit Margin
Asset Turnover
Accounts Receivable
Turnover Inventory Turnover
Equity Multiplier
Current Ratio
ASE Group 0.0000 0.0000 0.0000 0.2308 0.1458 0.0000 0.7234 0.3298 1.0000 0.0000 0.5560 1.0000 1.0000 1.0000 0.6701 1 SPIL 0.7221 0.5766 0.6275 0.0000 0.0000 0.4881 0.3057 0.2736 0.4116 0.2701 0.6201 0.7249 0.3110 0.4565 0.5895 3 PTI 0.9011 0.9138 0.8642 1.0000 1.0000 0.9541 1.0000 0.9745 0.7969 0.6441 0.0000 0.7832 0.2154 0.0000 0.4676 5 Chip MOS 0.9762 0.9414 1.0000 0.4604 0.1703 0.4441 0.0000 0.0000 0.0000 0.3619 0.6098 0.8582 0.0000 0.1849 0.6442 2 Chipbond 0.9942 0.9961 0.9775 0.5967 0.2897 0.9998 0.9124 1.0000 0.3077 0.9281 0.7573 0.8256 0.0293 0.7045 0.4399 6 KYEC Group 1.0000 1.0000 0.9848 0.6767 0.1728 1.0000 0.9315 0.9855 0.2101 1.0000 1.0000 0.0000 0.1567 0.3089 0.4883 4
CONCLUSION
Extracting data from the public financial
statements issued by six listed packaging and
testing corporations in 2013 and 2014, this study
employed the characteristics of Grey theory to
analyze their competitiveness. The results were
then compared with their actual operating
situation in the first half of 2015. We are able to
confirm that using Grey theory to establish a
competitiveness comparison model can truly
reflect a corporation’s future competitiveness.
REFERENCES
Bouguezzi, S., Ayadi, M. & Ghariani, M. (2016). Developing a simple analytical thermal model for discrete semiconductor in operating condition. Applied Thermal Engineering, 100, 155-169.
Cao, Q., Wu, J. & Liang, C. (2015). An intuitionistic fuzzy judgement matrix and TOPSIS integrated multi-criteria decision making method for green supplier selection.
Journal of Intelligent and Fuzzy Systems, 28(1): 117-126. Cesaroni, F. & Piccaluga, A. (2013). Operational challenges
and ST's proposed solutions to improve collaboration between IP and R&D in innovation processes. California Management Review, 55(4): 143-156.
Deng J.L. (1989). Introduction to Grey system theory. The Journal of Grey Systems, 1, 1-24.
Diakoulaki, D., Mavrotas, G. & Papayannakis, L. (1995). Determining object weights in multiple criteria problem: The CRITIC method. Computers and Operations Research, 22, 763-770.
Gul, M. & Guneri, A. F. (2016). A fuzzy multi criteria risk assessment based on decision matrix technique: A case study for aluminum industry. Journal of Loss Prevention in the Process Industries, 40, 89-100.
Jiang, J.S., Wu, P.L., Zhang, X.D., Chang, T.H., Chan, S.F., Chang, H.T. & Wen, K.L. (1988). Introduction to Grey Theory, Gau-li Book Co., Taiwan.
Jin, P. (2004). The Report on China’s Enterprises Competitiveness. 1st Ed., Social Sciences Academic Press,
China.
Li, B. & Schlichtmann, U. (2015). Statistical timing analysis and criticality computation for circuits with post-silicon clock tuning elements. IEEE Transactions on Computer-Aided Design of Integrated Circuits and Systems, 34(11): 1784-1797.
Lin, K.W. (2013). The appraisal model of competitiveness for the foundry industry in Taiwan. Pakistan Journal of Statistics, 29(5): 711-724.
Lin, K.W., Kuan, C.M. & Ni, M.H. (2012). The rating of operating performance of domestic auto industry. Journal of Computer Science, 8(11): 1822-1829.
Rajesh, R., Ravi, V. & Venkata, R. R. (2015). Selection of risk mitigation strategy in electronic supply chains using grey theory and digraph-matrix approaches. International Journal of Production Research, 53(1): 238-257.
Thakur, V. & Anbanandam, R. (2015). Supplier selection using grey theory: A case study from Indian banking industry. Journal of Enterprise Information Management, 28(6): 769-787.
Tirkel, I. (2013). Forecasting flow time in semiconductor manufacturing using knowledge discovery in databases.
International Journal of Production Research, 51(18): 5536-5548.
Wang, K. & Pan, Z. (2016). An analytical model for steady-state and transient temperature fields in 3-D integrated circuits. IEEE Transactions on Components, Packaging and Manufacturing Technology, 6(7): 1028-1041.