Real Time Driver’s Drowsiness Detection by Processing the
EEG Signals Stimulated with External Flickering Light
Amjad Hashemi1, Valiallah Saba2*, Seyed Navid Resalat3
1. Institute for Advanced Medical Technologies (IAMT), Tehran University of Medical Sciences, Tehran, Iran. 2. AJA University of Medical sciences, Tehran, Iran
3. Control and Intelligent Processing Center of Excellence, School of Electrical and Computer Engineering, College of Engineering, University of Tehran, Tehran, Iran.
* Corresponding Author: Valiallah Saba, PhD
Radiation Research Center, Faculty of Paramedicine, AJA University of Medical Sciences, Etemadzadeh Ave., Fatemi St., Tehran, Iran Tel: +98 8595 2438
E-mail: [email protected]
The objective of this study is development of driver’s sleepiness using Visually Evoked
Potentials (VEP). VEP computed from EEG signals from the visual cortex. We use the Steady State VEPs (SSVEPs) that are one of the most important EEG signals used in human computer interface systems. SSVEP is a response to visual stimuli presented. We present a classification
method to discriminate between closed eyes and opened eyes. Fourier transforms and power spectrum density features extracted from signals and Multilayer perceptron and radial basis
function neural networks used for classification. The experimental results show an accuracy
of 97% for test data.
A B S T R A C T
Article info:
Received: 16 November 2012
First Revision: 22 January 2013
Accepted: 09 June 2013
Key Words:
1. Introduction
river’s sleepiness is a most important factor of many road accidents. According to the National Sleep Foundation, around 51% of drivers have driven a vehicle while feeling drowsy and 17% have fallen asleep behind the wheel that cause up to 100,000 crashes are related to drowsiness and sleepiness annually and each year more than 1,500 fatalities are associated with such crashes (McCartt, Ribner, Pack, & Hammer, 1996). Driving is a complex task involving distinct cognitive, perceptual, motor and decision-making skills (Reddy, Basir, & Leat, 2007). The ability to make decisions in driving reduces to 50% if attention or the alertness decreases by the sleep deprivation. An appropriate level of alertness is essential to guarantee the safekeeping of the driver and the other road users. Reducing the extent of sleepy driving prob-lem is critical to improve the safety of roads and high-ways [McCartt, Ribner, Pack, & Hammer, 1996).
D
effective than the methods of protection from the colli-Today, the methods to prevent such accidents are more sions (McCartt, Ribner, Pack, & Hammer, 1996). Avail-able techniques for detecting drowsiness and sleepiness in drivers can be generally divided into the following categories: sensing of driver operation, sensing of vehi-cle response, monitoring the response of driver, ranging from lane detection mechanisms, traffic analysis vision systems, sensing of physiological characteristics and tiredness estimation systems (Grace, Byrne, Bierman, Legrand, 1998, Papadelis, 2007).noninvasive, new, simple and cheep technique to check the alertness of drivers. Steady-State VEP (SSVEPs) and pattern Onset/Offset VEP (POVEP) extract from the VEP signals. SSVEPs are one of the most important EEG signals used in Human Computer Interface (HCI) systems. These signals are generated by looking at flick-ering external light sources with frequency ranging from 4 to 75 Hz that stimulating the central part of the retina generated by the human visual cortex. The pattern On-set/Offset VEP (POVEP) is generated when a sudden flash is confronted to the vision system (Resalat, Saba, Afdideh, & Heidarnejad, 2012; Muller-Putz, Scherer, Brauneis, & Pfurtscheller, 2005). It is seen that the SS-VEP is related to the attention level.
In the last decade, researcher proposed new techniques to driver’s monitoring and prevent of sleepiness. Daim-ler-Chrysler has developed a driver alertness system, which evaluates the EEG patterns of the driver under stress (Reddy, Basir, & Leat, 2007). C.T. Lin proposed a system using the EEG signals of the driver during a driving simulation (Lin, Wu, Ruei-Cheng, Liang, Chao, Chen, Jung, 2005). B. S. Reddy designed a simulated environment in the laboratory to estimate the attention level of drivers. They used a CRT monitor and an LED to generate SSVEPs and POVEPs, respectively. They found that lower accuracy levels corresponding to non-attentive situation have higher Shannon and Renyi en-tropy. In addition, they used an external light source of 10 Hz that caused confusion, distraction and eye tired-ness in person, also the position of the LED which pro-duces POVEPs is almost in the direct view of the driver. Beside of those, the CRT monitor that made flickering light sources is probably difficult to be implemented in a car and it is expensive. To overcome these problems, Resalat, Saba, & Afdideh (2012), implement a new prac-tical driver’s sleepiness detection system with single and paired LEDs based on SSVEPs. They classify closed eyes and opened eyes with extracted Fourier transform (FT) and power spectrum density (PSD). The linear dis-criminate analysis (LDA) and support vector machine (SVM) was used for classifier. The result of it for short time sleepiness detection is not satisfactory.
In this research, we will try to improve and enhance the short time detection of the closed eye patterns in terms of the accuracy from Resalat, et al. database. We use new features and better classifiers to get desirable results. Ac-cording to our results, with the use of new features and the Artificial Neural Network (ANN) classifier, the de-tection rate of the sleepiness increases.
2. Methods
In this research, the database of Resalat, Saba, & Afdi-deh (2012), is used. The data was recorded in a laborato-ry close to the situations existing in a car. To accommo-date each subject to the real situation, the environmental lights are on.
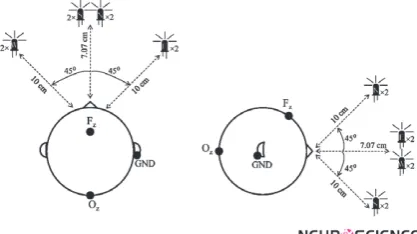
The LEDs are placed in all four main directions. These LEDs are not within the driver’s main point of view. Fig. 1 demonstrates the experimental setup proposed in this study. Four flickering white LEDs are fixed in four main directions. The lights of the LEDs enter the visual field of each subject in 45° either horizontally or vertically while they are in a plane, 10 cm away from the subject, as seen in Fig. 1. The background luminance of the ex-periment was around 150 cd/m2 while the source lumi-nance was around 800 cd/m2 for various subjects and at different EEG-recording sessions. Therefore, the modu-lation depth is 68% (Wu, Lai, Xia, Wu, & Yao, 2008). The second proposed experimental setup is the same as the first one except that the number of LEDs at each di-rection is doubled. The modulation depth in this state is 95%. Fig. 1 demonstrates the second experimental setup proposed in this study.
Figure 1. The position of the LEDs and electrodes in the sec-ond experimental setup. The left and the right images are the projection of the setup in sagittal and transverse planes, respectively.
Each subject was instructed to gaze directly to the cen-ter of the LED’s plane, for 5 sessions each of 1 minute. Therefore, 5 minutes data is recorded with the open-eyes. The same procedure was accomplished with the close-eyes within the same recording time. Both situa-tions were performed in the presence of twinkling LEDs and the frequency of all LEDs was set at 15 Hz and 20 Hz. Lower frequencies is not chosen because they can afflict the human eyes due to their discontinuity flickers and distraction of the driver’s attention. These trials were repeated for the two proposed experimental setups.
Pattern recognition consists of two steps. At the first step features are extracted from the signals in such a way that represent the signal very well. These features should contain all important information about the signal. Then according to a tradeoff between required accuracy and computation cost, a smaller number of meaningful fea-tures are selected. The second step is the classification, i.e. a specific pattern is allocated to a class based on the characteristic features selected for it.
In order to evaluate the proposed system in real-time applications, three temporal durations (sweeps) of 0.5, 1 and 2 seconds were considered. Each 5-minute data is divided into non-overlapping segments with the length equal to each sweep. For example, considering the sweep length of 1 second, each 300 seconds (5-minute) data has 300 observations. Therefore, 300 segments are available for the opened eyes and 300 ones for the closed eyes for each subject. Finally we extracted Fourier trans-form (FT) and power spectrum density (PSD) features and their harmonics in the Fourier domain.
• FFT-Based Feature: This feature computes the ab-solute value of the Fast Fourier Transform (FFT) of each observation and divides it by N, which is the total amount of samples in frequency domain, then selects the amplitudes of the main frequencies, the mathemat-ical representation is as follows:
{ }n f MF FFT x feature
N
= =
Where |•| is the absolute operator, FFT{•} is the Dis-crete Fourier Transform, is the segmented data in each sweep length, f is the frequency, MF is the main twinkling frequency and their harmonics (15 Hz or 20 Hz) and N is the total number of samples in frequency domain.
• PSD-Based Feature: This feature computes the Power Spectral Density (PSD) of each observation through the Fourier transform of the autocorrelation of each observation. The formula is as follows:
{ n} xx f MF FFT R feature N = =
Where is the autocorrelation function of the nth segment xn (t).
In the phase of classification, Multilayer perceptron (MLP) and radial basis function (RBF) neural network was used. ANN is simple models of the biological ner-vous system. They are made up of large number of simple and highly interconnected processing elements (called nodes or artificial neurons) normally arranged in a layered structure. ANNs are extensively used in bio-medical field of modeling, data analysis, and diagnostic classification.
A Multilayer Perceptron (MLP) neural network is an adaptive system with a training algorithm that changes weights to minimize the error between the target and the network’s output. The training process is continued until a predefined minimum of the output error is achieved. In this study, the Levenberg– Marquardt (LM) training al-gorithm is used. RBF network is a special type of neural network that uses a radial basis function as its activa-tion funcactiva-tion. Because of their universal approximaactiva-tion, more compact topology and faster learning speed, RBF networks have attracted considerable attention and they have been widely applied in many science and engineer-ing fields.
3. Results
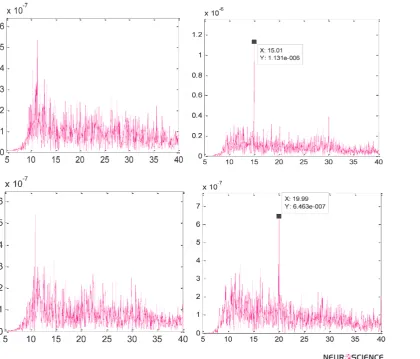
In this section, the experimental results of the proposed system are presented. Fig. 2 displays the averaged EEG signals of all five subjects within a specified and observ-able scale in frequency domain for our two experimental setups. Two states of subjects’ opened and closed eyes are considered. As it can be seen, the peak amplitude of the 20 Hz is more dominant in eyes opened state while in the eyes closed one, there is no significant peak am-plitude dominancy in the frequency domain for the two experimental setups.
Figure 2. Averaged spectrums of EEG signals of all subjects; top left and top right figure correspond to 4 LEDs in close and open eyes states, respectively; bottom left and bottom right corresponds to 4 pairs LEDs in close and open eyes states, respectively.
Table 1. Accuracy of the MLP classifier with FFT and PSD features over the sweep lengths. (A) And (B) correspond to external light sources of 15 HZ and 20 HZ for test data.
(A)
Accuracy (%) FFT Features PSD Features
0.5s sweep 1s sweep 2s sweep 0.5s sweep 1s sweep 2s sweep
Sub #1 88.5 89.2 93 88.5 95.4 97.1
Sub #2 89.7 94.2 95 88.9 95.4 96.4
Sub #3 87.3 95 98.2 90.4 96 97
Sub #4 90 93.3 97.3 90.2 93.4 96.9
Sub #5 90.3 95 98 90.6 95 97.7
Averaged Acc 89.16 93.34 96.3 89.72 95.04 97.02
(B)
Accuracy (%) 0.5s sweep FFT Features1s sweep 2s sweep 0.5s sweep PSD Features1s sweep 2s sweep
Sub #1 87.5 88.6 91.4 88.1 89.5 96
Sub #2 89.4 91.2 93.3 87.9 94.2 93.2
Sub #3 87.1 92.2 95.7 88.4 94 95 Sub #4 89.5 91.3 94.6 88.2 90.9 97.1
Sub #5 88.6 92 96 90.4 93 96.7
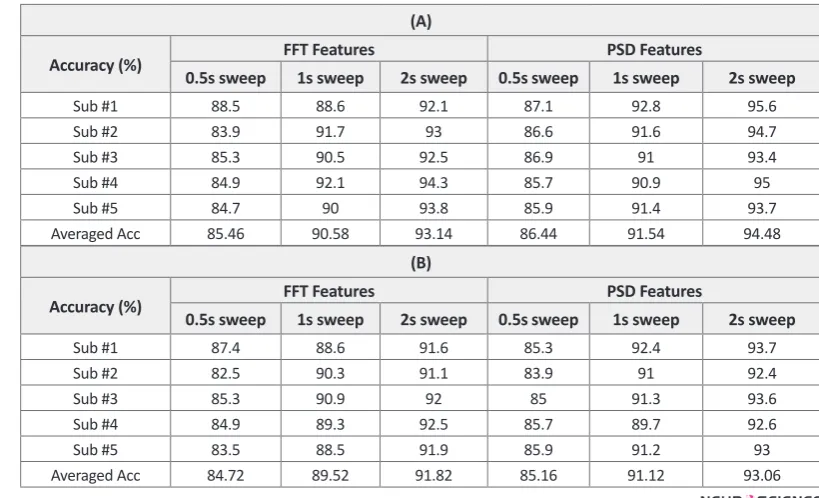
Table II represents the accuracy of the RBF classifier using the same parameters of Table II. As it can be seen in Table II (B), the accuracies are significantly higher than that in Table I (A) and with sweep lengths increase, the averaged accuracy also increases. This is more obvi-ous in Table II (B), either.
4. Discussion
In this paper, we apply new features and better classifier to enhance the performance of monitoring system, which detects the driver’s sleepiness. To do so, the EEGs are recorded from the occipital area in two states of closed and opened eyes, and three different sweep lengths of 0.5, 1 and 2 seconds are employed. Then, two methods are applied to each corresponding observation to extract features. Finally, the features are classified with two clas-sifiers of the ANN and RBF.
It can be seen that the best result is achieved with sweep length of 2 seconds is 97% for test data. The best results for 1 and 0.5 second sweep are 95% and 89.7%, respec-tively. Resalat et al. achieved 94%, 85.4% and 75.4% for 2, 1 and 0.5 second respectively. This results show the
new features and better classifier enhance short time detec-tion closed eye. Table I and Table II show that the overall performance of the MLP classifier is better than RBF clas-sifier in all sweep lengths and external stimulants.
The accuracies of the 15 Hz external stimulant are al-most higher than those of the 20 Hz one in two classifiers and sweep lengths. This is because the eyes are more sensitive to lower frequencies, like a low-pass filter. With an increase in sweep lengths, the accuracy of each classifier also increases. This is due to the cumulative ef-fects of the main flickering frequency (15 Hz or 20 Hz) in higher sweep lengths in the frequency domain.
Finally, it should be stated that for online driver’s sleep-iness detection applications, the MLP and RBF classifier with the sweep lengths of 2, 1 and 0.5 second sweep us-ing the PSD and Fourier feature extraction method intro-duced in this research.
\
Acknowledgments
This work is partly supported by AJA University of medical science. Tehran, Iran.
sources, with sweep lengths increment the total accuracy is also increase in both methods. However, the accuracy of the second feature extraction method is almost higher than that of the first one. Although the overall behavior
of Table I (B), which shows the results of the external light source of 20 Hz, is the same as Table I (A), the performance of external light source of 15 Hz is better than 20 Hz.
Table 2. Accuracy of the RBF classifier with FFT and PSD features over the sweep lengths. (A) And (B) correspond to external light sources of 15 HZ and 20 HZ for test data.
(A)
Accuracy (%) FFT Features PSD Features
0.5s sweep 1s sweep 2s sweep 0.5s sweep 1s sweep 2s sweep
Sub #1 88.5 88.6 92.1 87.1 92.8 95.6
Sub #2 83.9 91.7 93 86.6 91.6 94.7
Sub #3 85.3 90.5 92.5 86.9 91 93.4
Sub #4 84.9 92.1 94.3 85.7 90.9 95 Sub #5 84.7 90 93.8 85.9 91.4 93.7
Averaged Acc 85.46 90.58 93.14 86.44 91.54 94.48
(B)
Accuracy (%) 0.5s sweep FFT Features1s sweep 2s sweep 0.5s sweep PSD Features1s sweep 2s sweep
Sub #1 87.4 88.6 91.6 85.3 92.4 93.7
Sub #2 82.5 90.3 91.1 83.9 91 92.4
Sub #3 85.3 90.9 92 85 91.3 93.6
Sub #4 84.9 89.3 92.5 85.7 89.7 92.6
Sub #5 83.5 88.5 91.9 85.9 91.2 93
References
Grace, R. Byrne, V. E. Bierman, D.M Legrand, J. M. (1998). A drowsy driver detection system for heavy vehicles, Digital Avionics Systems Conference, 2(136), 1-8.
Johns, M. W. (2000). A sleep physiologist's view of the drowsy driver, Transportation Research Part F: Traffic Psychology and Behavior, 3(4), 195-209.
Lin, C.T. Wu, Ruei-Cheng, Sheng-Fu Liang, Wen-Hun Chao, Yu-Jie Chen, Tzzy-Ping Jung. (2005). EEG Based Drowsiness Estimation for Safety Driving Using Independent Compo-nent Analysis, IEEE Transactions on Circuits and Systems, 52(12), 2726 – 2738.
McCartt, A. T. Ribner, S. A. Pack, A. I., & Hammer, M. C. (1996). Accident Analysis & Prevention, 28(4), 511–517.
Muller-Putz, G. R. Scherer, R. Brauneis, Ch., & Pfurtscheller, G. (2005). Steady-state visual evoked potential (SSVEP)-based communication: impact of harmonic frequency components, Institute of physics publishing, Journal of Neural Eng, 2, 123–130.
Papadelis, C. (2007). Monitoring sleepiness with on-board elec-trophysiological recordings for preventing sleep-deprived traffic accidents, Clinical Neurophysiology, 118(9), 1906-1922.
Reddy, B. S. Basir, O. A., & Leat, S. J. (2007). Estimation of driv-er attention using Visually Evoked Potentials, IEEE Intelli-gent Vehicles Symposium, 588-593.
Resalat, S. N. Saba, V. Afdideh, F., & Heidarnejad, A. (2012). High-speed SSVEP-based BCI: Study of various frequency pairs and inter-sources distances, IEEE International Con-ference on Biomedical and Health Informatics(BHI), IEEE-EMBC, 220-223.
Resalat, S. N. Saba, V.,& Afdideh, F. (2012). A Novel System for Driver’s Sleepiness Detection using SSVEP, 16th CSI In-ternational Symposium on Artificial Intelligence and signal processing (AISP), 343-347.