INTRODUCTION
Polymeric composites – laminates – are cur-rently one of the most rapidly developing groups of materials applied in contemporary thin-walled structures. This is connected with an advanta-geous set of physicochemical and mechanical properties, particularly high strength in relation to low mass density of the composite material [1, 2]. From a wide group of laminates mainly those having epoxy matrix reinforced with glass, carbon or kevlar fibers, find applications. Excep -tionally advantageous strength characteristics of a laminate can be obtained by utilization of ad-vanced forming techniques of polymeric compos-ites, such as autoclaving [3].
In the design process of complex composite materials an important role is played by a se-quence of plies, having a decisive influence on load carrying abilities of particular components of the stress state. This applies to thin-walled composite structures stability as well, in which a specific ply sequence can have an essential in -fluence on a value of critical load or a structure’s stiffness in the post-critical state [4–9].
In this work, the results of experimental tests on thin-walled composite columns of top-hat
cross-section subjected to compressive load were presented. The obtained research results enable to verify the results given by FE models, as well as by author’s own analytical-numerical (ANM) method based on the Koiter theory [10]. The ex-periments also covered determination of material properties, used later in the worked out numeri-cal models. Such approach allowed more credible comparison of the prepared composite profiles behaviour with numerical models, being usually only models of ideal structures.
OBJECT OF RESEARCH
The object of the research was the thin-walled beam made of carbon-epoxy composite formed into a top-hat cross-section with the following dimensions: 80x40x1.048 mm (the cross-section) and L=300 mm (the length) – Fig.1.
The composite had epoxy matrix having the following characteristics: mass density: 1.24 g/cm3; curing temperature: 128°C; tensile strength: 64 MPa; Poisson ratio: 0.4; Young mod -ulus in tension: 5.1 GPa. The AS7J12K carbon fibres were used for reinforcement, with mass density: 2.5 g/cm3; tensile strength: 4830 MPa;
Stability Problems of Compressed Thin-Walled Structures
Hubert Debski
11 Department of Machine Design and Mechatronics, Lublin University of Technology, Lublin, Poland, e-mail: [email protected]
ABSTRACT
The object of this study involves thin-walled columns made of carbon-epoxy composite with open top-hat
cross-section. The material used comprised a composite of epoxy matrix reinforced with carbon fiber (system HexPly M12, Hexcel). The M12 system is used above all in aircraft structures. It exhibits high fatigue durability and good maintenance properties at relatively low specific gravity. The research was carried out as the FEM numerical analyses and experimental tests in buckling and post-buckling state. The numerical tool used was the ABAQUS
software.
Keywords:thin-walled columns, composite structures, buckling, finite element modelling, Volume 12, Issue 4, December 2018, pages 190–198
https://doi.org/10.12913/22998624/100441
Research Journal
Accepted: 2018.11.05Poisson ratio: 0.269; Young modulus in tension: 241 GPa. Nominal volume fraction of the rein -forcement was approximately equal to 60%.
The following mechanical characteristics were determined experimentally for the used com-posite pre-pregs, according to the ISO standard: Young moduli: E1 = 130.71 GPa, E2 = 6.36 GPa, Kirchhoff modulus: G12 = 4.18 GPa, Poisson ra -tio: n12 = 0.32. The experimentally determined strength characteristics of the carbon-epoxy com-posite were exploited in the definition of material model in the FEM calculations.
Two types of 8-ply composite columns were tested. The layups were symmetrical, as follows: (a) - [90/45/-45/0]s and (b) - [45/-45/90/0]s. Each ply had the same thickness of 0.131 mm. In Fig. 2 the used ply sequence was given.
EXPERIMENTAL INVESTIGATION
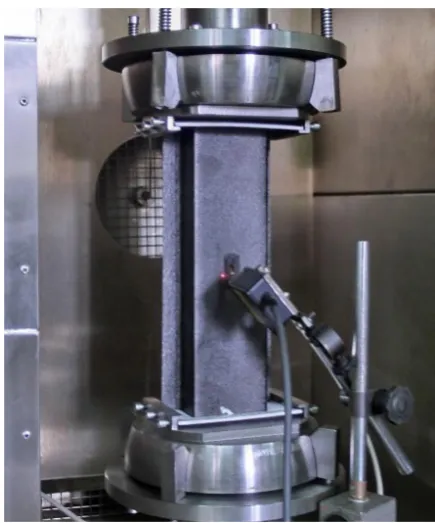
The experimental tests were conducted on axially compressed thin-walled composite col-umns with top-hat cross-section. Stand tests were performed with the Zwick Z100/SN3A 1-accura -cy class universal testing machine of the 100 kN load range – Fig.3. Any imperfections of the col -umn ends, capable of causing unwanted boundary effects, were compensated by specially prepared soft-plastic pads. Before each test, the loading system was loaded up to 15% of the expected critical load in order to provide best alignment of the column placed between the grips. Next, the grip retainers were removed and the column was completely unloaded. Vishay’s electrical strain gauges were stuck along the loading direction on
Fig. 1. Dimension of the analyzed columns
the specimen’s internal and external surfaces in the vicinity of the largest web’s deflection area,. The two CEA-06–125UW-350 series gauges had a constant k=2.135±0.5 % and electrical resis-tance of 350 Ω±0.3 %. In addition, the deflections were measured with the optoNCDT 1605 laser dilatometer. All the measurement elements were plugged to the MGCplus system (Hottinger). During the tests the indications of all sensors were registered with a frequency of 1 Hz.
All tests were conducted under standard conditions, at 23oC with constant velocity of the cross-bar equal to 2 mm/min. The experiments were carried out in sub-critical range with reg-istration of parameters needed in determination of critical loads, as well as in post-critical range. For each of the considered ply sequences three samples were tested and the measurements were performed thrice. Thus, nine measurements were performed for each layup in order to determine the sub- and post-critical characteristics of columns.
EXPERIMENTAL METHODS FOR
BUCKLING LOADS DETERMINATION
On the basis of the obtained experimental re-sults, the values of critical load were determined, in accordance with the following methods: a) the vertical-tangent line method (the
mean-strains method) – denoted as K1 [11,12,13],
b) the method of straight lines intersection in the plot of mean strains – denoted as K2 [11,12,13], c) the P-w2 method – denoted as K3 [11,12,13], d) the inflexion-point method – denoted as
K4 [12],
e) the Tereszowski method – denoted as K5 [14], f) he Koiter method – denoted as K6 [5,15].
The methods for the critical load determina-tion employed in the conducted research demand approximative calculations based on the results of experimental measurements. The computa-tions performed in such a way aimed at matching the functions describing the analyzed phenomena with the experimental outcomes. Note that an ap -propriate choice of measurement points from all the accessible data was crucial and decisive for the final results of calculations. It was connected to an idea of the so-called pivotal points elabo-rated by Bronshtein and Semendyayev [16] and implemented by Spencer and Walker [17] in an analysis of experimental results for plates. This idea states that an appropriate choice of the piv-otal points leads to sufficiently optimal matching of the analyzed function to experimental data.
The exemplary results of deflec -tion w and strains ε measurements for the [90/45/-45/0]s-sequence column are presented in Figs 4-6. The elaborated relations between the displacements or the strains and the external load enabled the determination of the critical load with the methods K1 - K3, whereas the values of the critical load determined with the methods K4 - K6 were obtained numerically.
Fig. 3. The test stand with a composite sample
Fig. 4. Dependence of compression load on defor-mations ε1,ε2 andεm=0.5(e1+e2) – the mean-strains
NUMERICAL CALCULATIONS
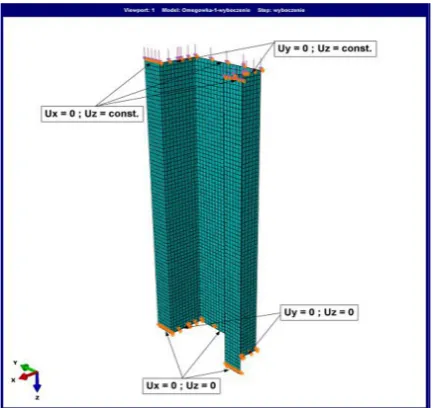
The finite element method and analytical-nu -merical method were employed to buckling anal-ysis and post buckling behaviour of thin-walled composite columns. Two different software pack -ages (ABAQUS® and ANSYS®) were used for numerical calculation. They were thin-walled plane-stress shell elements with 8 nodes (S8R – in ABAQUS® and SHELL 99 – in ANSYS®). Both used elements have six degree of freedom at each node. A Layup-Ply technique was employed for the purpose of the symmetrical laminate mod-elling. A numerical model of the top-hat section composite columns is presented in Fig.7.
The boundary conditions of the numerical model representing articulated support of the col-umn ends were defined by restraining the kine -matic degrees of freedom of the nodes belonging to the borders of the first and the last cross-section. The load was applied to the model as uniformly distributed concentrated forces at the top-end of the column (Fig.7).
The properties of composite material were described by definition of orthotropic material in plane stress state, which allowed to describe the laminate properties in particular directions, ac-cording to the arrangement of fibres. The numeri -cal -calculations within the framework of FE were performed in two stages. The linear stability prob-lem (critical state) was solved by finding critical load and buckling mode, as well. Verification of the obtained results was performed with the ANM method [18], based on the Koiter’s general as -ymptotic theory of conservative systems stability [5]. In Figures 8 and 9 the lowest buckling modes
of the analyzed columns obtained numerically were presented in comparison with experimental outcomes. The obtained buckling modes exhib-ited different numbers of the half-waves along the symmetry axis of the column, depending on the layup – the [90/45/-45/0]s-sequence column had 7 halfwaves, whereas the [45/-45/90/0]s one – 5 halfwaves. The critical load values determined with the methods K1 - K6 using the experimen-tal results were compared with the numerical, as well as the analytical-numerical results – see Figures 10 and 11.
The post-critical calculations were performed as non-linear static analysis of the structure with initiated imperfections having a dimension of 0.1 of the top-hat profile wall thickness, correspond -ing to the first instability mode of the column.
Fig. 5. Dependence of compression load on deforma-tions εm=0.5(e1+e2) – the method of straight lines
intersection in the plot of mean strains (K2)
Fig. 6. Dependence of compression load on square
dimensionless deflection w2=(w/w
max)2(K3)
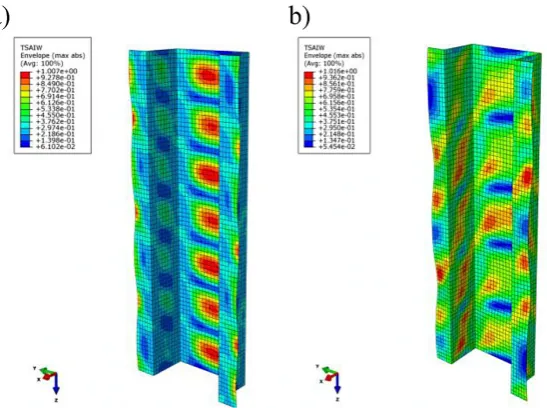
The post-critical analysis taking into account geo-metrically non-linear problem in ABAQUS was performed with incremental-iterative Newton-Raphson method, whereas the post-critical equi-librium path was tracked with the Arc-length pro -cedure (the Ricks Method) in the Ansys program. The range of the numerical calculations also cov-ered an attempt to estimate a probability of the composite damage occurence in post-critical state according to the Tsai-Wu criterion [19–22].
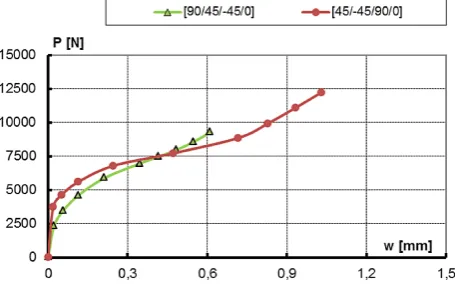
The postcritical force-deflection (P-w) equi-librium paths calculated numerically up to ca. 150 % of the critical load were compared with experimental results – Figures 12 and 13.
Post-critical range analysis enabled to assess the deformation and the stiffness of the struc -ture after the stability loss in relation to the ply sequence of the laminate. The experimental tests were performed within the range exceeding the critical forces values obtained numerically with the FEM by ca. 1.5-times. An attempt was made to assess the failure load value in accordance with the Tsai-Wu criterion [19,20]. In Fig. 14,
the post-critical deformation of the compressed columns corresponding to the failure load value was presented (the Tsai-Wu-criterion failure parameter equal to 1).
COMPARISON OF THE RESULTS
The analysis of the critical state outcomes for the compressed composite columns shows a complete qualitative agreement of the buckling modes obtained with each of the exploited meth-ods (FEM, ANM and the experiments). In each case, the same number of half-waves along the axis direction of the column was obtained, which characterized the structure buckling mode for the lowest value of the critical load. High conformity of the results was observed also for the value of the critical load determined numerically (with ABAQUS, ANSYS and ANM) with the experi -mental results obtained with the methods K1 - K6 (Figures 10 and 11). The quantitative analysis of the critical load values exhibited maximal
Fig. 8. Buckling mode of the [90/45/-45/0]s -
se-quence column Fig. 9. Buckling mode of the [45/-45/90/0]quence column s -
discrepancies of the obtained results for the ANM and K2 methods: 13.9 % for the column with the [90/45/-45/0]s ply sequence and 10.7 % for the [45/-45/90/0]s one. Rejection of the extreme values determined experimentaly allowed to de-crease the discrepancy below 10 %, which meant high compatibility of the results in the case of the structure stability research. The discrepancy of the numerical results did not exceed 5%.
The obtained results enabled to assess the influence of the sequence of plies on the value of the critical load. It was observed that mov-ing the ±45° plies outside the sequence (cf. the [45/-45/90/0]s-sequence column) lead to an in -crease of the critical load in comparison to the [90/45/-45/0]s sequence by ca. 25 %.
Post-critical equilibrium paths were also de-termined for the nodes experiencing maximal
Fig. 11. Critical load values for the [45/-45/90/0]s - sequence column
Fig.12. Comparison of post-buckling paths obtained numerically with experimental results
for the [90/45/-45/0]s–sequence column
Fig.13. Comparison of post-buckling paths obtained numerically with experimental
amplitudes of displacement in a slightly post-critical state. Figures 12 and 13 present the re-sults of experiments, as well as the FEM and the ANM method results in dimensional coordinate system (P-w). The presented characteristics ex -hibit high conformity of the obtained results for all the exploited research methods. The maxi-mal quantitative differences were obtained for the [90/45/-45/0]s-sequence column at a level of 18 % and in case of the [45/-45/90/0]s-sequence column – 14 % (ANM/ABAQUS).
The analysis of the post-cricital equilibrium path allows to assess the structure stiffness after the loss of stability in the context of applied ply sequence. In both cases within the postcritical range up to 150% of the critical load, similar stiff -ness of the tested structures was observed, which was reflected by close inclination angles of both characteristics. The comparison of the postcriti-cal equilibrium paths in function of the composite
ply sequence for the FEM and the ANM calcu -lations, as well as the experimental outcomes is presented in Figures 15 - 17.
CONCLUSIONS
The paper presents the studies on critical, as well as post-critical state of thin-walled com-posite columns subjected to axial compression. The performed analysis proved qualitative and quantitative agreement of the research results conducted with different methods. The analysis of the curves showed in Fig. 12 and 13 reveals a good agreement of computational results with those of experiments, both in subcritical and post-critical range. This confirms the adequacy of the worked out numerical models. The postcritical equilibrium paths determined with the analytical-numerical method (ANM) exhibit slightly lesser
Fig. 15. Comparison of postcritical equilibrium paths – FEM results
stiffness in comparison with the numerical (FEM) results. Moreover, one can spot that the experi -mental results shown in Figures 12 and 13 are located between the postritical equilibrium paths determined with the ANM and the FEM methods. It allows to verify advantageously calculation re-sults in relation to the characteristics of the real structures.
The comparison of the results within a con-text of the applied ply sequence exhibits a consid-erable increase of the critical load’s value through location of the ±45° plies outside, having kept the geometrical and material parameters of the struc-ture. Thus, the obtained results delivered a lot of important information, useful in the process of forming and optimization of the composite tex-ture in the context of its maintenance loading con-ditions [23].
Acknowledgements:
The research has been conducted under the project No. UMO-2015/19/B/ST8/02800 fi -nanced by the National Science Centre Poland.
REFERENCES
1. Campbell F.C., Manufacturing Technology for Aerospace Structural Materials. Elsevier, 2006.
2. Miracle, D.P., Donaldson, S.L. (eds), ASM Hand
-book Vol. 21 Composites. ASM International,
2001.
3. Freeman, W.T., The Use of Composites in Aircraft Primary Structure. Composites Engineering, Vol. 3, Nos 7–8, pp. 767–775, 1993.
4. Swanson S.R., Introduction to Design and Analy
-sis with Advanced Composite Materials. Prentice-Hall, Inc.,1997.
5. H.Dębski, J.Jonak: Failure analysis of thin-walled
composite channel section columns, Composite
Structures 132 (2015) 567–574.
6. Wysmulski P., Debski H., Rozylo P., Falkow
-icz K. A study of stability and post-critical be
-haviour of thin-walled composite profiles under compression,Eksploatacja i Niezawodnosc- Main
-tenance and Reliability, 18(4): pp. 632–637, 2016. 7. Kopecki T., Mazurek P., Lis T., Chodorowska D.,
Post-buckling deformation states of semi-mono-coque cylindrical structures with large cut-outs un-der operating load conditions. numerical analysis
Fig. 16. Comparison of postcritical equilibrium paths – ANM results
and experimental tests, Eksploatacja i Nieza
-wodnosc-Maintenance and Reliability 18(1): pp. 16–24, 2016.
8. Rozylo P., Teter A., Debski H., Wysmulski P., Falkowicz K. Experimental and Numerical Study of the Buckling of Composite Profiles with Open Cross Section under Axial Compression, Applied Composite Materials 24: pp. 1251–1264, 2017.
9. Kopecki T., Mazurek P., Determination of stress
distribution patterns in post-critical deformation states of thin-walled skins subjected to operating
loads, Eksploatacja i Niezawodnosc-Maintenance and Reliability 16(1), pp. 608–615, 2014.
10. Koiter W.T., Elastic stability and post-buckling
behavior. In:Proceedings of the Symposium on
Non-linear Problems, Univ. of Wisconsin Press, Wisconsin, pp. 257–275, 1963.
11. Singer J, Arbocz J, Weller T., Buckling experi
-ments. Experimental methods in buckling of thin-walled structure. New York: John Wiley & Sons Inc.; Basic concepts, columns, beams, and plates,
vol. 1; 1998. Shells built-up structures, composites and additional topics, vol. 2, 2002.
12. Coan JM., Large-deflection theory for plates with
small initial curvature loaded in edge compression.
SME, J Appl Mech,18, pp. 143–51, 1951.
13. Venkataramaiah KR, Roorda J., Analysis of local
plate buckling experimental data. In: Sixth inter-national specialty conference on cold-formed steel
structures; 1982 November 16–17; St. Louis, Mis
-souri, Missouri S&T [formerly the University of Missouri – Rolla, pp. 45–74], 1982.
14. Tereszkowski Z., An experimental method for de
-termining critical loads of plates. Arch Mech Eng, 3, pp. 485–93, 1970.
15. van der Heijden AMA, editor, W.T. Koiter’s elastic stability of solids and structures. Cambridge Uni -versity Press, 2009.
16. Bronshtein J.N, Semendyayev K.A., Guide Book to Mathematics. Zürich, Part6: Interpretation of Experimental Results. 1973.
17. Spencer H.H., Walker A.C., Technique for Measur -ing The Critical Loads of Columns and
Plates.Pa-per No.2290A SESA Spring Meet-ing,1974.
18. Kolakowski Z., Kowal-Michalska K. (eds.), Se -lected problems of instabilities in composite
struc-tures. A Series of Monographs, Technical Univer -sity of Lodz, 1999.
19. Tsai SW, Wu EM., A general theory of strength for anisotropic materials. J. Compos. Mater. pp. 58–80,1971.
20. Thompson J.M.T., Hunt G.W., General theory of elastic stability. Wiley, New York, 1973.
21. Dębski H., Kubiak T., Teter A., Buckling and
postbuckling behavior of thin-walled compos-ite channel section beam. Composcompos-ite Structures,
100,195–204, 2013.
22. Dębski H., Experimental investigation post-buck -ling behaviour of composite column with top-hat
cross section. Eksploatacja i Niezawodność – Maintenance and Reliability, Warszawa No2/2013,
105–109, 2013.
23. Bieniaś J., Dębski H., Surowska B., Sadowski T., Analysis of microstructure damage in carbon/ep
-oxy composites using FEM. Computational Mate
![Fig. 2. Layup arrangement used in the research: a) [90/45/-45/0]s, b) [45/-45/90/0]s](https://thumb-us.123doks.com/thumbv2/123dok_us/8805986.1774580/2.595.163.435.329.494/fig-layup-arrangement-used-research-s-b-s.webp)
![Fig. 10. Critical load values for the [90/45/-45/0]s-sequence column](https://thumb-us.123doks.com/thumbv2/123dok_us/8805986.1774580/5.595.73.290.65.246/fig-critical-load-values-s-sequence-column.webp)
![Fig.12. Comparison of post-buckling paths obtained numerically with experimental results for the [90/45/-45/0]s–sequence column](https://thumb-us.123doks.com/thumbv2/123dok_us/8805986.1774580/6.595.185.413.256.400/comparison-buckling-obtained-numerically-experimental-results-sequence-column.webp)