INTRODUCTION
Reduction of friction and wear through im-proved lubrication is a pressing concern in the de-sign of tooling and any technologies that improve the lubrication condition are therefore of great in-terest [1]. Reduction in friction and wear loss has been interests for tribologists and lubrication en-gineers for years. Recently, surface texturing on the micro-scale level has been introduced to im-prove lubrication and lower friction of tribologi-cal pairs [2]. Properties such as efficiency, reli -ability and dur-ability of such components depend on the friction that occurs at the contact interface. In addition, there is always the need to increase the load capacity of machine elements, which of course will lead to higher severity of surface
in-teraction. Both the need to reduce friction and the desire to increase load capacity require effective lubrication strategy for sliding surfaces [3].
Laser surface texturing technology (LST) is an emerging effective method for improving tri -bological performance of friction pairs working in dry contact regime or lubricated with oil. In LST technology, a pulsed laser beam is used to create thousands of arranged micro-depressions on a surface by a material ablation process [3, 4]. Different texturing elements, e.g. dimples [5, 6, 7], crossed and parallel microchannels [8, 9], triangles [10], squares [11], as well as other more complex shapes [12, 13], have been stud-ied worldwide for tailor tribological performance, however, the most common texturing features are still circular dimple-like depressions, because of
THE INFLUENCE OF THE TOOL SURFACE TEXTURE ON FRICTION AND
THE SURFACE LAYERS PROPERTIES OF FORMED COMPONENT
Jana Šugárová1, Peter Šugár1, Martin Frnčík1, Martin Necpal1, Jana Moravčíková1,Martin Kusý2
1 Slovak University of Technology, Faculty of Materials Science and Technology, Institute of Production Technologies, J. Bottu 25, 917 24 Trnava, Slovakia, e-mail: [email protected], [email protected], [email protected], [email protected]
2 Slovak University of Technology, Faculty of Materials Science and Technology, Institute of Materials Science, J. Bottu 25, 917 24 Trnava, Slovakia, e-mail: [email protected]
Research Journal
Volume 12, Issue 1, March 2018, pages 181–193
DOI: 10.12913/22998624/85704 Research Article
ABSTRACT
The morphological texturing of forming tool surfaces has a high potential to reduce friction and tool wear and also has an impact on the surface layers properties of formed material. In order to
understand the effect of different types of tool textures, produced by nanosecond fibre laser, on
the tribological conditions at the interface tool-formed material and on the integrity of formed part surface layers, the series of experimental investigations have been carried out. The
coef-ficient of friction for different texture parameters (individual feature shape, including the depth profile of the cavities and orientation of the features relative to the material flow) was evaluated
via a Ring Test and the surface layers integrity of the formed material (surface roughness and subsurface micro hardness) was also experimentally analysed. The results showed a positive
effect of surface texturing on the friction coefficients and the strain hardening of test samples
material. Application of surface texture consisting of dimple-like depressions arranged in radial
layout contributed to the most significant friction reduction of about 40%. On the other hand,
this surface texture contributed to the increase of surface roughness parameters, Ra parameter
increased from 0.49 μm to 2.19 μm and the Rz parameter increased from 0.99 μm to 16.79 μm. Keywords: laser surface texture, dimple shape, dimple arrangement, friction coefficient,
surface integrity. Received: 2017.11.22
their easy fabrication [5, 14]. As far as dry con-tacts are concerned, fewer publications compared to lubricated contacts deal with benefits of sur -face texturing. Most of the published works are related to the entrapment of wear debris or reduc-ing the contact area, for example [15]. The major influencing surface texture parameters are the ge -ometry of surface textures (shape), the area den-sity, the aspect ratio and the relative orientation of the surface textures compared to sliding direction [16]. For example, a significant improvement of friction behaviour using a surface texture consist-ing of dimple-like depressions with density of 6 % was observed in lubrication-free regime. In this case, surface texture contributed to friction reduc-tion to about of 47% [17].
Many researchers have focused on the opti-mizing of the dimensional parameters mainly of the dimple-like depressions. A lot of experimental researches were carried out in order to define the optimal texture density, the aspect ratio (a.k.a. ra-tio of the dimple depth to dimple diameter), and the dimple arrangement on the processed surfaces [4]. In terms of texturing parameters and their influence on tribological properties, there is an agreement in the literature that an optimum aspect ratio can be found around 0.1 [18, 19, 20] to about 0.18 [21] in a hydrodynamic lubrication regime. This ratio is also affected by the applied liquid lubricant. The viscosity of the lubricant and some of its other rheological properties determine the thickness of the lubricant fluid film [22]. There are publications finding the optimum at much smaller values around 0.01, especially for very low viscosity mediums like water [23]. For much higher viscosity gear oils, the optimum dimple aspect ratio was reported to be around 1.0 [24].
For the tribological contact pairs of metals lu-bricated by oil, several studies under controlled laboratory conditions have been performed in or-der to analyze the effect of dimple area density on the friction coefficient. Several experimental researches show that the area density of dimples in the range of 5÷13% is preferable for friction reduction. Contact surface is reduced by the tex-ture depressions to a sufficient extent in order to reduce the friction coefficient. The textured area density of above 20% usually causes increas -ing the friction coefficient and wear rate value [22, 25, 26, 27].
A third parameter that beckons investigation is how the individual depressions are arranged on the surface (depression orientation). Closely
associated is the issue whether the texturing ele-ments act alone or if they are affecting each other, working as a collective. The hypothesis exists that in case the dimples are not influencing each other, the friction force is expected to decrease linearly with increasing textured area [22, 28, 29]. Gachot et al. [30, 31] studied these influences for stainless steel surfaces which were treated by direct laser interference patterning. The authors concluded that the relative texture orientation has significant importance due to differences in con -tact area. But on the other hand, Saeidi [32] did not exhibit the significant effect of this parameter on the friction reduction.
Although various designs and optimisation of LST patterns have been investigated, the process design methods are still dominated by ‘trial and error’ approaches, and yet there are large varia-tions in ‘optimum’ designs obtained by different research groups [33].
According to the review of current state of the art it was found that many experimental works deal with the optimizing of dimple-like depres -sions dimen-sions, in particular via a specific tr -ibo-test in order to achieve the minimal friction coefficient and wear rate. However, there is a limited effort to the study the influence of such modified surfaces in real manufacturing process -es, for instance in bulk material forming process, where the interaction between the forming tool and formed component is the most critical and important part of the process. Since the finished component can be considered as the result of this interaction. The influence of bulk compression process using the textured platens on the contact friction coefficient value on the forming tool – formed component interface is primary studied in this article. The component surface roughness parameters and strain hardening are also experi-mentally analysed in order to gain a more com-plex and deeper view into the issue of laser-beam textured tools in a specific forming process.
EXPERIMENTAL SETUP
conditions at the interface tool – formed material and on the integrity of formed part surface layers, the series of experimental investigations has been carried out. The main objective of this research article is to define the influence of the forming tools (planar platens in the gradual compression process of the test samples, as known as a Ring-test) on the chosen characteristics of the formed components. Contact pair in Ring-test consists of a pair of compression platens (upper-active and lower-static one) and the test sample, which is axially compressed among them. Frontal areas of each compression platen were covered by a texture with defined shape and dimensions by the laser surface texturing technology. 12 pairs of compression platens were used in the experiment; their frontal areas were modified by regularly ar -ranged micro-depressions with a defined shape as follows:
1. Dimple – like depression:diameter of 100 μm, depth of about 20 μm.
2. Ellipsoid: length of 300 μm, width of 100 μm, depth of about 20 μm.
3. Circular groove: outer diameter of 240 μm, in -ner diameter of 140 μm, depth of about 20 μm. 4. “S” groove: the dimensions of this
depres-sion shape cannot be described in detail way, since this feature is a part of patent application process.
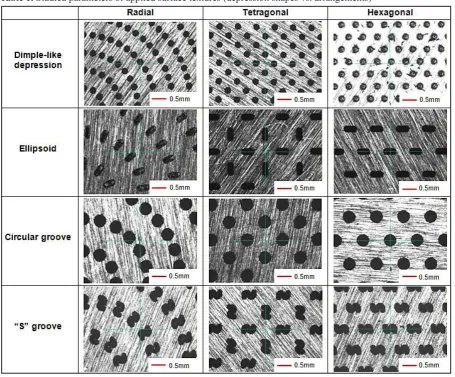
The first studied parameter of surface textures is the depression shape. The shapes of studied micro-dimples are depicted in Figure 1. Another studied parameter is the depressions arrangement, on the planar surface of the compression platens, relative to the material flow during the deforma -tion process. The individual arrangements are de-picted in Table 1 (enlargement of 50x) and can be described as follows:
1. Radial: the depressions are located on concen-tric circles; diameter of the circles increases gradually by a defined value, and with each subsequent circle the number of depressions located on that circle also increases.
2. Tetragonal: the depressions are located in the centre of the square sides with a defined side length.
3. Hexagonal: the depressions are located at the vertices of a regular hexagon with a defined side length; one depression is located at the centre of this formation.
4. The dimensions of the individual depression and their individual distance in the arrange-ment were calculated according to the surface texture density. This value is constant for each texture in this experimental research and is equal to 6%, since the lower values are recom -mended for reduction of friction coefficient [17, 25, 26].
To manufacture the surface textures on the planar surfaces of compression platens a 5-axis high precision laser micro-machining centre LaserTEC 80 Shape was used. This machine is equipped with a pulsed (pulse duration of 120 ns) fibre ytterbium-based laser with a wavelength of 1064 nm. The following constant laser beam pa-rameters were used for the production of surface textures: output power of 16.40 W, beam scanning speed of 1300 mm.s-1 and pulse repetition rate of
75 kHz. These parameters were optimized in or -der to achieve a depth of cut of 1 μm per a layer .
A morphological analysis of chosen depres-sion shape of each studied surface texture was performed in order to determine and verify the real shape and dimensions of depressions pro-duced by laser beam micromachining. For this purpose, a laser confocal microscope Zeiss LSM 700 (resolution of 10 nm) was used. Figure 1 shows the real shape and dimensions of studied depressions. It can be concluded, that all studied depressions fulfil the shape and the dimensional
requirements, since the real dimensional varia-tions can be negligible.
It can also be seen that around the edge of each studied depression a rim of solidified ma -terial was originated. This rim is a characteris-tic feature of the depressions manufactured by pulsed laser beam in a material ablation process [36, 37]. This feature can have the negative effect in the friction-reducing applications. However, its effect can be minimalized by optimizing the laser beam parameters with a subsequent polishing of textured surfaces.
Compression platens were produced of 90MnCrV8 tool steel according to EN ISO 4957 standard, since this type of steel material is wide-ly applied in production of tools for blank and bulk metal forming operations. Tab. 2 specifies the chemical composition of used tool steel; it is a low carbon steel suitable for construction and welding purposes.
Compression platens were produced by a turning technology, while the next operation was
a quenching of the tools in the oil medium and their tempering to get the desired hardness of 60±1 HRC. Subsequently, the tools planar areas were grinded to obtain a surface roughness (Ra) of 0.8 μm; then were textured by laser beam.
It was demonstrated by the experimental re-search [3] that these solidified rims around the depressions edges have a negative effect on the tribological behaviour of contacting surfaces. Therefore it was necessary to remove these rims from all textured surfaces. So all the compression platens were polished with the polycrystalline di-amond suspension (grain size of 1 μm, polishing time of 180 s) using a Buehler AutoMet 300 pol-ishing machine. The platens were subsequently cleaned in an ultrasonic bath which consists of an acetone medium heated up to 40 °C in order to all polishing suspension or steel debris were re-moved from the depressions (bath time of 120 s).
A ring compression test in a lubrication-free regime (dry contact) was performed in order to determine the friction coefficient of the contact pairs [17, 38]. During this test, a ring-shaped test sample, which is produced of S235JRG1 steel ac-cording to EN 10027–1 standard, is axially com -pressed among the pair of compression platens. This experimental testing was carried out using a universal testing machine Tinius Olsen 300ST, which is designed for tension, compression, flex -ure and shear strength testing of materials and assemblies. Chosen steels represent and simulate the standard materials of forming tool and the formed material which come into contact in most blank metal forming operations as well as bulk metal forming operations.
This Ring-test method is characteristic by the constant friction coefficient value at the whole tool – sample surface; what is more, the deforma -tion of the test sample is homogeneous. During the compression of the test sample by the com-pression platens, the hole diameter can be less-ened, remain without a change in diameter or can be even enlarged (according to the value of the friction coefficient). In this experimental research, the D:d:h ratio (ratio of the outer sample diameter D to the hole diameter d to the sample height h) is equal to 6:3:2. That means, that the dimensions of
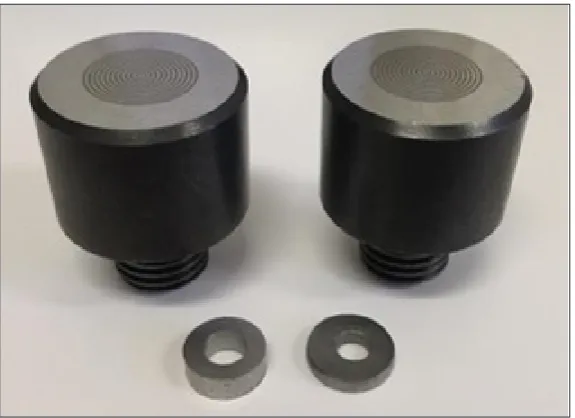
test samples are 12mm:6mm:4mm according to this ratio. Planar frontal surfaces of test samples were non-textured; what is more, these surfaces were grinded to obtain a required surface rough-ness (Ra) of 0.4 μm. It is recommended to pre -serve approximately an equal compression of test sample Δh during the test; while the constant val -ue of 0.3 mm was selected. Compression of each test sample was performed four times. Figure 2 depicts a pair of textured compression platens to-gether with the non-deformed (left) and deformed (right) test samples.
The friction coefficient values can be simply obtained for each sample compression, based on the relationship between the derived values of the inside diameter change and the percent axi-al reduction of the cylinder Δh, which were de -picted for the first time as an empirical system of calibration curves by Male and Cockcroft for a range of friction coefficient of 0.055 to 0.57 and the deformation up to 60 percent [39]. Coeffi -cient of friction evaluation was performed at the room temperature of 22 °C. Both, non-textured and textured compression platens were tested and studied in these conditions for comparison. Three test samples were gradually compressed in each combination of surface texture shape and arrangement, subsequently the average value of friction coefficient was calculated for each stud -ied input parameters.
The experimental research was also focused on the analysis of the surface layers integrity of test samples material formed during the ring com-pression test, including surface roughness (Ra and Rz according to STN EN ISO 4287 standard) and sub-surface micro hardness (HV0.05); since during the compression test the analysed test piece surface layers integrity are heavily affected by the given surface texture of the compression platens. The relief of the surface texture is copied to the surface of the test sample and so the micro-peaks on the test piece surface are subsequently generated. Fig. 3 depicts the difference between the surface conditions of the non-deformed and the deformed test piece. It can be clearly seen that the surface of the deformed test piece is covered by the micro-peaks, which were generated by the
Table 2. Chemical composition of applied low carbon and tool steels (in wt %)
C Mn P S Si Cr N V Mo
90MnCrV8 0.91 1.98 0.03 0.03 0.17 0.37 - 0.13
-micro-forming process during the compression. In this case, surface micro-peaks are generated according to the “S” groove depressions, which are hexagonally arranged.
Surface roughness measurement (a maximum height of the scale limited surface Rz and an ar -ithmetical mean height of the scale limited sur-face Ra) was carried out using a Zeiss Surfcom 5000 measuring system. The measuring principle is depicted in Figure 3. The tactile device path is located across the macimum number of the mi-cro-peaks through its middle, while the chosen evaluated length is 4 mm and the tactile device movement speed is 0.15 mm.s-1.
Micro-hardness measurement was carried out in order to determine the influence of surface tex -tures (various depression shapes and the arrange-ments) on the strain rate of the test samples after the compression process, using a BUEHLER In -dentamet 1105 device with SW Omnimet MHT. Test samples were vertically sawn up through the midpoints and prepared for the sub-surface mi-cro-hardness measurement by the specific set of procedures (compression mounting, grinding and polishing of the samples). The individual measur-ing points are depicted in Figure 4; the distance between the measuring points is equal to 0.5 mm from the top surface. The measured points are
Fig. 3. Surface conditions between the non-deformed (left) and deformed (right) test piece
Fig. 4. Micro-hardness measuring points
placed to the zone of increased plastic deforma -tion; therefore, there are maximum strains in this zone. The points are located to the outer and inner edge of the test sample with the distance of 0.5 mm from these edges.
In order to quantify the effects of the stud -ied factors and interactive influences among them on the friction coefficient values, the analysis of variance (ANOVA) using Minitab v.17 software was carried out. The number of 2 replicates was chosen for each base run, which means the total number of runs is 24 in this analysis. The Fisher’s ratio (F-ratio), which is the ratio between the vari-ance due to the effect of a factor and the varivari-ance due to an error term, was used to measure the sig-nificance of the factor at the desired sigsig-nificance level. If the F-value is greater than the tabulated
Fcritvalue, the process parameter is considered as significant.
RESULTS AND DISCUSSION
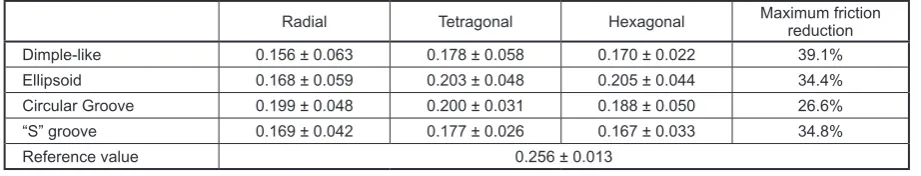
Friction coefficient values along with its stan -dard deviations for a different combination of studied input factors (depression shape and the depression arrangement) obtained via a Ring-compression test are summarized in Table 3. Ring-compression test for non-textured compres-sion platens was carried out too, this comprescompres-sion conditions are labelled as a Reference value, what corresponds to the friction pair consisting of two only grinded steel surfaces. The friction coeffi -cient value for this reference sample is equal to 0.256 ± 0.013. It is important to mention that all studied surface textures, more or less contributed to the friction coefficient value reduction com -pared to the reference value in lubrication-free regime. Table 3 also presents the maximum fric-tion coefficient reducfric-tion which was recorded for a specific surface texture with the lowest friction coefficient (bolded value) in comparison to the reference value.
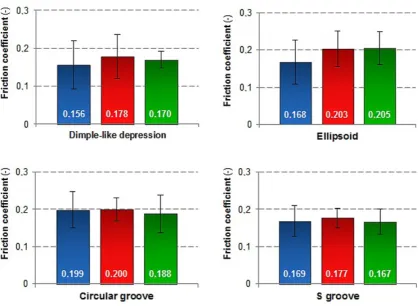
Figure 5 shows the friction coefficient evalu -ation for individual depression shape depending on the depression arrangement. The lowest fric-tion coefficient value was reached for the dimple-like depression which is radially arranged on the planar surface of the compression platen. In this case, the friction coefficient reaches the value of 0.156, which means that the maximum reduction in friction coefficient is 39.1%. Similar results were obtained for dimple-like depressions ar-ranged to tetragon and hexagon, where the fric-tion coefficient reducfric-tion was observed of 30.5% and 33.6% respectively.
In the case of “S” groove depression shape it can be concluded that the influence of the de -pression arrangement as the input factor on the friction coefficient value can be statistically neg -ligible, since the friction coefficient values vary in the very narrow interval from 0.167 (hexago-nal arrangement, friction reduction of 34.8%) to 0.177 (tetragonal arrangement, friction reduction of 30.9%). The results for this type of depres -sion shape are very similar to the dimple-like depression ones.
A similarity of studied results was observed for ellipsoid and circular groove depression shape. Friction coefficient values in these cases vary in a similar range, as can be seen in Figure 5. Almost equal values of friction coefficients are obtained in the case of ellipsoid depression shape arranged to tetragon (friction coefficient of 0.203) and then arranged to hexagon (friction coefficient of 0.205) and for circular groove depression shape arranged to radial layout (friction coefficient of 0.199) and then to tetragon (friction coefficient of 0.20). The average friction coefficient reduction is about 21%.
For the future experimental researches, it is recommended to verify these results by appli-cation of another type of tribo-test, for instance Pin-on-Disc configuration, in order to quantify the reliability and the accuracy of Ring-compres-sion test and to compare the results of the friction
Table 3. Friction coefficient values for different depressions shapes and arrangements
Radial Tetragonal Hexagonal Maximum friction reduction
Dimple-like 0.156 ± 0.063 0.178 ± 0.058 0.170 ± 0.022 39.1%
Ellipsoid 0.168 ± 0.059 0.203 ± 0.048 0.205 ± 0.044 34.4%
Circular Groove 0.199 ± 0.048 0.200 ± 0.031 0.188 ± 0.050 26.6%
“S” groove 0.169 ± 0.042 0.177 ± 0.026 0.167 ± 0.033 34.8%
coefficient values with the experimental results achieved worldwide.
The results of the ANOVA analysis and F-value for friction coefficient as studied response are shown in Table 4. The results revealed that both of the input studied parameters (depression shape and the depression arrangement) can be considered as significant. The influence of these parameters on the studied response is statistically important, which is also confirmed by the calcu -lated p-value in Table 4. If the calcu-lated p-value is lower than the confidence level (α = 0.05), than the factor can be considered as statistically sig-nificant, while the shape input parameter shows
a higher degree of significance than the arrange -ment parameter.
Another studied response was the test pieces surface roughness measured on both planar frontal areas after its plastic deformation by the compres-sion platens, while one test piece was measured for one combination of surface texture parameters. Surface profile parameters Ra and Rz were cho -sen as the studied responses, the results for each specific combination of input parameters are sum -marised in Table 5. These values are subsequently compared to the reference value (RV, Ra of 0.41 μm and Rz of 0.99 μm), which corresponds to the non-textured pair of compression platens.
Fig. 5. Friction coefficient values depending on the depression shape vs. depression arrangement – radial, – te-tragonal, – hexagonal
Table 4. Analysis of Variance – Coefficient of friction
Source DF SquaresSum of Mean Square F-Value p-Value
Model 11 0.00611 0.00056 6.16 0.002
Shape 3 0.00377 0.00126 13.95 * 0.001
Arrangement 2 0.00094 0.00047 5.20 * 0.024
Shape*Arrangement 6 0.00140 0.00023 2.58 0.076
Error 12 0.00108 0.00009
Total 23 0.00719
Tabulated Fcrit at 95 % confidence level: Fcrit (0.05; 3; 12) = 3.49; Fcrit (0.05; 2; 12) = 3.88;
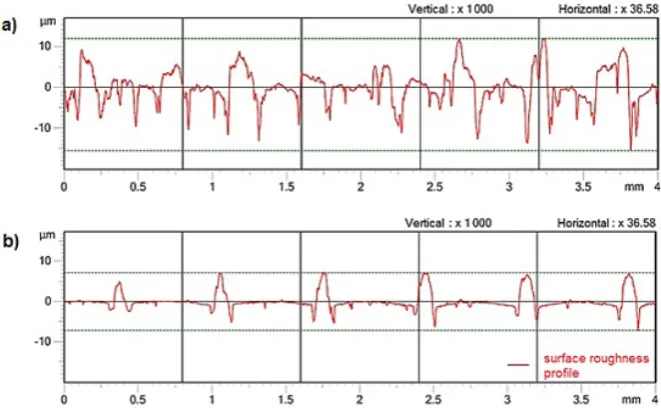
Maximum and minimum values of Ra and Rz for a specific combination of input parame -ters are also marked, as bolded in Table 5. As it can be seen, the maximum values were obtained for surface texture consisting of “S” grooves ar-ranged radially (Ra of 3.11 μm and Rz of 22.07 μm). Surface roughness profile for these condi -tions is depicted in Figure 6a. On the other hand, the minimum values for Ra and Rz were obtained using surface texture parameters: dimple-like de-pressions arranged in hexagonal layout (Ra of 1.26 and Rz of 12.53). Roughness profile for this surface is presented in Figure 6b.
It can be concluded that the process of plastic deformation by application of textured compres-sion platens contributes to the considerable
(mul-tiple) increase of the studied surface roughness parameters compared to the reference sample, while no matter the depression shape or its ar-rangement. The reason of this fact is that during the compression test the surface texture depres-sions of the platens are filled up by the test sample material. The micro-peaks, with the identical di-mensions and arrangement as the applied surface texture, are formed on the planar surfaces of the test piece, as it can be seen in Figure 3.
The last objective was to define the effect of the compression platens surface texture on the strain hardening of the test sample material via the measuring of the sub-surface micro-hardness in the individual points according to the above de-fined procedure.
Table 5. Surface roughness values for different depressions shapes vs. arrangements
Depression shape Arrangement Ra (μm) Rz (μm)
Ellipsoid
Radial 2.20 18.63
Hexagonal 1.83 12.55
Tetragonal 1.97 16.31
Dimple-like
Radial 2.19 16.79
Hexagonal 1.26 12.53
Tetragonal 2.02 15.33
Circular groove
Radial 2.25 16.95
Hexagonal 2.01 16.76
Tetragonal 2.52 21.25
“S” groove
Radial 3.11 22.07
Hexagonal 2.29 14.61
Tetragonal 1.71 17.45
Reference value - 0.41 0.99
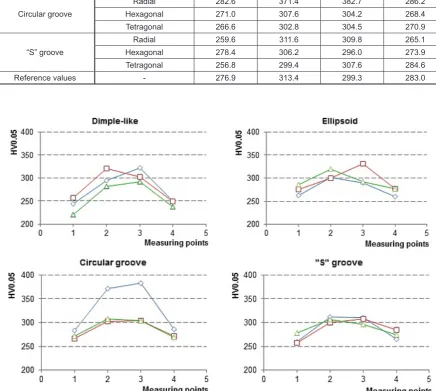
The obtained micro-hardness values for the individual measuring points are summarized in Table 6. These values are subsequently compared to the Reference values which were obtained by application of the non-textured pair of compres-sion platens. A graphical representation of the micro-hardness evaluation for each analysed pa-rameter is shown in Figure 7.
As it can be seen in Tab. 6, the compression process caused unequal strains in the bulk
mate-rial of the test samples, which resulting from the size of external contact friction in particular. Fric -tion on the contact surfaces also causes the un-even distribution of the forming pressure, which results in formation of the barrelled shape of the test samples. It is apparent from Figure 7 that the strain hardening value of the test samples mate-rial gradually increases from the outer edge of the sample to its inner edge. This is true in all studied combination of the parameters.
Fig. 7. Micro-hardness evaluation based on different surface texture parameters – radial, – tetragonal, – hexagonal
Table 6. Sub-surface micro-hardness values for different depressions shapes vs. arrangements
Depression shape Arrangement (HV0.05)1 (HV0.05)2 (HV0.05)3 (HV0.05)4
Ellipsoid
Radial 262.3 301.0 289.9 259.2
Hexagonal 286.2 319.8 292.6 276.6
Tetragonal 275.4 299.4 331.4 276.9
Dimple-like
Radial 244.6 294.6 322.7 250.2
Hexagonal 220.6 281.5 292.6 237.6
Tetragonal 256.8 320.8 302.8 248.9
Circular groove
Radial 282.6 371.4 382.7 286.2
Hexagonal 271.0 307.6 304.2 268.4
Tetragonal 266.6 302.8 304.5 270.9
“S” groove
Radial 259.6 311.6 309.8 265.1
Hexagonal 278.4 306.2 296.0 273.9
Tetragonal 256.8 299.4 307.6 284.6
In this case, it is not possible to make a clear conclusion about the influence of the surface texture on the size of the strain hardening of the analysed test samples. As the experiment shows, the values of the material strain hardening for the applied surface textures vary around the refer-ence values. The biggest increase in the studied response was observed for the circular groove de-pressions which are radially arranged; the values of strain hardening increased by 13% on average. Additionally, the biggest decrease of the stud-ied response was observed for the dimple-like depressions arranged hexagonally, the values of strain hardening decreased by 11.6% on average.
It can be assumed in general that the surface textures which contribute to a more significant reduction of friction coefficient (is valid for dim -ple-like and „S“ groove depressions, no matter the depression arrangement) also exhibit the low-er values of strain hardening of the test sample material compared to the reference value. On the other hand, surface textures consisting of the el-lipsoid or the circular groove depressions show the increasing of the strain hardening values com-pared to the reference values.
CONCLUSION
The presented experimental research was fo-cused on the influence analysis of the tool surface texture parameters (depression shapes and their arrangement) on the friction coefficient value pri -mary and on the component surface layers prop-erties secondary. Various types of surface textures were prepared on the planar surfaces of the com-pression platens by application of laser micro-ma-chining technology. The studied responses were primary the tribological behaviour (size of the friction coefficient) of the contact pair consisting of the textured forming tool and the formed test sample and also the integrity of formed sample surface layers (surface roughness parameters Ra, Rz and sub-surface micro-hardness) secondary. The following conclusions can be drawn based on the experimental results:
• tool surface texture contributes to the signifi -cant reduction of the contact friction coeffi -cient measured on the tool-formed material in-terface in a lubrication-free regime. From the maximum reduction of friction point of view, the ideal tool surface texture is constituted by dimple-like depressions arranged in radial
lay-out. Maximum friction coefficient reduction was observed of about 40% in this case.
• Minimal friction coefficient reduction of around 20% was observed using the textured compression platens.
• ANOVA results shown that both of the studied texture parameters (the depressions shape and their arrangement on the planar surface of the compression platens) have a significant effect on the size of the friction coefficient, these pa -rameters are statistically significant.
• However, the tool surface texture influences the surface roughness parameters Ra and Rz of the test sample material during the com-pression process, and in particular, the Rz pa -rameter is significantly affected. Test sample material fills up volume of the surface texture depressions and therefore, a surface texture with a negative shape in the form of protru-sions is formed on the test sample surface.
• With the reduction of friction coefficient, a de -crease in the size of the test sample material strain hardening is also observed in certain and specific cases. However, this phenomenon cannot be clearly confirmed, since on the other hand, specific combinations of surface texture parameters lead to increasing of the strain hardening compared to the reference value.
Acknowledgement
This research was supported by an interna-tional research project under the MANUNET 2014 call, entitled: Innovative methods of sheet metal forming tools surfaces improvement – R&D (2014/11283); and VEGA project: Laser surface texturing technology research for an optimizing of tribology conditions in the sheet metal form-ing processes (1/0669/15) and the authors would also like to thank for financial contribution from the STU Grand Scheme for Support of Young Re-searchers (SURFTOOL 1386 project).
REFERENCES
1. Jones K. and Schmid S.R. Experimental Investiga-tion of Laser Texturing and Its Effect on FricInvestiga-tion and Lubrication. Procedia Manufacturing, 5(2016), 568–577.
3. Kovalchenko A., Ajayi O., Erdemir A. et al. The ef-fect of laser surface texturing on transitions in lubri-cation regimes during unidirectional sliding contact. Tribology International, 38(2005), 219 – 225. 4. Greiner Ch., Merz T., Braun D. et al. Optimum
dimple diameter for friction reduction with laser surface texturing: the effect of velocity gradient. Surface Topography: Metrology and Properties, 3(2015), 044001.
5. Etsion I. State of the art in laser surface texturing. Journal of Tribology, 127(2005), 248 – 253. 6. Borghi A., Gualtieri E., Marchetto D. et al.
Tri-bological effects of surface texturing on nitriding steel for high-performance engine applications. Wear, 265(2008), 1046 – 1051.
7. Kummel J., Braun D., Gibmeier J. et al. Study on micro texturing of uncoated cemented carbide cut-ting tools for wear improvement and built-up edge stabilisation. Journal of Materials Processing Tech-nology, 215(2015), 62 – 70.
8. 8ZumGahr K.H., Wahl R. and Wauthier K. Ex-perimental study of the effect of microtexturing on oil lubricated ceramic/ steel friction pairs. Wear, 267(2009), 1241 – 1251.
9. Kawasegi N., Sugimori H., Morimoto H. et al. Development of cutting tools with microscale and nanoscale textures to improve frictional behaviour. Precision Engineering, 33(2009), 248 – 254. 10. Geiger M., Roth S. and Becker W. Influence of
laser-produced microstructures on the tribological behavior of ceramics. Surface and Coatings Tech-nology, 100–101(1998), 17 – 22.
11. Kim D.E., Cha K.H., Sung I.H. et al. Design of sur-face structures for friction control in micro-systems applications. CIRP Annals – Manufactur-ing Technology, 51(2002), 495 – 498.
12. Costa H.L. and Hutchings I.M. Hydrodynamic lu-brication of textured steel surfaces under recipro-cating sliding conditions. Tribology International, 40(2007), 1227 – 1238.
13. Suh M.-S., Chae Y.-H., Kim S.-S. et al. Effect of geometrical parameters in micro-grooved cross-hatch pattern under lubricated sliding friction. Tri-bology International, 43(2010), 1508 – 1517. 14. Wang L. Use of structured surfaces for friction and
wear control on bearing surfaces. Surface Topogra-phy: Metrology and Properties, 2(2014), 043001. 15. Rapoport L., Moshkovich A., Perfilyev V. et al.
Friction and wear of MoS2 films on laser textured steel surfaces. Surface and Coatings Technology, 202(2008), 3332 – 3340.
16. Gachot C., Rosenkranz A., Hsu S.M. et al. A criti-cal assessment of surface texturing for friction and wear improvement. Wear, 372–373(2017), 21 – 41. 17. Šugárová J., Frnčík M., Necpal M. et al. Evaluation
of tribological properties of laser textured hard-ened tool steels. Zeszyty naukowe Politechniki Rz-eszowskiej: Mechanika, 88(2016), 233 – 245. 18. Kligerman Y., Etsion I. and Shinkarenko A.
Im-proving tribological performance of piston rings by partial surface texturing. Journal of Tribology, 127(2005), 632 – 638.
19. Yan D., Qu N., Li H. et al. Significance of dimple parameters on the friction of sliding surfaces in-vestigated by orthogonal experiments. Tribology Transactions, 53(2010), 703 – 712.
20. Shinkarenko A., Kligerman Y. and Etsion I. The validity of linear elasticity in analyzing surface texturing effect for elastohydrodynamic lubrica-tion. Journal of Tribology, 131(2009), 021503. 21. Ronen A., Etsion I. and Kligerman Y.
Friction-reducing surface-texturing in reciprocating au-tomotive components. Tribology Transactions, 44(2001), 359 – 366.
22. Schneider J., Braun D. and Greiner Ch. Laser Tex-tured Surfaces for Mixed Lubrication: Influence of Aspect Ratio, Textured Area and Dimple Arrange-ment. Lubricants, 5(2017), 5030032.
23. Ripoll M.R., Simič R., Brenner J. et al. Friction and lifetime of laser surface-textured and MoS2-coated Ti6Al4V under dry reciprocating sliding. Tribology Letters, 51(2013), 261 – 271.
24. Lu X. and Khonsari M.M. An experimental in-vestigation of dimple effect on the Stribeck curve of journal bearings. Tribology Letters, 27(2007), 169 – 176.
25. Tang W., Zhou Y., Zhu H. et al. The effect of sur-face texturing on reducing the friction and wear of steel under lubricated sliding contact. Applied sur-face science, 273(2013), 199 – 204.
26. Wang X., Wang J., Zhang B. et. al. 2015 Design principles for the area density of dimple patterns. Journal of Engineering Tribology, 229(2015), 538 – 546.
27. Ibatan T., Uddin M.S. and Chowdhury M.A.K. Recent development on surface texturing in en-hancing tribological performance of bearing slid-ers. Surface & Coatings Technology, 272(2015), 102 – 120.
28. Peng X.D., Sheng S.E., Li J.Y. et al. Effects of dim-ple geometric parameters on the performance of a laser-textured mechanical seal. Key Engineering Materials, 373–374(2008), 766 – 769.
29. Brizmer V., Kligerman Y. and Etsion I. A laser surface textured parallel thrust bearing. Tribology Transactions, 46(2003), 397 – 403.
31. Prodanov N., Gachot C., Rosenkranz A. et al. Con-tact mechanics of laser-textured surfaces. Tribol-ogy Letters, 50(2013), 41 – 48.
32. Saeidi F., Meylan B., Hoffmann P. et al.: Effect of surface texturing on cast iron reciprocating against steel under starved lubrication conditions: A para-metric study. Wear, 348–349(2016), 17 – 26. 33. Bhaduri D., Batal A., Dimov S.S. et al. On design
and tribological behaviour of laser textured surfac-es, Procedia CIRP, 60(2017), 20 – 25.
34. Gualtieri E., Borghi A., Calabri L. et al. Increasing nanohardness and reducing friction of nitride steel by laser surface texturing. Tribology International, 42(2009), 699 – 705.
35. Vilhena L.M., Sedlaček M., Podgornik B. et al.
Surface texturing by pulsed Nd:YAG laser. Tribol-ogy International, 42(2009), 1496 – 1504.
36. Šugár P., Šugárová J. and Frnčík M. Laser surface texturing of tool steel: textured surface quality evaluation. Open Engineering, 6(2016), 90 – 97. 37. Guo J., Li Y., Lu H. et al. An effective method of
edge deburring for laser surface texturing of Co-Cr-Mo alloy. The International Journal of Ad-vanced Manufacturing Technology, 2017, In press. 38. Šugárová J., Šugár P. and Frnčík M. Friction
evalu-ation of laser textured tool steel surfaces. Acta Me-chanica et Automatica, 11(2017), 129 – 134. 39. Mielnik E. M. 1991. Metalworking science and