INTRODUCTION
In many existing or proposed industrial plants, outdoor belt conveyor transport systems are widely used for transportation different kinds of solid materials. Belt conveyor systems often become an environmental issue for near sur-roundings due to noise emissions.
Therefore, attention was paid to reducing the noise of these systems and monitoring of reliable operations of conveyor transport systems. Con-veyor transport systems are usually part of more complex industrial plants and secure transport of the materials between individual parts. It is im-portant to realize monitoring of the parameters continuously for their reliable and effective op-eration. Belt conveyor monitoring was described by Wang et al. [11], while design and monitoring for belt conveyor was presented by Lu et al. [12]; other important aspects of online monitoring were described as well [5, 10].
During their operation, conveyor transport systems produce noise emissions, but often this noise overlaps with other noise sources in an in-dustrial plant. Due to this reason, individual
iden-tification of conveyor transport system is difficult to perform with the classic methods.
Nowadays, new progressive methods for noise identification and localization exist. These methods include sound visualization techniques based on different techniques. The sound visu-alizations technique includes beamforming, near field acoustic holography, focalization or direct measurement by using special sensors. Noise vi-sualization methods were described in [6, 7] and similar issues were dealt with in [8].
Monitoring conveyor transport systems during their operation is important due the several reasons, including: control of correct operations, prediction of maintenance or failure diagnostics. Methodology of failure diagnostics of continuous transport systems was described at Fedorko et al. [2]. Failure of con-veyor belt systems is often accompanied with signifi-cant increase of noise levels. Due these reason, it is possible to use sound identification and localization techniques for failure diagnostics. After the noise sources identification, it is possible to design a noise reduction measure, select appropriate acoustic mate-rial and also consider other relevant properties of the material that were described in [1, 3, 9].
1 Technical University of Kosice, Department of Process and Environmental Engineering, Letna 9, 042 00 Kosice,
Slovak Republic
* Corresponding author’s e-mail: [email protected]
ABSTRACT
Sound visualization methods and techniques are currently applied in various fields to identify and locate individual
sources of noise. Conveyor systems are used in various industrial plants. Conveyors require regular inspection and
maintenance. In some operations, conveyor systems are difficult to access for the maintenance purposes. During
their operation, conveyor systems contribute to increasing the noise levels. The increased noise emitted by a
con-veyor may signal the failure of a certain part of the system. Such failures can be identified by a sound visualization device and contribute to an effective maintenance of conveyor systems. The paper analyzes specific conveyor systems and identified potential failures of these conveyor systems by using sound visualization methods.
MATERIAL AND METHODS
Noise visualization techniques provide a new approach for identification and localization of noise sources. The equipment used for noise vi-sualization is generally called acoustic cameras. A digital camera, as part of an acoustic camera, takes an image of the noise emitting object. At the same time an exactly computed microphones ar-ray acquires and records the sound waves emitted by the sources of the noise. Specially-developed software calculates a acoustic map and combines the acoustical and the optical images of the noise source. The basic part of acoustic camera is mi-crophone array. Mimi-crophone arrays are designed for different measurement distances and different range of frequencies (Fig. 1).
An acoustic camera made by gfai company was used for experimental measurement; it is equipped with a star microphone array that uses beamforming signal processing sound visualiza-tion technique featuring following parameters: • aluminum array structure diameter: 3,4 m, • number of microphones: 48,
• recommended mapping frequencies: 100 Hz-13 kHz,
• recommended measurement distances: 7-500 m, • maximum equivalent sound level: 130 dB, • acoustic maps from 23 dB-130 dB,
• operating environment: 0°...45°C, up to 80% r.h. Signal processing from microphone array is an important part of the sound visualization. Most commonly used techniques for signal processing are beamforming, nearfield acoustic holography, SONAH or Helmholtz Equation Least Squares (HELS) [4,8].
Beamforming signal processing principle that was used is the far field approach the
delay-and-sum beamforming method. This technique is based on special time delays sets for the incom-ing signals from the microphone array on a spatial location. The correct delay set results in a coher-ent overlay by adding up all microphone signals. With that special time delay, the area emitting the strongest sound pressure can be found by the cre-ating of acoustic map image (Fig. 2).
RESULTS
This chapter presents the results of mea-surement executed by the acoustic camera. The measurement was realized at the stones sorting and crushing line. A belt conveyor is part of this line. The measurement was realized in two dif-ferent operation modes with load of stones and without load, from the distance of 77 meters, focused on the conveyor belt system. The place-ment of the acoustic camera and view on the sorting and crushing line with conveyor system is shown in Fig. 3.
Fig. 1. Microphone arrays [8]
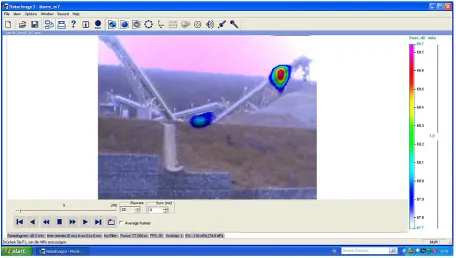
Fig. 4 presents the sound visualization of belt conveyor systems during proper operation. This measurement was performed in year 2016 after the installation of new belt conveyor system. The dominant source of the noise can be seen in the input part of belt conveyor. Noise is emitted mainly by the power drive unit and by the stones entering the conveyor. No other relevant sound sources were found.
The control measurement was carried out 20 months later under the same conditions. The measurements were realized in two different op-eration modes, with load of stones and without load. The measurement was conducted from the
The second source of noise was identified in the upper part of the conveyor. This source of noise was not registered during the first of measure-ments series. This identified source of the noise in that part means failure of conveyor.
Draft of measurement and valuation procedure
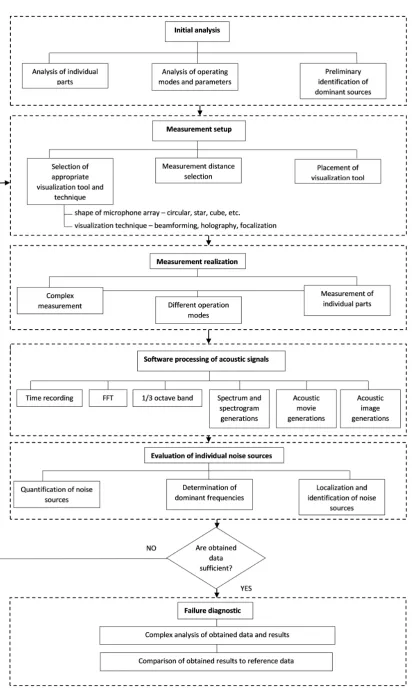
The draft of measurement procedure for diagnostics of conveyor systems by the sound visualization methods consists of following steps (Fig. 9):
a) Initial analysis
The first step of the procedure is preliminary inspection of the investigated object and collection of the basic information about the the functions
Fig. 3. Installed acoustic camera
and operating modes. Preliminary inspection is ex-ecuted mostly by the visual and hearing control.
b) Measurement setup
Before conducting the measurement, it is necessary to take into account the sound param-eters of the investigated devices. An important
step is to choose the measurement location and the measurement distance towards the measured object. On the basis of sound parameters and the measurement location, an appropriate mi-crophone array is selected. Nowadays, different shapes of microphone arrays are available from various producers.
Fig. 5. Sound visualization of belt conveyor with load of stones
c) Measurement realization
First part of the measurement process is fo-cused on the whole investigated object during dif-ferent operation modes. On the basis of the pre-liminary analysis of these measurements, partial dominant noise sources were identified. According to these measurements, the next measurement step is focused on these individual sources of noise.
d) Software processing of acoustic signals
The measurement is followed by software pro-cessing. The results of software processing are:
• Acoustic images for entire spectrum, • Acoustic movies for entire spectrum,
• Acoustic images and movies for selected fre-quency range,
• FFT spectrum analysis, • Octave band analysis, • Spectrogram analysis, • Frequency weighting,
• Listening of individual points.
e) Evaluation of individual noise sources
On the basis of software processing, the ana-lyzed data is obtained. Individual sources of noise
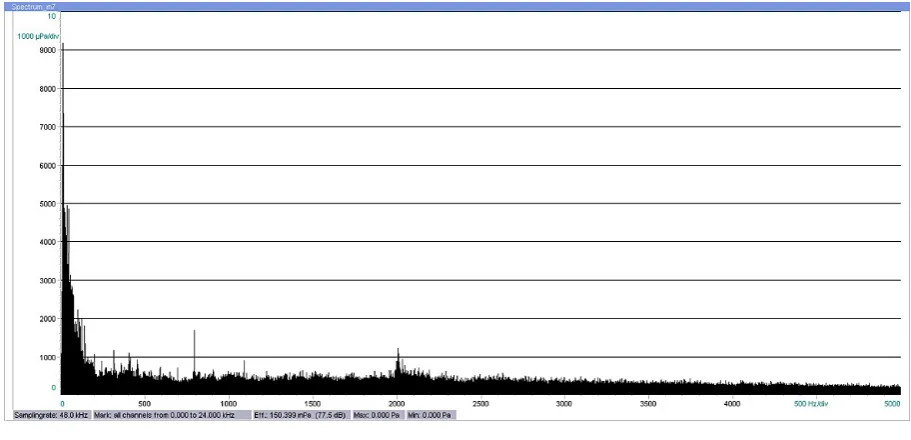
Fig. 7. Frequency spectrum
DISCUSSION AND CONCLUSION
Monitoring of the correct operation of the conveyor at industrial sites is important for ef-ficient company logistics. Several ways of con-veyor monitoring are available. One of the pos-sible ways of monitoring conveyor is to use an acoustic camera. The acoustic camera is tool that allows noise visualizations of the noise sources. Increased noise level of conveyor sys-tem is often caused by the incorrect operation of conveyor. This noise is emitted by the struc-tural parts of belt conveyor, frame, belt, idler rolls and drums. These parts of belt conveyor are hardly accessible and their monitoring and diagnostic is due this reason very difficult. The measurement performed by means of an acous-tic camera allows fast measurement and diag-nostics from a larger distance. The results of the measurement are generated as a colored map – acoustic images that clearly show the location and identification of sound sources. According to the proposed measurement and valuation pro-cedure, a failure diagnostic of the belt conveyor can be performed.
Acknowledgments
This paper was written in frame of the work on the projects KEGA 041TUKE-4/2018 (50%). The Slovak Research and Development Agen-cy supported this work under the contract No. APVV- 0432-12 (50%).
REFERENCES
1. Debski H., Teter A., Kubiak T., Samborski S. Lo
-cal buckling, post-buckling and collapse of
thin-walled channel section composite columns
sub-al parameter estimation for high-speed digitsub-al image correlation. Mech Syst Signal Process., 93, 2017, pp. 66–79.
5. Molnár V., Fedorko G., Andrejiová M., Grinčová A., Michalik P. Online moniroring of a pipe con -veyor. Part I: Measurement and analysis of selected operational parameters, Meas. J. Int. Meas. Con-fed. 94, (2016), 364-371.
6. Moravec M., Liptai P. Innovative methods and equipment for noise visualization. 2017. In: ICEEE
2017. – Košice. elfa s.r.o., 2017 pp. 130-133.
7. Moravec M., Liptai P. Methods and progressive equipment for sound visualization of noise
sourc-es. In: Scientific Letters of Academic Society of Michal Baludansky. 2017. pp. 131-134.
8. Moravec M., Liptai P., Badida M., Dzuro T.
Dy-namic noise visualization methods for identifica
-tion of noise sources. SGEM 2014. 14th interna
-tional multidiscilinary scientific geoconference - GeoConference on Ecology, Economics, Edu -cation and Legislation conference proceedings. Volume 1. 17-26, June, 2014, Albena, Bulgaria.
- Sofia: STEF92 Technology, 2014 pp. 207-212. -
ISBN 978-619-7105-17-9 - ISSN 1314-2704. 9. Pavlík M., Kruželák L., Mikita M., Špes M., Bucko
S., Lisoň L., Kosterec M., Beňa L., Liptai, P. The
impact of electromagnetic radiation on the
degra-dation of magnetic ferrofluids. Arch Electr Eng.,
66(2), 2017. pp. 361-369.
10. G. Lodowijks, J. Ottjes. Inteligent belt conveyor
monitoring a control. Theory and application. Int. Mater. Handl. Conf. BeltCon, Randburg, South Af-rica, 2007, pp-1-9.
11. Shasha Wang, Weina GuoWu, WenRuihan, ChenT -ing, LiFang Fang. Research on Belt Conveyor Monitoring and Control System. International Conference on Information Computing and Appli-cations.ICICA 2010: Information Computing and Applications pp. 334-339.
![Fig. 1. Microphone arrays [8]](https://thumb-us.123doks.com/thumbv2/123dok_us/8805918.1774550/2.595.311.523.597.729/fig-microphone-arrays.webp)