ISSN : 2279-0535 8thSASTech 2014 Symposium on Advances in Science & Technology-Commission-IV Mashhad, Iran
Copyright © 2012 CTTS.IN, All right reserved
52
Reconfiguration of Distribution Network Based on a Genetic
Algorithm for Loss Reduction Considering Capacitor
Placement
Anise Rouhani
Azad University of Bojnourd, Email ID : [email protected]
Dr. Habib Rajabi Mashhadi
Azad University of Bojnourd, Email ID : [email protected]
Dr. Morteza Abbas Ghorbani
Shomal University of Amol, Email ID: [email protected]
Abstract - Reducing losses in Distribution networks, due to their considerable level, has been pursued by many researchers. Finding the optimal configuration of the network is known as one of the most effective and cost-effective approaches. This can be done by choosing the best states of the networks’ switches. In this paper, a genetic algorithm is proposed for optimizing network configuration in presence of discrete variables. While most of available studies have used average value of the network demand, in this paper variable daily profile of the demand of the network is employed. The simulation results on the IEEE 33-bus system indicates that changing the state of the network switches can considerable lower the losses and improve voltage profile.
Keywords - distribution network reconfiguration, radial distribution network, genetic algorithm, losses, capacitor.
1.
INTRODUCTION
Distribution networks transmit energy from distribution centers to the end-users. The distribution networks are typically radial grids with numerous branches. They have the largest contribution to the power system losses, owing to the larger currents flowing through the low-voltage cables compared to the high-low-voltage transmission lines. Hence, analysis and study of the ohmic losses in the distribution networks is of high importance.
Generally, the methods for loss reduction in distribution networks can be classified as follows,
Capacitor placement
Optimization of conductor size Network reconfiguration Network development Substation location
Load management of distribution transformers Voltage correction
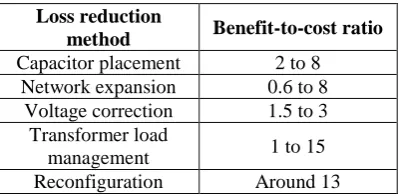
The ratio of benefit-to-the-cost for the aforementioned methods has been presented in Table I [1]. Clearly, the
network reconfiguration and transformer load management have the highest ratios among all methods.
Table I. ratio of benefit-to-cost for different loss reduction methods
Benefit-to-cost ratio Loss reduction
method
2 to 8 Capacitor placement
0.6 to 8 Network expansion
1.5 to 3 Voltage correction
1 to 15 Transformer load
management
Around 13 Reconfiguration
In this paper, capacitor placement in distribution network has been considered. Distribution network capacitors reduce the losses and improve voltage profile by compensating the reactive power. In this paper, placement of a 450-kVar capacitor bank is addressed. In References [3] and [4], combination of genetic algorithm (GA) and neural networks has been used to solve reconfiguration problem in distribution networks. A feeder reconfiguration technique has been proposed in [5], [6] and [7], where a formulation has been developed to calculate changes in network losses for each switching based on some assumptions. This formulation allows easier, but approximate, computation of the loss changes for different switching, compared to the power flow routine.
Ant colony optimization has also been employed for reconfiguration of distribution networks [8], [9], and [10].
8thSASTech 2014 Symposium on Advances in Science & Technology-Commission-IV Mashhad, Iran
Copyright © 2012 CTTS.IN, All right reserved
2.
PROBLEM DESCRIPTION
Reconfiguration of the distribution networks implies change in the network topology for performance improvement while the radial structure of the network is preserved. Such changes can be achieved by varying the states of the network switches. Distribution network reconfiguration not only reduces network losses, but also improves voltage profile and balances the loads. Generally, the distribution networks have a weak screening structure, but are operated radially due to protection issues, such as lowering short-circuit level, easy relay coordination and better protection. Hence, there are a number of normally open (NO) and normally closed (NC) switches in the network, which can be employed for the reconfiguration of the distribution network to achieve the lowest distribution losses. For instance, in case of a fault in the network, some of switches are open to clear the fault. In this circumstance, some of the NO switches must be closed to allow energy transmission to the non-faulted areas in such a way that the best network configuration, in terms of losses, is obtained.
3.
CAPACITOR BANKS IN DISTRIBUTION
NETWORKS
Capacitor banks serve different purpose in electric energy systems. Generally, the main benefits of the capacitor banks can be summarized as follows,
Compensate the reactive power Enhancing transmission capacity Lowering network losses Power factor correction
Steady-state voltage profile correction
While a capacitor bank can provide all the above-mentioned influences simultaneously, but the size and location of the capacitor bank depends on the main objective function, in form of one or several of the above-mentioned benefits [11].
The capacitors are effectively reduce transmission losses by compensating for the reactive power and hence lowering the current from the generators to the capacitor bank. Hence, capacitor banks are able to reduce transmission losses as well as the transmission lines loading. Accordingly, capacitor placement and network reconfiguration are suitable measures to reduce losses in the distribution networks.
4.
PROBLEM FORMULATION
In this paper, minimization of the losses serves as the objective function, as stated below,
Ploss = 𝐼𝑏2∗ 𝑅𝑏 𝑁𝑟
𝑏=1 (2)
where, 𝑅𝑏 and 𝐼𝑏 represent the resistance and current of
feeder b, respectively and 𝑁𝑟 is the number of feeders.
During network reconfiguration, the following three requirements must be always satisfied,
The radial structure of the network must be preserved.
The demand of all network consumers must be met.
The bus voltages and load currents must be within their permissible limits.
1.1.Necessary condition to have a radial network
In a tree with A nodes and B branches, if the following holds,
A=B+1 (1)
hen, it can be concluded that the necessary condition for the absence of any mesh in the network is satisfied.
1.2.Sufficient condition to have a radial network
If one-by-one elimination of the first-order nodes (i.e. nodes with only one branch) of a three leads to the elimination of the whole tree, it can be concluded that the tree represents a radial network.
1.3.Non-islanding operation check
It is necessary to check if the all buses of the distribution network are interconnected. Examples can be drawn where a radial network is formed by a number of islanded sub-networks.
To check for the non-islanding operation of the distribution network, a routing algorithm, presented in the Appendix, is employed. The routing algorithm is based on the node-node connection matrix which, owing to the radial topology of the distribution networks, allows easy finding of the path between each end node and the slack node as well as the intermediate buses.
If all buses of the network are available in the matrix, then the network is non-islanded. The node-node connection matrix is defined as an nn matrix, where n is number of network nodes. In this matrix, the entries of the row i and column j (aij) and row j and column i (aji) are unity if the buses i and j are directly connected through a feeder, and zero otherwise (i.e. if these two buses are not directly connected).
1.4.Loss calculation methodology
In this paper, network losses are determined using a backward-forward load flow program. This technique is simple with reasonable computational burden and allows easy analysis of the distribution networks.
1.5.Reconfiguration time
To decide upon the reconfiguration time point, 24 hours of the day are divided into several sub-intervals. The best time for the network reconfiguration is designated by the highest reduction in the network losses. If the benefit of a reconfiguration surpasses the associated costs, the time and new configuration are saved. This procedure is terminated when the cost of the reconfiguration is higher than its benefit.
In this study, the three types of load, including commercial, industrial and residential loads, are considered.
Each bus includes a different ratio of these three load types. However, the load/time curve of each load type is identical [12].
Lk,j = 3𝑖=1𝐿𝑘𝑚𝑎𝑥 × 𝑀𝑘,𝑖× 𝐶𝑖,𝑗
(3)
where, k is the bus number, i indicates load type, j shows the time, 𝐶𝑖,𝑗 represent the portion of i-th load type at
time j, 𝑀𝑘,𝑖 denotes the ration of the i-th load type at bus
k, and 𝐿𝑘𝑚𝑎𝑥 is the peak load at bus k (120% of the main
ISSN : 2279-0535 8thSASTech 2014 Symposium on Advances in Science & Technology-Commission-IV Mashhad, Iran
Copyright © 2012 CTTS.IN, All right reserved The parameters of the GA algorithm are presented in
Table II.
Table II. Parameters of the GA algorithm
5.
SIMULATION RESULTS
1.6.Simulation results without considering capacitor bank
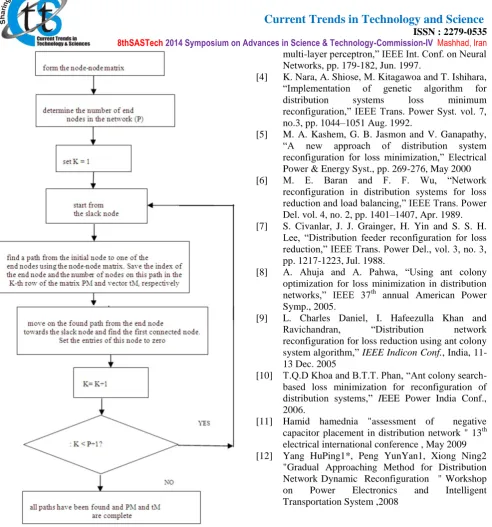
The IEEE 33-bus test system is used to assess the proposed method. This system includes 33 buses and five meshes. The open switches in the initial configuration of the system include s33, s34, s35, s36, and s37. A variable system load has been considered in this study. The study horizon is one day, divided into 24 points (T0=[1 25]). The transmission zlosses of the initial configuration for one day are about 2305.051 kW. More detailed data are presented in Tables III and IV.
The cost of each MW has been assumed 0.6 $ while each network reconfiguration costs one $. Based on the obtained results, the first reconfiguration has occurred at the first hour and the switches s7, s 9, s14, s28, and s32 have been opened. The network losses due to this reconfiguration amount to 1530.39 kW. For this case, reconfiguration benefit is higher than the reconfiguration cost. Hence, the first reconfiguration is justified.
The second reconfiguration has occurred at hour 17 when the switches s7, s9, s14, s32, and s37 have been opened. The network losses after this reconfiguration are 1526.95 kW. The higher reconfiguration benefit compared to its cost, also justifies the second reconfiguration.
For the third reconfiguration at the hour 22, the switches s7, s9, s14, s28, and s32 have been opened. In this case, transmission losses are 1526.07. In contrast to the previous reconfigurations, the cost of the third reconfiguration is higher than the obtained benefits, indicating inefficiency of this change.
Table III. Ratio of each load type at each bus [12]
K M1 M2 M3 K M1 M2 M3
2 0.2 0.5 0.3 18 0.4 0.5 0.1
3 0.5 0.3 0.2 19 0.5 0.2 0.3
4 0.5 0.2 0.3 20 0.7 0.3 0
5 0.6 0.1 0.3 21 0.5 0.3 0.2
6 0.4 0.4 0.2 22 0.3 0 0.7
7 0.6 0 0.4 23 0.5 0.4 0.1
8 0.3 0.3 0.4 24 0.4 0.5 0.1
9 0.4 0.6 0 25 0.6 0.4 0
10 0.3 0 0.7 26 0.7 0.3 0
11 0.6 0.2 0.2 27 0.1 0 0.9
12 0.5 0.5 0 28 0.6 0.3 0.1
13 0.6 0.4 0 29 0.4 0.1 0.5
14 0.4 0.4 0.2 30 0.7 0.2 0.1
15 0.5 0.1 0.4 31 0.4 0.4 0.2
16 0.2 0.7 0.1 32 0.2 0.1 0.7
17 0.3 0.3 0.4 33 0.3 0.7 0
Table IV. Hourly load distribution [12]
J C1 C2 C3 J C1 C2 C3
1 0.1 0.1 0.3 13 0.6 0.7 0.5
2 0.1 0.1 0.3 14 0.7 0.6 0.6
3 0 0.1 0.4 15 0.8 0.5 0.8
4 0 0.1 0.2 16 1 0.6 0.8
5 0 0.4 0.2 17 1 0.7 0.7
6 0 0.3 0.3 18 0.8 0.8 0.7
7 0.1 0.4 0.3 19 0.6 0.9 0.8
8 0.2 0.4 0.4 20 0.7 1 0.9
9 0.7 0.3 0.8 21 0.6 1 1
10 0.8 0.3 1 22 0.2 0.6 0.8
11 0.8 0.5 0.9 23 0.1 0.5 0.5
12 0.7 0.6 0.9 24 0.1 0.2 0.4
Table V. Results of reconfiguration of the test system 𝑪𝒕∆𝒑𝒍𝒐𝒔𝒔($)
∆𝒑𝒍𝒐𝒔𝒔(MW) Number of
ti -switch Hour
464.4 0.774
s7 s9 s14 -s28 -s32 1
2.04 0.0034
s7 –s9 –s14 – s32- s37 17
0.53 0.00088
s7 –s9 –s14 – s28 –s32 22
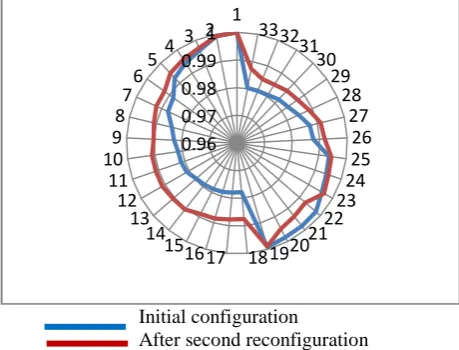
Fig. 1 compared the voltage profile of the test system before any reconfiguration and after the second reconfiguration. It is seen that voltage magnitude of almost all buses has been improved. The lowest voltage magnitude for the initial reconfiguration was 0.977 pu at bus 17 while in the GA-improved system the lowest voltage has been enhanced to 0.984 pu at bus 31.
Initial configuration
After second reconfiguration
Fig. 1. Comparison of the voltage profile before any reconfiguration and after the second reconfiguration
without any capacitor placement
1.7.Simulation results with capacitor bank
In this stage, a 450-MVar capacitor bank is connected to the system. The location of the capacitor bank is found using the GA algorithm in order to minimize the objective function.
Table VI. Results for system reconfiguration after the capacitor bank placement
𝑪𝒕∆𝒑𝒍𝒐𝒔𝒔($)
∆𝒑𝒍𝒐𝒔𝒔(MW) Number of ti –
switch Hour
634.85 1.058
s7 -s9 -s14 –s32 – s37 5
0.96 0.97 0.98 0.99
1 1 2 3 4 5 6 7 8 9 10 11
12 13
14
151617 18192021 2223
8thSASTech 2014 Symposium on Advances in Science & Technology-Commission-IV Mashhad, Iran
Copyright © 2012 CTTS.IN, All right reserved
1.074 0.00179
s7 –s9 –s14 –s28 –36 22
According to the obtained results, two reconfigurations are cost-effective. The first one has happened at the hour five with the switches s7, s9, s14, s32, and s37 opened and the network losses of 1246.96 kW. The second reconfiguration has happened at the hour 22 and the switches s7, s9, s14, s28, and s36 have been opened. For this case, the transmission losses were 1227.16 kW. In both cases, bust 29 was selected as the best location for the capacitor bank. Fig. 2 shows the voltage profile before and after the capacitor bank placement at bus 29. Obviously, the voltage profile at almost all buses has been enhanced. The minimum voltage magnitude of 0.977 pu at bus 17 in the initial configuration has been improved to 0.988 pu at bus 17 after the capacitor placement by use of the genetic algorithm.
Initial configuration
After second reconfiguration Fig.2. Comparison of the voltage profile before any reconfiguration and after the second reconfiguration with
the capacitor placement
6. CONCLUSION
This paper proposed a distribution network reconfiguration methodology for reducing losses. Based on the simulation results, reconfiguration of the distribution network can considerably reduces transmission losses. The obtained results on the IEEE 33-bus test system showed that the when no capacitor bank was installed, the transmission losses were reduced b 33.8% via network reconfiguration while in case of installed capacitor bank the losses were lowered by 46.7%.
Besides, it was shown the network reconfiguration improves voltage profile. According to the simulation results, installing a capacitor bank at bus 29 yielded the highest voltage profile improvement.
Inclusion of distributed generation resources can also help releasing distribution network capacity, improving reliability, generating heat and power simultaneously, enhancing power quality and voltage profile and finally reducing transmission losses.
APPENDIX
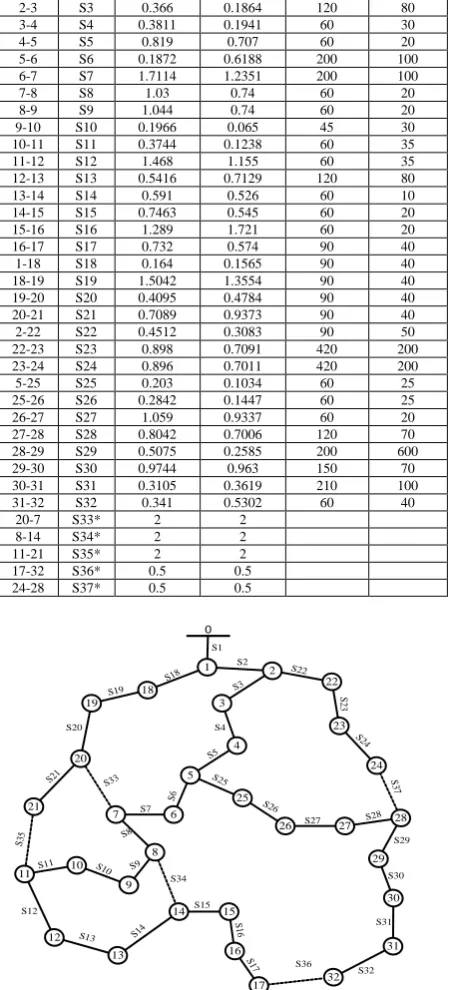
Table I. IEEE 33-bus system data
End bus reactive
load (KVAr) End bus real load (KW) X (Ohms) R (Ohms) Line Bus 60 100 0.047 0.0922 S1 0-1 40 90 0.2511 0.493 S2 1-2 80 120 0.1864 0.366 S3 2-3 30 60 0.1941 0.3811 S4 3-4 20 60 0.707 0.819 S5 4-5 100 200 0.6188 0.1872 S6 5-6 100 200 1.2351 1.7114 S7 6-7 20 60 0.74 1.03 S8 7-8 20 60 0.74 1.044 S9 8-9 30 45 0.065 0.1966 S10 9-10 35 60 0.1238 0.3744 S11 10-11 35 60 1.155 1.468 S12 11-12 80 120 0.7129 0.5416 S13 12-13 10 60 0.526 0.591 S14 13-14 20 60 0.545 0.7463 S15 14-15 20 60 1.721 1.289 S16 15-16 40 90 0.574 0.732 S17 16-17 40 90 0.1565 0.164 S18 1-18 40 90 1.3554 1.5042 S19 18-19 40 90 0.4784 0.4095 S20 19-20 40 90 0.9373 0.7089 S21 20-21 50 90 0.3083 0.4512 S22 2-22 200 420 0.7091 0.898 S23 22-23 200 420 0.7011 0.896 S24 23-24 25 60 0.1034 0.203 S25 5-25 25 60 0.1447 0.2842 S26 25-26 20 60 0.9337 1.059 S27 26-27 70 120 0.7006 0.8042 S28 27-28 600 200 0.2585 0.5075 S29 28-29 70 150 0.963 0.9744 S30 29-30 100 210 0.3619 0.3105 S31 30-31 40 60 0.5302 0.341 S32 31-32 2 2 S33* 20-7 2 2 S34* 8-14 2 2 S35* 11-21 0.5 0.5 S36* 17-32 0.5 0.5 S37* 24-28
Fig. 1. IEEE 33-bus test system
0.96 0.98
12 1 3 4 5 6 7 8 9 10 11 1213
14151617 181920212223 2425 26 27 28 29 30 31 32 33 S1 S18 S19 S20 S35 S12 S9 S14 S15 S32 S17 S36
S13 S31 S30 S24 S 23 2 S3 S22 S21 S2 S29 S 37 S28 S25 S27 S7 S33 S6 S34 S10 S11 S26 S5 S4 22 23 24 4 19 1 18 3 25
26 27 28
ISSN : 2279-0535 8thSASTech 2014 Symposium on Advances in Science & Technology-Commission-IV Mashhad, Iran
Copyright © 2012 CTTS.IN, All right reserved Fig. 2. The proposed routing algorithm
REFERENCES
[1] Distribution Management Engineering Office "guideline determination and reduce distribution
system losses " Tavanir company December 2005 [2] Leonardo W. de Oliveira a , Sandoval Carneiro Jr.
a, Edimar J. de Oliveira b, J.L.R. Pereira b,Ivo C. Silva Jr. c, Jeferson S. Costa d " Optimal reconfiguration and capacitor allocation in radial distribution systems for energy losses minimization " Electrical Power and Energy Systems Electrical Power and Energy Systems 32, pp. 840–848 , 2010
[3] E. Gauche, J. Coelho and R. C. G. Treive, “An online distribution feeder optimal reconfiguration algorithm for resistive loss reduction using a
multi-layer perceptron,” IEEE Int. Conf. on Neural Networks, pp. 179-182, Jun. 1997.
[4] K. Nara, A. Shiose, M. Kitagawoa and T. Ishihara, “Implementation of genetic algorithm for distribution systems loss minimum reconfiguration,” IEEE Trans. Power Syst. vol. 7, no.3, pp. 1044–1051 Aug. 1992.
[5] M. A. Kashem, G. B. Jasmon and V. Ganapathy, “A new approach of distribution system reconfiguration for loss minimization,” Electrical Power & Energy Syst., pp. 269-276, May 2000 [6] M. E. Baran and F. F. Wu, “Network
reconfiguration in distribution systems for loss reduction and load balancing,” IEEE Trans. Power Del. vol. 4, no. 2, pp. 1401–1407, Apr. 1989. [7] S. Civanlar, J. J. Grainger, H. Yin and S. S. H.
Lee, “Distribution feeder reconfiguration for loss reduction,” IEEE Trans. Power Del., vol. 3, no. 3, pp. 1217-1223, Jul. 1988.
[8] A. Ahuja and A. Pahwa, “Using ant colony optimization for loss minimization in distribution networks,” IEEE 37th annual American Power
Symp., 2005.
[9] L. Charles Daniel, I. Hafeezulla Khan and Ravichandran, “Distribution network reconfiguration for loss reduction using ant colony system algorithm,” IEEE Indicon Conf., India, 11-13 Dec. 2005
[10] T.Q.D Khoa and B.T.T. Phan, “Ant colony search-based loss minimization for reconfiguration of distribution systems,” IEEE Power India Conf., 2006.
[11] Hamid hamednia "assessment of negative capacitor placement in distribution network " 13th electrical international conference , May 2009