Wastelands Change Analysis Using Multi-Temporal Satellite
Data in Arid Zone of Haryana
V. S. Arya
Senior Scientist „SG‟, Haryana Space Applications Centre (HARSAC), [email protected] Sandeep Kumar
JRF, Haryana Space Applications Centre (HARSAC), [email protected] Hardev Singh
JRF, Haryana Space Applications Centre (HARSAC) Anil Kumar
Project Assistant, Haryana Space Applications Centre (HARSAC) R. S. Hooda
Chief Scientist, Haryana Space Applications Centre (HARSAC) Sandeep arya
Assistant Scientist, Haryana Space Applications Centre (HARSAC)
Abstract - India shares 16% of the world population, while its land is only 2% of the total geographical area of the world. Naturally, the pressure on the land is often beyond its carrying capacity. Therefore, the productive lands, especially the farmlands in the India are in the constant process of various degrees of degradation and are fast turning into wastelands. At present, approximately 68.35 million hectare area of the land is lying as wastelands in India. Out of these lands, approximately 50% lands are such non-forest lands, which can be made fertile again if treated properly. It was unprotected non-forestlands, which suffered the maximum degradation mainly due to the tremendous biotic pressure on it [1]. In the present study Wasteland change analysis in four district of
South-Western Haryana Bhiwani, Rewari,
Mahendergarh & Mewat was carried out. IRS-IC/ID LISS-III digital data for three seasons i.e. Kharif, Rabi and Zaid for the year 2008-09 was used for interpretation of the wastelands in the state adopting WGS-84 datum and UTM projection system. The interpretation and analysis of satellite data was carried out by using on-screen interpretation technique on 1:35000 scale. The vector data of wastelands generated during 2005-06 was also used to generate change detection matrix in the districts. The total wastelands changes during the year 2005-06 to 2008-09 occur in form of wasteland to non wasteland, new wastelands or non wasteland to wasteland and one wasteland class to another wasteland class.
Keywords - Wastelands change analysis, Satellite data & Change detection.
1. INTRODUCTION
Excessive demand of land for both agricultural and non-agricultural uses has resulted in creation of vast stretches of wastelands such as degraded land, soil salinity, water logging, desertification, soil erosion etc., and the decrease in per capita cultivable land besides ecological
imbalances. Management of natural resources
particularly land and water are very essential for sustainable development of living beings on the earth. The increasing population pressure, urbanization and industrialization have put a great stress on our natural resources, resulting the decrease in agricultural area. To cater to the needs of ever increasing population for food, fibre, shelter, fuel and fodder, the natural resources have been over exploited causing land degradation and ecological imbalance. So, there is an urgent need to identify and reclaim these degraded lands to meet the future demands of growing population [2].
Wasteland is described as“degraded land which can be brought under vegetative cover with reasonable effort, and which is currently underutilized and or land which is deteriorating for lack of appropriate water and soil management or on account of natural causes. Wastelands can result from inherent/imposed disabilities such as by location, environment, chemical and physical properties of the soil or financial or management constraints.” [3]
Remote sensing data or Geographical Information System (GIS) and Global Positioning System (GPS)
techniques have capability to provide reliable
to 2008-09 in four districts (Rewari, Bhiwani, Mahendergarh & Mewat) of Haryana.
2. STUDY AREA
The study area of four districts (Rewari, Bhiwani, Mahendergarh & Mewat) of Haryana, India is located
between 27°38‟N to 29°04‟N latitudes and 75°28‟E to
77 °20‟E longitudes. The total geographical area under
study is 9642.91 sq. km.
Figure: 1
The far inland location and bordering the Rajasthan desert in the west have profoundly influenced the climate, The climate of the study area is very hot in summer from April to June and cold in a fairly long winter period lasting from November to March. The climate in the districts varies from arid to semi arid. The summer months are very hot with maximum temperature ranging from 41 °C to 46 °C in May and June. June is the period of highest incidence of dust storm. Sometimes, the temperature rises up to 48 °C. The average annual rainfall of these districts for the years of 2002-2006 is 346.9mm and the average rainfall during 2007-2009 is 725 mm. These districts is dominated by dry lands with presence of inland streams, sandy plains, shifting sand dunes, stabilized sand dunes, dissected upland tracts and often barren, denuded, rocky hill ranges and their
outcrops. The above mentioned features are
morphologically symmetrical and provide rapid and large
variations in relief and slope characteristics.
Consequently, the overall relief is undulating with a regional slope [4].
3. MATERIALS AND METHODOLOGY
The Indian Remote Sensing Satellite data (IRS-P6) LISS-III is used for the study region acquired from National Remote Sensing Centre (NRSC), Hyderabad. Satellite sensor or sensor specifications and acquisition dates for the data used during the analysis are given in Table 1,
Table -1 Satellite data specification
Survey of India Topographical Sheets: on 1:50000 are also used as base data numbered as: 44O/07,44O/08,44O/11,44O/12,44O/14,44O/15,44O/16, 44P/09,44P/13,44P/15,44P/16,53C/04,53C/08,45M/13,5 3D/03,53D/04,53D/07,53D/08,53D/11,53D/12,53D/15,5 3D/16,54A/01,54A/09,54H/03,54H/04,54H/08,54A/13,5 4A/14,54E/01,54A/02,54A/05
Software’s used:
ERDAS IMAGINE 9.3, ARC/MAP.9.2, Microsoft Office 2007 and handheld Garmin 72 GPS.
The present wastelands change maps was prepared on 1:50,000 scale to monitor the wastelands change during the year 2005-06 to 2008-09. Remote Sensing Satellite data (IRS-P6) LISS-III acquired during the above years is used.
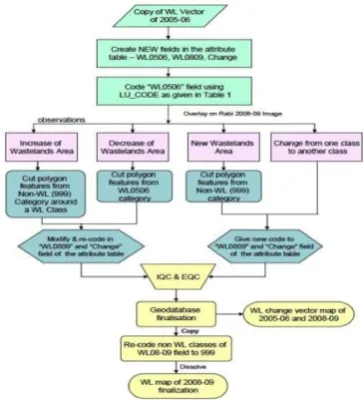
Figure: 2 Methodology Flow Chart S.
No. Satellite Sensor Season
Date of acquisition
1. IRS-P6 LISS-III Rabi March,2009
2. IRS-P6 LISS-III Kharif October,2008
Wastelands classification suggested by NRSC, Department of Space, Govt. of India [5] is used for this study shows in table no.2.
Table-2: Coding system for change analysis
GROUND TRUTH:
Doubtful areas are checked by field verification and wastelands location is collected by handheld GPS.
4. RESULTS AND DISCUSSION
Wastelands cover 793.6 Sq.km and 8.23% of total geographical area of the study area in 2008-09. Land with open scrub is the dominant category in the wasteland in the study area. It covers 353.80
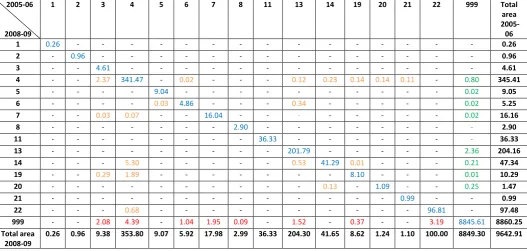
Sq.km.in 2008-09. Table no.3 showing wastelands change analysis under different categories during
2005-06 to 2008-09. Blue colour used to denote no
change, brown colour shows change between one wasteland class to another wasteland class, red
colour for increase in wasteland and green colour
decrease in wasteland.
Land with open Scrub:- scrub are generally prone to deterioration, at times chemically degraded, high topographic locations and lands subjected to excessive aridity with sparse vegetation, devoid of scrub and have a thin soil cover [6]. The total area under this class is 345.41sq. km in 2005-16 and in 2008-09 it increased to 353.80 sq.km. Total change is 8.39 sq. km. 2.37 sq. km area of this class was changed in class 3 (land with dense scrub), 5.30 sq. km area of class 14(Degraded Land Under Plantation Crops) & 1.89 sq. km area of class 19 (Sand – Semi Stab – Stab15-40 m) changed in land with open scrub, 4.39 sq. km. area changed into land with open scrub from 999 (non wasteland class), 341.47 sq. km area of land with open scrub class was unchanged.
Land with dense scrub:- possess shallow and skeletal soils, at times chemically degraded, extremes of slopes, severely eroded and lands subjected to excessive aridity with scrubs dominating the landscape [6]. The total area in this category is 4.61sq. km in 2005-06.In the year 2008-09 it increased 4.77 sq.km. 2.37sq. km area changed from class 4 (land with open scrub) & 2.08 sq. km area from class 999 (non wasteland) to class 3 (land with dense scrub).
Land affected by salinity/alkalinity:- has excess soluble salts (saline) or high exchangeable sodium. Salinity is caused due to movement of water, capillary rise during extreme weather conditions leaving salt encrustation on the surface [6]. Alkali lands have an exchangeable sodium percentage (ESP) value of 15 or more, which is generally considered as the limit between normal and alkali soils. The predominant salts in alkali soils are carbonates and bi-carbonates of sodium. Co
de Category
1. Gullied and /or Ravinous Land (Medium)
2. Gullied and /or Ravinous Land (Deep)
3. Land with Dense Scrub
4. Land with Open Scrub
5. Waterlogged & Marshy Land (Permanent)
6. Waterlogged & Marshy Land (Seasonal)
7. Land Affected by Salinity/Alkalinity (Moderate)
8. Land Affected by Salinity/Alkalinity (Strong)
9. Shifting Cultivation - Current Jhum
10. Shifting Cultivation - Abandoned Jhum
11. Under-utilized/Degraded Forest (Scrub Dominated)
12. Under-utilized/Degraded Forest (Agriculture)
13. Degraded Pasture/Grazing Land
14. Degraded Land Under Plantation Crops
15. Sands – Riverine
16. Sands - Coastal
17. Sands - Desertic
18. Sand – Semi Stab - Stab>40 m
19. Sand – Semi Stab – Stab15-40 m
20. Mining Wastelands
21. Industrial Wastelands
22. Barren Rocky Area
23. Snow Covered /Glacial Area
24. Built-up
25 Industrial Area
26 Cropland
27 Fallow Land
28 Plantation
29 Forest (Dense/Open)
30 Forest Plantation
31 Grasslands
32 Water bodies
33 Non Wasteland Area
Wasteland
classes
Table -3 wastelands change analysis under different categories from 2005-06 to 2008-09. (Area in sq. km.)
2005-06
2008-09
1 2 3 4 5 6 7 8 11 13 14 19 20 21 22 999 Total
area 2005-06
1 0.26 - - - 0.26
2 - 0.96 - - - 0.96
3 - - 4.61 - - - 4.61
4 - - 2.37 341.47 - 0.02 - - - 0.12 0.23 0.14 0.14 0.11 - 0.80 345.41
5 - - - - 9.04 - - - 0.02 9.05
6 - - - - 0.03 4.86 - - - 0.34 - - - 0.02 5.25
7 - - 0.03 0.07 - - 16.04 - - - 0.02 16.16
8 - - - 2.90 - - - 2.90
11 - - - 36.33 - - - 36.33
13 - - - 201.79 - - - 2.36 204.16
14 - - - 5.30 - - - 0.53 41.29 0.01 - - - 0.21 47.34
19 - - 0.29 1.89 - - - 8.10 - - - 0.01 10.29
20 - - - 0.13 - 1.09 - - 0.25 1.47
21 - - - 0.99 - - 0.99
22 - - - 0.68 - - - 96.81 - 97.48
999 - - 2.08 4.39 - 1.04 1.95 0.09 - 1.52 - 0.37 - - 3.19 8845.61 8860.25
Total area 2008-09
0.26 0.96 9.38 353.80 9.07 5.92 17.98 2.99 36.33 204.30 41.65 8.62 1.24 1.10 100.00 8849.30 9642.91
Moderate: The area under this category is increased
as 1.82 sq. km. from 2005-06 to 2008-09. Strong:
The area under this category is increased as 0.09 sq. km. from 2005-06 to 2008-09.
Degraded Pasture / Grazing Land:- These are the lands in non-forest areas that are either under permanent pastures or meadows, which have degraded due to lack of proper soil conservation and drainage measures. These lands are small in size, irregular in shape, scattered and are found close to settlement fringes and in flood plains [6]. Total area under this category is 204.06 sq km. in 2005-06 now it increased .014 sq km. in 2008-09 and 2.36 sq. km area of this class was changed into non wasteland class & 1.52 sq. km area of non wasteland class is
changed into class 13 (Degraded Pasture / Grazing
Land), 201.79 sq. km area of this class remain same.
Degraded Land under Plantation Crop:- These area the degraded lands that have been brought under plantation crops after reclamation and are located outside the notified forest areas. This category can be better delineated using multi-season satellite data in conjunction with ground data. These lands exhibit dark brown to light red colour, especially during peak growing season. However, tonal variation is controlled by the fraction of foliage cover vis-a-vis the season of the satellite data acquisition. These lands are small in
size and in regular pattern. The total area under this category is 47.34 sq. km. in 2005-06 & it decreased
5.69 sq km. in 2008-09. 5.30 sq. km area of this class changed into class land with open scrub & 41.29 sq. km area has not changed.
Figure: 3 Map shows wastelands in 2008-09.
CONCLUSIONS
The present study is conducted for wastelands change analysis using multi-temporal satellite data in four district of south-western Haryana as Bhiwani, Rewari, Mahendergarh and Mewat on 1:35000 scale. Total wasteland area in four districts under study is 782.66 sq. km. in 2005-06 which increased 11.06 sq. km. during to 2005-06 to 2008-09. The conclusion is as.
The total wasteland change during the year
2005-06 to 2008-09 11.2005-06 sq. km showing the negative change as wastelands increased.
The decreased wastelands converted into Non
wasteland as Built-up or crop land.
Land with open scrub is the dominant category in
wastelands in the study area. It covers 353.80 sq.km in 2008-09 & 44.58 % of total wasteland in study area. The technology thereafter requires the cleaning of area from the unwanted plants and improving conditions. It is recommended for development of horticulture plantation & silvi pastures.
Other dominant class is degraded pasture &
grazing land which was 204.30 sq. km in 2008-09 and 25.74% of total wasteland of study area. It
is recommended for development of silvi pastures & community forestry.
Wastelands change map during the period of
2005-06 to 2008-09 provides the information about the wastelands classes and their location in the districts of the study area. The areas where the positive, negative & class change occurred also shows that in which area wasteland development program are working successfully.
It was observed that satellite data proved to be
very useful in the interpretation of different wastelands category and their mapping. Global Positioning System (GPS) easily provide location information of these wastelands and change area on the image.
The wastelands change maps are useful to the
planner for the further development of these wastelands in the study area.
REFERENCES
[1] Ministry of Rural development; Department of Land Resources, Govt. of India, New Delhi.
[2] Arya,V. S; Arya, Sandeep; Khatri, S.S; Singh, Hardev; Kumar, Sandeep; Kumar, Dushyant; Sharma, Prem Parkash; Sharma, Heena; Hooda, R. S (2012): Wastelands Atlas of Haryana; HARSAC/TR/03/2012. Haryana Space Applications centre (HARSAC), Dept. of Science and Technology, Govt. of Haryana. [3] Arya,V. S; Arya, Sandeep; Khatri, S.S; Sharma, Prem
Parkash; Singh, Vijay; Sharma, Heena; Singh, Hardev; Hooda, R. S (2008): Updated Wastelands Atlas of Haryana (2003-2006): Haryana Space Applications centre (HARSAC), Dept. of Science and Technology, Govt. of Haryana.
[4] Statistical Abstract of Haryana (2007-2008).
Economic and statistical advisor, Planning
department Government of Haryana.
[5] Wastelands Atlas of India; 2011; Department of Land Resources; Govt. of India, New Delhi; pp3.
[6] MANUAL “National Wastelands Monitoring using Multi-temporal satellite data” (2007): National Remote Sensing Centre, Dept. of Space, Govt. of India; pp98.
A
UTHOR’
SP
ROFILEDr. V. S. Arya, Ph.D.
Senior Scientist „SG‟ (Soil Survey & Land Evaluation).