11
Failure Mode Effect Analysis and Parameter
Optimization of Projection Welded Joints
Naveen Ghanghas
1, Sanjeev
21
M.Tech Student, Department of Mechanical Engineering, CBS Group of Institutions, Jhajjar, Haryana 2
Asst. Professor(Mechanical Engineering), CBS Group of Institutions, Jhajjar, Haryana
ABSTRACT
Projection welding using capacitor discharge projection welding machine is gaining popularity in production of sheet metal works in industry. It is one of the most economical methods of projection welding ever known. Projection welding is widely used in fabrication of pump impellers for bottling plants, milk plants and fabrication of automobiles bodies in auto industry. The quality of projection welded joint plays a vital role in the durability and performance of pump impeller. Therefore, it becomes important to study the process parameters involved in the production of projection welded pump impellers, so that the quality of impellers improved and rejection rate due various reasons may reduced. M/s Flowguard, Gurgaon is engaged in production of multistage mineral water pumps with an increasing turnover, 8.7 crores last year. Main factors causing rejection of impeller were power, wear & tear welding electrode, improper cleaning of impeller plates and weak strength of the welded joint. Failure mode effect analysis (FMEA) was done to determine the risk priority number (RPN) against each cause and factor with higher RPN was selected for improvement.
INTRODUCTION
A projection welding is a resistance welding where high electrical resistance at the joint is developed by embossing one or more projections on one of the surfaces to be welded. The projections may have different shapes for design or strength purposes. High localized temperatures are generated at the projections, which are in contact with the flat mating parts. The electrodes made of copper- based alloys and water cooled to keep their temperature low are large and flat. Weld nuggets similar to those in spot welding are formed as the electrodes exert pressure to compress the projections
Projection Welding
Projection welding is a resistance welding process wherein coalescence is produced by the heat obtained from resistance to electric flow through the work parts held together under pressure by predetermined points by projections, embossments or intersections [2].
Principle of operation
Spot welding equipment can be used for resistance projection welding by modifying the electrodes. Although the embossing of the work pieces adds expense, this process produces a number of welds in one pass, extends electrode life, and is capable of welding metals of different thicknesses.
LITERATURE REVIEW
12
contact area change due to projection collapse plays a critical role in the nugget formation process in projection welding. If the electrode force is too low or an excessive welding current is used, melting occurs faster than the projection collapse and expulsion would occur as a result. On the other hand, if the applied electrode force is too high, premature collapse of the projection would cause the contact area to be too large and, therefore, reduce the current density on the faying interface and delay nugget formation. In other words, there needs to be a dynamic balance of the projection collapse and heat generation.
Matsushita Muneo :developed new generation resistance spot welding technologies to reduce the weight of auto body. By varying the force and welding current during welding. Intelligent Spotwelding made it possible to perform easier three-sheet-lap-welding more frequently performed with increased application of high strength steels. Pulse Spotwelding, which utilizes high current conduction with short periods as a post-weld heating treatment, increased the weld joint strength of high strength steels without extending welding time. The single-side spot welding which controls the electrode force and welding current during welding realized high applicability to closed-sectional structures by the stable nugget formation only with single-side electrode access.
METHODOLOGY
1. Study of Existing Projection Welding Processes 2. Selection of Process Parameter and Their Range 3. Determination of Causes of Failure of Welded Joints 4. Analysis of Data Using Fmea and Causes & Effect Diagram 5. Design of Experiment Using Taguchi Method
6. Optimizations of Selected Process Parameters 7. Result and Analysis
The steps followed for finding the solution to the problem were:
(i) Study of projection welding process was carried out for observing the techniques and processes being used for production of the impeller.
(ii) The process parameters as well their values being implemented for the production of impeller by projection welding was noted:
Current - ranging from 190 kA to 210 kA (in a step of 10 kA).
Electrode force - ranging from 4.5 bars to 4.6 bars (in a step of 0.1 bars).
Weld time - ranging from 900 milliseconds to 1100 milliseconds (in step of 100milliseconds). (iii) Hold time - ranging from 600 milliseconds to 800 milliseconds (in step of 100 milliseconds). (iv) Data related to causes of failure of projection welded joints were collected.
(v) Analysis of collected data was done by applying cause and effect diagram as well as failure mode effect analysis (FMEA) for determining the causes of projection welded joints failure.
(vi) Design of experiment was done by applying Taguchi method to determine the optimum process parameters for projection welding.
(vii) Optimization of selected process parameters was done by experimentation.
(viii) The optimized projection welding parameters were implemented for the production of multistage pump impellers.
(ix) The data was collected for its validation and checking the improvement obtained.
Experimental Design Using Taguchi’s L18 Orthogonal Array
EXPT. NO. ELECTRODE FORCE (Bar)
WELDING CURRENT (kA)
WELDING TIME (Milliseconds)
HOLD TIME (Milliseconds)
1. 3 4.5 190 900 600
2. 4.5 190 1000 700
3. 4.5 190 1100 800
4. 4.5 190 900 600
13
6.
4.5 200 1100 800
7.
4.5 210 900 700
8.
4.5 210 1000 800
9.
4.5 210 1100 600
10.
4.6 190 900 800
11.
4.6 190 1000 600
12.
4.6 190 1100 700
13.
4.6 200 900 700
14.
4.6 200 1000 800
15.
4.6 200 1100 600
16.
4.6 210 900 800
17.
4.6 210 1000 600
18.
4.6 210 1100 700
RESULTS AND DISCUSSION
This chapter discusses the results obtained during experimentation and observations of production of multistage mineral water pump impeller from a 0.5 mm thick stainless steel sheets. It also discusses about the application of cause and effect diagram and FMEA for finding the causes of failure of the pump impeller. Taguchi’s method and Minitab17 software were applied for obtaining optimum process parameters. At the end performance analysis of these parameters was done.
Production of Pump Impeller
Production of multistage pump impeller by capacitor discharge projection welding machine involves various steps. During the test run, it was observed that most of the pump impeller failure takes place due to weak strength of welded joints. The average wastage was 4.92%, which was major problem for the company. The company also specifies that multistage pump impeller manufactured by them meets the performance characteristics, shear tensile strength 20–25 kg/cm2.
Analysis of Causes of Failure
The different failure analysis methods or techniques that were used are as under:-
(i) Ishikawa diagram, also known as fishbone diagram or cause and effect diagram. (ii) Failure mode effect analysis (FMEA)
14 Rejection due to power failure
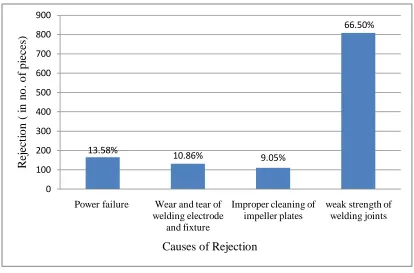
It was observed that average 165 impellers rejected every month due to power failure which is 13.58% of total rejection. The rejection was reduced by making arrangement of suitable generator set. Rejection due to wear and tear of welding electrode & fixture
The rejection due to wear and tear of welding electrode & fixture was observed to be 132 impellers which are 10.86% of total rejection. It was second least rejection and reduced by periodic inspection as well as maintenance of the electrode.
Rejection due to improper cleaning of impeller plates The least rejection was caused due to improper cleaning of impeller plates was 110 impellers which is 9.05% of total rejection. It was improved by removing lubricating oil from surface of the plates. Rejection due to weak strength of the welded joints
The maximum rejection i.e. 808 impellers per months was found due to weak strength of welded joint, which is 66.50% of total rejection.. The joint failed as the pressure increases above 20 kg/cm2. The rejection was reduced by optimizing the process parameters.
Figure 1 Causes of Rejection V/S Rejection of pump Impeller
CONCLUSIONS
Based on the study and analysis of present work being carried out in M/S Flowguard . Gurgaon, the observed process parameters affecting the strength of projection welded multistage pump impellers were:
It was noticed that most of the pump impeller failure takes place due to weak strength of welded joints causing average wastage of 4.92%, which was major problem for the company.
It was also observed that least rejection i.e. 110 impellers occurred due to improper cleaning of lubricant, which is 9.05% of total rejection. While, maximum rejection i.e. 808 impellers was due to weak strength of projection welded joints, which forms 66.50% of total rejections.
13.58% 10.86%
9.05%
66.50%
0 100 200 300 400 500 600 700 800 900
Power failure Wear and tear of welding electrode
and fixture
Improper cleaning of impeller plates
weak strength of welding joints
R
ej
ec
ti
o
n
(
i
n
n
o
.
o
f
pi
ec
es
)
15
From response plot, it was concluded that shear tensile strength is minimum at an electrode force for 4.5 bars and maximum at 4.6 bars. For welding current parameter, its value is minimum at 190 kA and maximum at 210 kA. For welding time parameter, its value is minimum at 900 milliseconds and maximum at 1000 milliseconds and for hold time parameter, minimum at 600 milliseconds and maximum at 700 milliseconds.
Risk priority number (RPN) was calculated before (448) and after (392) the implementation of optimized parameters which showed improvement and hence overall decrease in rejection rate.
All the control parameters were found to affect the process mean and variability in shear tensile strength. Electrode force was found to be contributing the most i.e. 38.73% in variation of shear tensile strength followed by welding current which was contributing 23.48%. The parameter Hold time was contributing 17.42% in variation of shear tensile strength. Welding time was affecting least, being 13.01% of total variation of process.
Validation experiments were conducted by taking optimum parameters i.e. Electrode force 4.6Bar, Welding current 210kA, Welding time 1000 millisecond and Hold time 700 milliseconds and the value of average shear strength was 22.7 kg/cm2. The signal to noise ratio was 26.512 db which is well within the confidence interval range of validation experiments and thus the selected optimum parameters were validated and used for further experimentation.
The rejection rate of multistage pump impeller has been lowered down from 4.92% to 3.43%. After the confirmation experiments, the company was able to increase its production by 1.49% and also, able to save Rs. 73,000/- per month.
REFERENCES
[1]. SeropeKalpakjian and Steven R. Schmid, “Manufacturing Engineering and Technology”, Edition (2009), pp. 909-910. [2]. O.P.Khanna and M. Lal “Production Technology”, Edition (1998), pp. 84-86.
[3]. X. SUN, “Modeling of projection welding processes using coupled finite element analyses”, Welding Research Supplement, (2000), pp. 244-s to 251-s.
[4]. MatsushitaMuneo, Taniguchi Koichi, and OI Kenji, “Development of Next Generation Resistance Spot Welding Technologies Contributing to Auto Body Weight Reduction” Japanese steel engineering technical report no.30 (2012), pp. 32-37.
[5]. A. Subrammanian and D.B. Jabaraj, “Research on Resistance Spot Welding of Stainless Steel - An Overview”, International Journal of Scientific and Engineering Research, 4(2013), p.p. 1741-1750.
[6]. AravinthanArumugam and Abdul A. Baharuddin, “Effect of force control during spot welding on weld properties” International Journal of Scientific and Research Publications, 4(2014), pp. 1-6.
[7]. NachimaniCharde, Rajprasaad and Rajkumar, “Investigating spot weld growth on 304 austenitic stainless steel (2 mm) sheets”, Journal of Engineering Science and Technology, Vol. 8, No. 1 (2013), pp. 69-76.
[8]. H. Zhigang , I.S. Kim , J.S. Son , H.H. Kim , J.H. Seo , K.C. Jang , D.K. Lee and J.M. Kuk, “A study on numerical analysis of the resistance spot welding process”, Journal of Achievements in Materials and Manufacturing Engineering, vol 14 issue 1-2, (2006), pp. 140-145.
[9]. X. SUN, “Effect of Projection Height on Projection Collapse and Nugget Formation - A Finite Element Study”, Welding Research Supplement, (2001), 211-s to 216-s.
[10]. ValdirFurlanetto, Danilo Stocco, Gilmar F. Batalha, and Fernando R. Szabados, “Inspection of projection welded automotive nuts through B-scan ultrasonic acoustic imaging”, 18th World Conference on Nondestructive Testing, (2012).