Open Access
Research article
Generation of a genomic tiling array of the human Major
Histocompatibility Complex (MHC) and its application for DNA
methylation analysis
Eleni M Tomazou
1, Vardhman K Rakyan
2, Gregory Lefebvre
1,
Robert Andrews
1, Peter Ellis
1, David K Jackson
1, Cordelia Langford
1,
Matthew D Francis
1, Liselotte Bäckdahl
4, Marcos Miretti
1, Penny Coggill
1,
Diego Ottaviani
2,5, Denise Sheer
2, Adele Murrell
3and Stephan Beck*
4Address: 1The Wellcome Trust Sanger Institute, Genome Campus, Hinxton, Cambridge, CB10 1SA, UK, 2Institute of Cell and Molecular Science, Barts and The London School of Medicine and Dentistry, 4 Newark Street, London, E1 2AT, UK, 3Cancer Research UK Cambridge Research Institute, Li Ka Shing Centre, Robinson Way, Cambridge, CB2 0RE, UK, 4UCL Cancer Institute, University College London, 72 Huntley Street, London, WC1E 6BT, UK and 5Cancer Research UK London Research Institute, Lincoln's Inn Fields, London, WC2A 3PX, UK
Email: Eleni M Tomazou - [email protected]; Vardhman K Rakyan - [email protected]; Gregory Lefebvre - [email protected];
Robert Andrews - [email protected]; Peter Ellis - [email protected]; David K Jackson - [email protected]; Cordelia Langford - [email protected]; Matthew D Francis - [email protected]; Liselotte Bäckdahl - [email protected]; Marcos Miretti - [email protected];
Penny Coggill - [email protected]; Diego Ottaviani - [email protected]; Denise Sheer - [email protected]; Adele Murrell - [email protected]; Stephan Beck* - [email protected]
* Corresponding author
Abstract
Background: The major histocompatibility complex (MHC) is essential for human immunity and is highly associated with common diseases, including cancer. While the genetics of the MHC has been studied intensively for many decades, very little is known about the epigenetics of this most polymorphic and disease-associated region of the genome.
Methods: To facilitate comprehensive epigenetic analyses of this region, we have generated a genomic tiling array of 2 Kb resolution covering the entire 4 Mb MHC region. The array has been designed to be compatible with chromatin immunoprecipitation (ChIP), methylated DNA immunoprecipitation (MeDIP), array comparative genomic hybridization (aCGH) and expression profiling, including of non-coding RNAs. The array comprises 7832 features, consisting of two replicates of both forward and reverse strands of MHC amplicons and appropriate controls.
Results: Using MeDIP, we demonstrate the application of the MHC array for DNA methylation profiling and the identification of tissue-specific differentially methylated regions (tDMRs). Based on the analysis of two tissues and two cell types, we identified 90 tDMRs within the MHC and describe their characterisation.
Conclusion: A tiling array covering the MHC region was developed and validated. Its successful application for DNA methylation profiling indicates that this array represents a useful tool for molecular analyses of the MHC in the context of medical genomics.
Published: 30 May 2008
BMC Medical Genomics 2008, 1:19 doi:10.1186/1755-8794-1-19
Received: 12 February 2008 Accepted: 30 May 2008
This article is available from: http://www.biomedcentral.com/1755-8794/1/19
© 2008 Tomazou et al; licensee BioMed Central Ltd.
Background
The major histocompatibility complex (MHC) is a 4 Mb region on the short arm of human chromosome 6 [1]. It is one of the most gene-dense regions of the human genome and it is associated with many complex diseases including infectious, autoimmune and inflammatory dis-eases as well as cancer. In many cases, their aetiologies are polygenic and involve genetic, epigenetic and environ-mental factors. Although past studies have generated extensive data for the genetics of the MHC resulting in important contributions to medicine [2-4] further studies are necessary to improve our understanding of the causes of such diseases. Because of its central role in so many complex diseases, elucidating the epigenetic code of the MHC can be expected to be highly beneficial for biomed-ical research.
Epigenetics is a term used to describe mitotically and, in some cases, meiotically heritable states of gene expression that are not due to changes in the DNA sequence [5]. The best-studied epigenetic marks are DNA methylation and histone modifications. The latter are post-translational modifications and occur at specific positions within the amino-terminus of histone tails. They include acetylation, methylation, phosphorylation, ubiquitination and other modifications and are correlated with chromatin accessi-bility and transcriptional activity or repression [6,7]. DNA methylation on the other hand involves the addition (or removal) of methyl groups at the carbon-5-position of cytosine. In mammals this occurs predominantly in the context of cytidine-guanosine (CpG) dinucleotides [8], but non-CpG methylation has also been reported in cer-tain cell types and is common in plants [9-11]. In mam-malian somatic cells, about 70% of CpGs are methylated (hypermethylated) and these sites predominantly occur in repetitive DNA elements, satellite DNAs, non-repetitive intergenic DNA and exons [8]. In contrast, the CpGs located in the estimated 29,000 CpG islands, found span-ning the promoters and 5'-untranslated regions (5'-UTRs) of about 60% of human genes are largely unmethylated (hypomethylated) [8]. DNA methylation can regulate transcription either directly by interfering with transcrip-tion factor binding or indirectly via methyl binding domain (MBD) containing proteins resulting in changes in chromatin architecture [12,13]. Recently, non-coding RNAs (ncRNAs) have been recognised as an additional component associated with epigenetic modulation and have been reported to be involved in X-chromosome inac-tivation, chromatin structure, DNA imprinting and DNA demethylation [14].
Emerging evidence suggests that epigenetic events are associated with the regulation of MHC gene expression. It has been shown, for instance, that the MHC class II trans-activator (CIITA) and the regulatory factor X (RFX)
pro-teins serve as focal points for recruiting histone modifying enzymes to MHC class II promoters, whereby CIITA itself is regulated by DNA methylation, histone modifications and ncRNAs [15,16]. Treatment of melanoma and esophageal cell lines with the DNA methylation inhibitor 5-aza-2-deoxycytidine led to restoration of MHC class I expression (which is suppressed in these cell lines), impli-cating DNA methylation in expression of MHC class I genes [17-19].
As part of the Human Epigenome Project (HEP), about 2.5% of the MHC region has been analysed for DNA methylation [20]. This study has demonstrated that a sig-nificant proportion (10%) of the MHC loci analysed show tissue-specific DNA methylation profiles. Such regions have been termed tissue-specific differentially methylated regions (tDMRs) and are thought to contain elements involved in tissue-specific gene expression [21].
To facilitate a more comprehensive epigenetic analysis of the MHC, we have constructed a tiling array that covers the entire 4 Mb of the MHC at 2 kb resolution. This array is an economical alternative to commercial arrays and can be used for: i) ChIP-on-chip studies, investigating DNA/ protein interactions [22]; ii) DNA methylation studies, investigating tissue- or disease-specific DNA methylation profiles [23,24]; iii) array comparative genomic hybridi-zation (aCGH), investigating copy number variations (CNVs) [25,26]; and finally, for expression studies, inves-tigating both coding and non-coding RNAs.
Here we describe the generation and properties of an array for the human MHC and we show how it can be used for DNA methylation studies, particularly for the identifica-tion of DMRs.
Methods
Design, generation and quality control of the MHC tiling array
attach-ment regions of the β-globin gene cluster [30]; v) loop-associated DNA of the PRM2 gene [30]; vi) promoter regions of the GAPDH and IRF1 genes; vii) replication ori-gin of the LB2 gene; vii) replication oriori-gin-lacking region of the β-globin locus; and viii) DNAase I-hypersensitivity sites of the β-globin locus control region. Ten genes from the Arabidopsis genome (spotted in replicates, distributed across the array) that can be used to assign DNA barcodes as internal controls were also included. In addition, 192 Cy3 spots were printed on each array that can be used for calibration and orientation. Except for the Cy3 spots, none of other controls were used for the analysis described here but may be useful for other types of analy-ses. MHC probe coordinates and primer sets used for the generation of gap-spanning and control clones can be provided upon request.
Double-stranded amino-linked amplicons were generated from each clone using vector-specific PCR in 50 mM KCl, 5 mM Tris pH 8.5 and 2.5 mM MgCl2 (10 min at 95°C; followed by 35 cycles of 95°C for 1 min, 60°C for 1.5 min, 72°C for 7 min; and a final extension of 72°C for 10 min – Forward primer 5'-CCCAGTCACGACGTTG-TAAAACG-3', Reverse primer 5'-AGCGGATAACAATT-TCACACAGG-3'). In order to generate strand-specific array probes, two separate PCR reactions were performed for each clone, in one case using a 5'-aminolinked primer for the forward strand, and in the other case, for the reverse strand. After quality assessment of the products by gel electrophoresis, spotting buffer was added directly to a final concentration of 250 mM sodium phosphate pH 8.5, 0.00025% w/v sarkosyl, 0.1% sodium azide, and the products were filtered (Multiscreen-GV filter plates, Milli-pore). Arrays were spotted onto amine binding slides (CodeLink, GE Healthcare) at 20–25°C, 40–50% relative humidity. After an overnight incubation in a humid chamber, the slides were blocked (1% ammonium hydroxide for 5 min, followed by 0.1% SDS for 5 min) and denatured (95°C ddH2O for 2 min), rinsed in ddH2O and dried by centrifugation for 5 min at 250 × g. Thus, the
covalently attached strand-specific probes were rendered single-stranded in preparation for hybridization.
The final array therefore comprises 7832 features (2 × 1747 MHC forward probes, 2 × 1747 MHC reverse probes, 4 × 43 human control probes, 480 Arabidopsis control probes and 192 Cy3 dye controls). Resequencing of 240 probes (15% of total) identified 7 probes that failed to match to the expected reference sequences. Aliq-uots of all probes can be made available upon request for further QC analysis. From this partial analysis, we extrap-olate that about 97% of the probes are correct and should be informative.
DNA samples
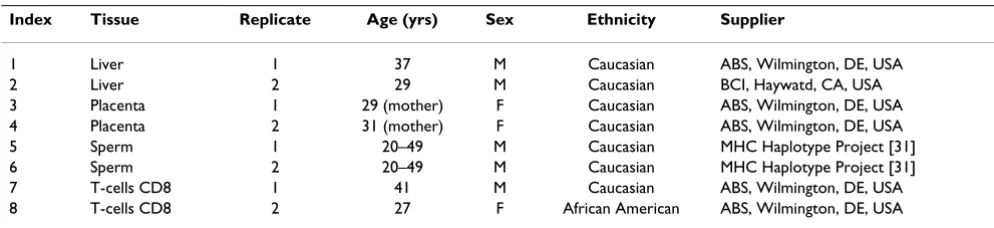
Human DNA samples from healthy individuals were obtained from AMS Biotechnology (Oxon, UK), Analyti-cal BiologiAnalyti-cal Services (Wilmington DE, USA) and from the MHC Haplotype Project [31]. Samples included DNA extracted from two tissues (liver and placenta) and 2 cell types (CD8+ lymphocytes and sperm). Additional infor-mation on those samples is summarized in Table 1.
Methylated DNA immunoprecipitation (MeDIP)
MeDIP was performed as described by Weber and col-leagues [23] with the following modifications. DNA sam-ples (2.5 μg) were sheared into fragments of average size of 600 bp using a sonicator (Virtis). Fragmented DNA was incubated with 1 × buffer 2 (New England Biolabs, UK), 10 × BSA (NEB, U.K.), 1.2 μl dNTP mix (10 mM each) (Abgene, UK), 3 Units of T4 DNA polymerase (New Eng-land Biolabs, U.K.) and distilled water to a final volume of 120 μl for 20 minutes at 12°C. The reaction was cleaned up using a Zymo-5 kit (Genetix, U.K.) according to the manufacturer's instructions but the final elution was done in 30 μl of TE buffer (10 mM Tris-HCl pH 8.5, 1 mM EDTA). The adaptors JW102 (5'-gcggtgacccgggagatct-gaattc-3') and JW103 (5'-gaattcagatc-3') were ligated to the cleaned-up DNA by incubation overnight at 16°C in a reaction containing 40 μl adaptor mix (50 μM), 6 μl T4 DNA ligase 10 × buffer (NEB, UK), 5 μl T4 DNA ligase
Table 1: Tissues and cell types used in this study
Index Tissue Replicate Age (yrs) Sex Ethnicity Supplier
1 Liver 1 37 M Caucasian ABS, Wilmington, DE, USA
2 Liver 2 29 M Caucasian BCI, Haywatd, CA, USA
3 Placenta 1 29 (mother) F Caucasian ABS, Wilmington, DE, USA
4 Placenta 2 31 (mother) F Caucasian ABS, Wilmington, DE, USA
5 Sperm 1 20–49 M Caucasian MHC Haplotype Project [31]
6 Sperm 2 20–49 M Caucasian MHC Haplotype Project [31]
7 T-cells CD8 1 41 M Caucasian ABS, Wilmington, DE, USA
8 T-cells CD8 2 27 F African American ABS, Wilmington, DE, USA
(400 U/μl) (NEB, U.K.) and distilled water to a final vol-ume of 100 μl. DNA was cleaned up as described above. To fill in the overhangs, the sample DNA was incubated at 72°C for 10 minutes with 1 μl dNTP mix (10 mM each), 5 μl 10 × AmpliTaq Gold PCR buffer (Applied Biosystems – Roche), 3 μl MgCl2 (250 mM), 5 U AmpliTaq Polymer-ase and distilled water to a final volume of 50 μl. DNA was cleaned up as described above. 50 ng of the ligated DNA sample was set aside as the input fraction. 1.2 μg of the ligated DNA sample was denatured for 10 minutes at 100°C and then placed on ice for 5 minutes. Immunopre-cipitation was performed in 1 × IP buffer (20 mM sodium phosphate pH 7, 280 mM NaCl, 0.1% Triton X-100) and 3 μl of 5-MeC-mAb (Eurogentec) with incubation at 4°C with slow rotation for 2 hours. 10 μl Dynabeads (M-280 Sheep anti-Mouse IgG – 6.7 × 10⁸ beads/ml) (Dynal Bio-tech) were washed in 1 × IP buffer according to the man-ufacturer's instructions and added to the DNA-antibody mixture and then incubated at 4°C with slow rotation for 2 hours. The Dynabead-Ab-DNA mixture was washed three times with 500 μl IP buffer and finally resuspended in 100 μl of proteinase K buffer (10 mM Tris-HCl pH 7.8, 5 mM EDTA, 0.5% SDS). 1 μl of proteinase K (50 U/ml) (Roche Diagnostics) was added and incubated at 50°C for 2 hours with rotation. The sample was cleaned up using a Zymo kit-5 (using 700 μl binding buffer). The DNA con-centration was determined with a NanoDrop (using 1 OD260 = 33 μg) and diluted to 1 ng/μl. Two separate amplifications were performed for the respective IP and input fractions using ligation-mediated PCR (LM-PCR) [32]. LM-PCR was performed in a final volume of 50 μl containing 10 μl distilled water, 10 μl Advantage-GC buffer (BD Biosciences), 10 μl GC-melt (BD Biosciences), 3.1 μl 25 mM Mg(OAc)2, 5 μl JW-102 primer (10 μM), 1.4
μl dNTPs (10 mM each), 1 μl Advantage-GC polymerase (BD Biosciences) and 10 μl DNA (1 ng/μl). Reaction con-ditions were as follows: 1 cycle at 95°C for 2 minutes for initial denaturation, 20 cycles at 94°C for 30 seconds, 68°C for 3 minutes and 1 cycle at 68°C for 10 minutes. After LM-PCR, the reactions were cleaned up using a QIAquick PCR Purification kit (Qiagen) and eluted with 50 μl of water (pre-heated to 50°C).
Real-time PCR of MeDIP samples
For MeDIP validation, we performed quantitative real-time PCR (qRT-PCR), using an ABI Prism 7300 Sequence Detection System and 30 ng of input and immunoprecip-itated DNA (after LM-PCR). For each qRT-PCR reaction (total volume of 13.5 μl) we used 6.5 μl SYBR Green PCR master mix (Eurogentec) and 2.5 μl primer mix (1.5 μM each.). Reaction conditions were as follows: 1 cycle at 50°C for 2 minutes, 1 cycle at 95°C for 10 minutes, 40 cycles at 95°C for 15 seconds and 1 cycle at 60°C for 1 minute. Reactions were done in triplicates. To evaluate the
relative enrichment of target sequences after MeDIP, we normalized (for each amplicon tested) the Ct of the
MeDIP fraction to the Ct of the input (ΔCt). Subsequently
we normalised the ΔCt of each target sequence to the ΔCt
of an unmethylated control sequence (ΔΔCt). Finally, we
calculated the enrichment . Primer sequences can be provided upon request.
DNA labelling and microarray hybridization
Fluorescent labelling was performed using a modified Bioprime labelling kit (Invitrogen) in a 130.5 μl reaction containing 100 ng DNA, 15 μl dNTP mix (2 mM dATP, 2 mM dTTP, 2 mM dGTP, and 0.5 mM dCTP), and 1.5 μl Cy5/Cy3 dCTP (1 mM) (Perkin Elmer). The reactions were purified using Micro-spin G50 columns (Pharmacia-Amersham) in accordance with the manufacturer's instructions. Reference and test samples were combined and precipitated with 55 μl of 3 M sodium acetate (pH 5.2) in 2.5 volumes of ethanol with 135 μg human Cot1 DNA (Invitrogen). The DNA pellet was resuspended in hybridization buffer containing 50% deionized forma-mide, 10% dextran sulphate, 10 mM Tris-HCl (pH 7.4), 2 × SSC, 0.1% Tween-20, and 200 μg yeast tRNA (Invitro-gen). Hybridization was performed for 24 hours at 37°C on a MAUI hybridization platform. Finally, the arrays were washed serially in solution 1 (2 × SSC, 0.03% SDS) for 5 minutes at room temperature, in solution 1 for 5 minutes at 60°C, four times in solution 2 (2 × SSC) for 20 minutes at room temperature, in solution 3 (PBS, 0.05% Tween20) for 10 minutes at room temperature and finally in HPLC water for 10 minutes at room temperature. Sub-sequently the arrays were dried and scanned using a ScanArray Express HT scanner (PerkinElmer).
Microarray data analysis
For each sample we analysed two biological replicates. All hybridizations were performed with fluorochrome-reversed pairs of two-colour labelled probes (dye swaps). For the purpose of this analysis we treated the forward and reverse probes as replicates. Hence, for each sample tested, we obtained 16 measurements derived from quadrupli-cate spots on 4 array hybridizations (two biological repli-cates plus dye swaps). Fluorescence intensities were determined using the ScanArray Express software (Perk-inElemer). Fusion of dye-swap and biological replicate results and subsequent analyses were performed using Bioconductor [33]. For each probe, log-ratios were nor-malised within arrays using a Local Linear Regression (loess) [34] whereas average intensities were normalised between arrays [35] leaving previously normalised ratios unchanged. Dye-swapped samples and biological repli-cates were defined in a design matrix. Subsequent analyses were performed according to the design matrix by fitting a
linear model to log-ratios. The fit is by generalized least squares, allowing for correlation between the four dupli-cated spots [36]. Finally ranking the features according to their evidence of discrepancy between effects defined in the design matrix has been performed by using empirical Bayes method [37]. The array data described here have been deposited in ArrayExpress under accession numbers E-TABM-471 (experiment) and A-MEXP-1163 (array design).
tDMR feature analysis
The Application Programme Interfaces (API) was used to extract genomic features associated with tDMR coordi-nates from the Ensembl functional genomics dataset (NCBI36). The whole of chromosome 6 was scanned using a 2 kb window and 1 kb steps (i.e. moving the win-dow from the start to the end of the chromosome, shifting each time by 1 kb). For each window, the number of each type of feature within the bounds of the window was counted. This way, a discrete probability distribution was generated, which determines, for a randomly selected window, how likely it would be to have a certain number of features. Windows that overlapped a gap in the assem-bly were ignored to avoid biasing the result. For each DMR and for each type of feature, the number of features that were found and their probability distribution were used to calculate (using 95% confidence interval) if the DMR was enriched for that feature.
Bisulphite sequencing
Genomic DNA was subjected to sodium bisulphite con-version using the EZ DNA methylation Kit (Genetix, U.K.) according to the manufacturer's instructions. Primer design, bisulphite-PCR and sequencing were carried out as described by Rakyan et al., 2004 [20]. Primer sequences can be provided upon request. Absolute DNA methyla-tion values were estimated from signal ratios of the corre-sponding sequence traces using the ESME software [38].
Results
MHC tiling array
In order to facilitate analyses of the regulation and func-tion of genes and control elements within the MHC region on chromosome 6, we constructed a tiling array that encompasses the almost (99.67%) complete 4 Mb region at 2 kb resolution. As described in the Methods sec-tion, the array entails a total of 7832 features (7640 probes and 192 Cy3 control spots) of which 97% are esti-mated to be informative following the quality control described under Methods. The array can be requested from the Microarray Facility at the Wellcome Trust Sanger Institute [39].
Generation of DNA methylation profiles
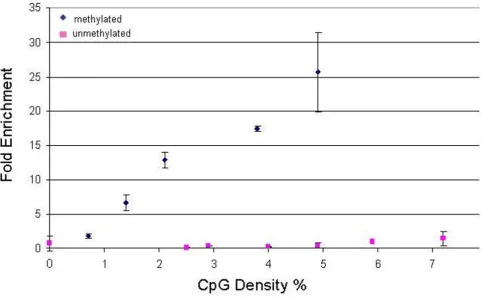
To demonstrate the utility of the MHC tiling array, we first generated comprehensive DNA methylation profiles in conjunction with the Methylated DNA Immunoprecipita-tion (MeDIP) assay [23]. Using an antibody that specifi-cally recognises 5-methylcytosine, we immunoprecipitated the methylated fraction of sheared genomic DNA from two tissues (liver and placenta) and two cell types (CD8+ lymphocytes and sperm). MeDIP and input fractions were amplified by ligation-mediated PCR (LM-PCR) [32]. We validated MeDIP by performing qRT-PCR (see Methods) to test the enrichment of regions with varying CpG densities for which the methylation sta-tus was known from the Human Epigenome Project [20,40]. Figure 1 shows that following MeDIP, methylated regions are enriched approximately proportionally to their CpG densities and no significant enrichment irre-spective of CpG density is observed for unmethylated regions. Using a threshold of ≥5-fold enrichment, the MeDIP assay is therefore sensitive for regions of ≥1% CpG density.
Using this threshold (actual enrichment range was 5–80 fold), we generated DNA methylation profiles of the entire MHC for CD8+ lymphocytes, sperm, liver and pla-centa (Figure 2). Control hybridizations assessing biolog-ical replicates (R2 > 0.97), dye-swaps (R2 > 0.72) and LM-PCR (R2 > 0.88) showed that any bias introduced by these factors was within an acceptable range (Additional File 1). At this (megabase) resolution, three main observations can be made: (i) The overall profiles correlate significantly (0.83 < R2 < 0.93), suggesting few or no large-scale (>100 Kb) differences in DNA methylation, except perhaps in liver, where some regions appear to be lower in methyla-tion than in other tissues. (ii) As expected from the result shown in Figure 1 (although CpG density was analysed here), the profiles correlate very well with C+G content, clearly demarcating the boundaries of the MHC class I, III, II and extended class II regions. (iii) The profiles further show the vast improvement in coverage compared to the 253 amplicons, analysed as part of the Human Epige-nome Project [20].
(Fig-ure 3b). For that, we compared the probe intensities of the Cy5 channel for two hybridizations, one with and the other without Cot1 DNA. In the presence of Cot1 DNA, the intensities of repeat-containing probes are clearly reduced to the same level detected for repeat-free probes, indicating that undesired repeat signals can be blocked and that the unique parts of repeat-containing probes remain to be informative and can be kept for further anal-ysis.
Identification and characterisation of tDMRs
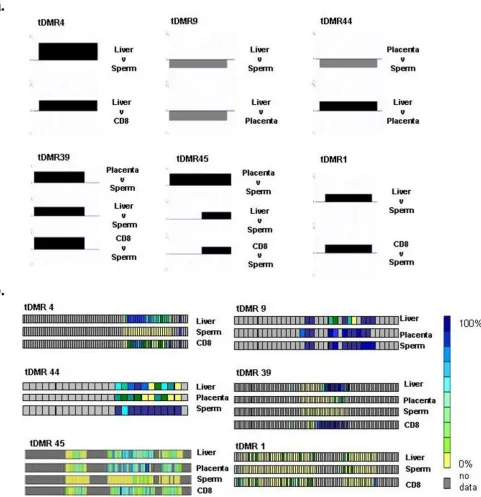
For the identification of tDMRs, we performed pair-wise comparisons (six in total: CD8+ lymphocytes versus pla-centa, liver versus plapla-centa, placenta versus sperm, CD8+ lymphocytes versus sperm, liver versus sperm, and liver versus CD8+ lymphocytes) of the array-derived DNA methylation profiles. At 2 kb, the probe resolution was not high enough to determine if more than one tDMR was contained within a probe or if positive, adjoining probes were part of the same tDMR. Therefore, each differentially
methylated probe was considered to be a separate tDMR. According to this definition, we identified a total of 90 tDMRs of which 35 were present in more than one com-parison (Figure 4; Additional File 2). For validation, we randomly selected six tDMRs (irrespective of their genomic functionality) and subjected them to independ-ent methylation analysis using bisulphite DNA sequenc-ing. Figure 5 shows their methylation status based on comparison of their respective MeDIP array profiles (a) and their absolute methylation values based on bisulphite sequencing (b). The characteristics of these tDMRs are shown in Table 2. In all six cases, the bisulphite sequenc-ing results were consistent with the array data, indicatsequenc-ing that that the array is suitable for the identification of tDMRs.
According to the pair-wise analyses, sperm is most fre-quently differentially methylated which agrees with the findings of the Human Epigenome Project [40]. The majority of tDMRs identified in sperm are hypomethyl-Correlation between enrichment after MeDIP and CpG density
Figure 1
ated compared to the other samples (65% of tDMRs in placenta-sperm comparison; 93% of tDMRs in CD8-sperm comparison; 32% of tDMRs in liver-CD8-sperm compar-ison). Notable exceptions are the tDMRs identified in the complement region which seem to be less methylated in
liver than any of the other samples (Figure 4; Additional File 2).
Next, we correlated the tDMRs with gene expression using data publicly available from the Genomics Institute of the DNA methylation profiles of the MHC
Figure 2
DNA methylation profiles of the MHC. For each of the four samples tested (CD8+ lymphocytes, liver, placenta, sperm),
the log2 signal ratios (MeDIP/input) were uploaded as individual tracks to the UCSC genome browser using the 'smooth'
Distribution and suppression of repeat sequences
Figure 3
Distribution and suppression of repeat sequences. a) Distribution (in 5% bins) and frequency of repeat sequences within probes on the array. b). Suppression of repeat-specific signal using Cot1 DNA. Two independent hybridizations were carried out using genomic DNA extracted from CD8+ lymphocytes. In both experiments total DNA was labelled with Cy5 dye. Only
Table 2: Genomic features of non-redundant tDMRs
chr6 coordinates (NCBI_35)
TSS CTCF H4K20 me1
PolII H3K4 me2
H3K36 me3
H3K4 me3
DnaseI H3K4 me1
CpG island
ECR H2AZ repeats % CpG %
1 29823989–29826356 x x x x x 28.63 2.94
2 30000805–30003606 x x x 12.6 9.28
*3 30228982–30231712 26.44 2.64
*4 30247370–30249040 x x x x 4.73 9.1
*5 30565890–30568365 x x x x 11.95 4.77
6 30721858–30724158 x x 5.91 10.52
7 30731648–30734384 42.71 2.27
8 30891136–30893651 95.08 5.24
9 31709197–31711626 x 79.93 5.01
*10 31803609–31806450 x x x x 0 2.88
11 31841070–31843352 x 0 11.05
12 32020686–32023216 x 18.4 5.61
13 32056738–32058031 x 6.57 3.935
*14 32067481–32068550 0 3.09
*15 32071709–32072864 0 5.61
16 32073608–32074514 0 5.02
17 32074474–32074660 13.67 3.97
*18 32077678–32079121 0 5.35
*19 32081199–32081780 19.53 5.4
20 32088659–32090434 0 3.685
*21 32088718–32090526 0 3.41
*22 32090749–32092076 1.96 4.22
23 32092057–32093147 0 2.38
24 32094350–32095101 100 1.33
25 32098656–32099323 100 3.59
26 32099573–32100214 0 3.875
*27 32104734–32105602 0 5.29
*28 32107212–32107398 0 5.35
29 32109195–32110435 9.995 5.6
*30 32110416–32111859 19.53 5.4
31 32115381–32116535 x 0 7.27
32 32119000–32120024 x 0 7.61
33 32223988–32226638 x x 4.19 11.09
34 32659407–32660508 x x x 9 5
35 32817677–32820582 20.44 2.96
36 32836042–32838492 9.42 7.26
37 33192620–33193912 x 32.79 6.5
*38 33372651–33375048 x x x x x x x x 10.93 8.76
39 33389687–33392295 x x x 2.3 7.51
40 29830203–29832660 6.08 7.77
41 29889483–29892066 21.2 4.15
42 29937894–29939594 38.78 2.48
43 30484481–30486798 96.59 1.04
44 30491424–30493923 1.4 2
45 30526624–30528439 x x 3.54 7.33
46 30527803–30529467 x x 3.54 6.73
47 30534798–30537070 42.42 1.26
48 30881555–30884300 98.55 4.27
49 31092038–31094660 74.72 7.51
50 31270669–31273172 x x 4.59 2.75
51 31454436–31456982 8.59 5.84
*52 32590480–32591619 44.47 2.11
53 32622631–32625110 91.09 5.97
54 33132309–33134479 x 24.37 1.01
55 33450625–33452501 84.66 2.88
Novartis Research Foundation Gene Expression Atlas database [41]. This database contains whole-genome mRNA expression data obtained using human U95A Affymetrix microarray chips [42] and mRNA extracted from a number of tissues, including liver, placenta and CD8+ lymphocytes (sperm was not included in this data-base). We identified 7 probes on the U95A Affymetrix array that overlap with tDMRs identified in our liver ver-sus placenta, liver verver-sus CD8+ lymphocytes and CD8+lymphocytes versus placenta comparisons. Genomic
features of these tDMRs are shown in Table 2 (see below). One of the probes (Affymetrix ID 40766_at that corre-sponds to C4A and C4B transcripts) shows a high inverse correlation between expression and methylation at these loci (Figure 6). Both loci are highly expressed and hypomethylated in liver.
35 out of the 90 identified tDMRs were observed in more than one comparison. Hence there are 55 loci (average size 2 kb) within the MHC region that according to this tDMRs within the MHC region
Figure 4
tDMR validation
Figure 5
Example of tDMRs correlating with tissue-specific gene expression
Figure 6
Example of tDMRs correlating with tissue-specific gene expression. a) tDMRs within the region encoding the C4A and C4B genes. Vertical axis shows the log2 ratio of the two corresponding methylation profiles. Grey lines indicate regions
study shows tissue-specific methylation levels. We define these 55 loci as redundant tDMRs (to reflect the non-redundancy at the sequence level) and show their genomic locations in Figure 7 and Table 2. The high den-sity of 18 non-redundant tDMRs within the C4 comple-ment region is clearly visible. To characterize their potential functionality, the 55 non-redundant tDMRs were analyzed for a number of genomic features using the ENSEMBL functional build [43]. The result of this analysis is summarized in Table 2. We found the majority (39) of these tDMRs to map to intragenic regions and the minor-ity (16) to map to intergenic regions. While repetitive ele-ments were overrepresented within the intergenic tDMRs (44%), DNAse I sites and evolutionary conserved ele-ments (ECRs) were overrepresented within the intragenic tDMRs (15%). Furthermore, only 2% of the tDMRs con-tained transcription start sites (TSS) and about 7% CpG islands and RNA polymerase II binding sites. In all, 21% of the tDMRs contained features significantly (P < 0.05) associated with regulation, such as CpG islands, DNase1 and RNA polII binding sites, TSSs and ECRs. Although only few other epigenetic data are yet publicly available for the MHC, we also analyzed the tDMRs for features associated with epigenetic function. Based on this analy-sis, 6 (11%) tDMRs have insulator protein (CTCF) bind-ing sites [44], 13 correlated with the transcription-activating histone marks (H3K4me2, H3K36me3, H3K4me3 and H3K4me1) and two with the transcrip-tion-silencing mark H4K20me1 [6]. Interestingly, 54% of the H3K4me3 sites overlapping with both intragenic and intergenic tDMRs appeared to be close to DNaseI sites. Finally, two tDMRs were associated with the histone vari-ant H2AZ [45].
Discussion
The array reported here is the first high-resolution (2 Kb) genomic tiling array of the entire MHC. Commercially available tiling arrays usually exclude repeat sequences and therefore cover only about 50% of the genomic sequence. Previous whole-genome tiling arrays [25] that included the MHC were constructed from P1 artificial chromosomes (PACs) and bacterial artificial chromo-somes (BACs), resulting in a resolution of approximately 100 Kb. By utilizing a public clone resource [27], our array could be generated at a fraction of the costs associated with commercial arrays, albeit at lower resolution than is achievable with these platforms. The array is compatible with standard array processing and scanning platforms and contains 7832 features of which about 97% can be expected to be informative according to our quality con-trol procedures. Upon request, the MHC array is freely available from the Microarray Facility at the Wellcome Trust Sanger Institute [39].
To demonstrate utility, we used the array for DNA meth-ylation profiling of four samples used for the HEP study: two tissues (liver and placenta), CD8+ lymphocytes and sperm. Comparison of these profiles allowed us to iden-tify 55 putative, non-redundant tDMRs (90 in total). From these, we randomly selected 10% (6 tDMRs) for val-idation by an independent method. In all cases, tDMR sta-tus could be confirmed, indicating that the array is suitable for DNA methylation analysis. While the analysis carried out here is informative with respect to differential methylation between samples, it did not allow assigning absolute DNA methylation values to each tDMR. This is not a shortcoming of the array but a limitation of the MeDIP assay which is highly dependent on CpG density as illustrated in Figure 1. Therefore, it was not possible to compare our data directly with the HEP data which, in any case, only cover about 2.5% of the MHC. The on-going development of a novel algorithm employing a Bayesian de-convolution strategy to normalize MeDIP array data for CpG density is likely to overcome this current limita-tion in the near future (T. Down et al., personal commu-nication). For the same reason as mentioned above, the limited number of samples did not allow us to analyse the data for inter-individual variation which was observed in the HEP study [20].
Finally, we correlated gene-associated tDMRs with expres-sion data of the cognate genes available from the GNF SymAtlas. We found a strong correlation within the region encoding for instance the fourth component of the human complement (C4). C4 is an essential factor of the innate immunity and consists of two isoforms (C4A and C4B) that differ only in five nucleotides [46]. C4A and C4B are examples of copy number variants (CNVs) in the human genome. We show that regions within the 5'-UTR, 3'-UTR and the gene body of C4A and C4B are less meth-ylated in liver than in sperm, placenta and CD8+ lym-phocytes. As these two genes are expressed only in liver, it is possible that DNA methylation is the underlying mech-anism controlling their expression. At this point, sensitiv-ity and specificsensitiv-ity should also be considered. While sensitivity is not an issue in this case (the experimental design normalizes for the genotype of the sample DNA), specificity is. As neither our array nor the Affymetrix U95 array can discriminate between C4A and C4B (which are more than 99% identical), it was not possible to ascertain whether or not these two loci are differentially methylated in this case. Selective hypermethylation is a known mech-anism for silencing of duplicated genes [47].
Conclusion
Non-redundant tDMRs within the MHC region
Figure 7
our experience, we expect the array to be suitable for a number of assays (e.g. aCGH, ChIP-chip and expression analysis) relevant to medical genomics and are currently in the process of applying it to investigate the down-regu-lation of HLA class I molecules, a phenotype commonly associated with cancer [48].
Competing interests
The authors declare that they have no competing interests.
Authors' contributions
EMT, AM and SB conceived the study. EMT carried out the experiments. VKR, CL, LB, MM, PCC, DO and DS contrib-uted materials. EMT, VKR, GL, RA, PE, DKJ, MDF and SB contributed to the analysis. EMT and SB wrote the script. All authors read and approved the final manu-script.
Additional material
Acknowledgements
We would like to thank Barbara Gorick and the Clone Resources Group at the Wellcome Trust Sanger Institute for provision of clones, Marc Smith and Nick Matthews for their contributions to the construction and valida-tion of the array, Nancy Holroyd, Rob Davies and the Sequencing Service at the Wellcome Trust Sanger Institute for sequencing support and Stephen Rice for bioinformatics support. EMT was supported by a PhD Fellowship from the Wellcome Trust Sanger Institute. VKR was supported by a C.J. Martin Fellowship from the NHMRC, Australia. DO was supported by Can-cer Research UK London Research Institute, DS by CanCan-cer Research UK Programme (Grant C5321/A8318) and AM was supported by Cancer Research UK. GL, RA, PE, CL, LB, MM, DKJ, MDF, PCC and SB were sup-ported by the Wellcome Trust.
References
1. Horton R, Wilming L, Rand V, Lovering RC, Bruford EA, Khodiyar VK, Lush MJ, Povey S, Talbot CC Jr, Wright MW, et al.: Gene map of the extended human MHC. Nat Rev Genet 2004,
5(12):889-899.
2. de Bakker PI, McVean G, Sabeti PC, Miretti MM, Green T, Marchini J, Ke X, Monsuur AJ, Whittaker P, Delgado M, et al.: A high-resolu-tion HLA and SNP haplotype map for disease associahigh-resolu-tion studies in the extended human MHC. Nat Genet 2006,
38(10):1166-1172.
3. Rioux JD, Abbas AK: Paths to understanding the genetic basis of autoimmune disease. Nature 2005, 435(7042):584-589. 4. Vyse TJ, Todd JA: Genetic analysis of autoimmune disease. Cell
1996, 85(3):311-318.
5. Allis CD, Jenuwein T, Reinberg D: Epigenetics. Cold Spring Harbor, N.Y.: Cold Spring Harbor Laboratory Press; 2007.
6. Kouzarides T: Chromatin modifications and their function.
Cell 2007, 128(4):693-705.
7. Berger SL: The complex language of chromatin regulation during transcription. Nature 2007, 447(7143):407-412. 8. Bird A: DNA methylation patterns and epigenetic memory.
Genes Dev 2002, 16(1):6-21.
9. Grandjean V, Yaman R, Cuzin F, Rassoulzadegan M: Inheritance of an Epigenetic Mark: The CpG DNA Methyltransferase 1 Is Required for De Novo Establishment of a Complex Pattern of Non-CpG Methylation. PLoS ONE 2007, 2(11):e1136. 10. Ramsahoye BH, Biniszkiewicz D, Lyko F, Clark V, Bird AP, Jaenisch R:
Non-CpG methylation is prevalent in embryonic stem cells and may be mediated by DNA methyltransferase 3a. Proc Natl Acad Sci USA 2000, 97(10):5237-5242.
11. Finnegan EJ, Kovac KA: Plant DNA methyltransferases. Plant Mol Biol 2000, 43(2–3):189-201.
12. Klose RJ, Bird AP: Genomic DNA methylation: the mark and its mediators. Trends Biochem Sci 2006, 31(2):89-97.
13. Wade PA: Methyl CpG-binding proteins and transcriptional repression. Bioessays 2001, 23(12):1131-1137.
14. Costa FF: Non-coding RNAs: new players in eukaryotic biol-ogy. Gene 2005, 357(2):83-94.
15. Wright KL, Ting JP: Epigenetic regulation of MHC-II and CIITA genes. Trends Immunol 2006, 27(9):405-412.
16. Zika E, Ting JP: Epigenetic control of MHC-II: interplay between CIITA and histone-modifying enzymes. Curr Opin Immunol 2005, 17(1):58-64.
17. Serrano A, Tanzarella S, Lionello I, Mendez R, Traversari C, Ruiz-Cabello F, Garrido F: Rexpression of HLA class I antigens and restoration of antigen-specific CTL response in melanoma cells following 5-aza-2'-deoxycytidine treatment. Int J Cancer
2001, 94(2):243-251.
18. Maio M, Coral S, Fratta E, Altomonte M, Sigalotti L: Epigenetic tar-gets for immune intervention in human malignancies. Onco-gene 2003, 22(42):6484-6488.
19. Nie Y, Yang G, Song Y, Zhao X, So C, Liao J, Wang LD, Yang CS:
DNA hypermethylation is a mechanism for loss of expres-sion of the HLA class I genes in human esophageal squamous cell carcinomas. Carcinogenesis 2001, 22(10):1615-1623. 20. Rakyan VK, Hildmann T, Novik KL, Lewin J, Tost J, Cox AV, Andrews
TD, Howe KL, Otto T, Olek A, et al.: DNA methylation profiling of the human major histocompatibility complex: a pilot study for the human epigenome project. PLoS Biol 2004,
2(12):e405.
21. Shiota K: DNA methylation profiles of CpG islands for cellular differentiation and development in mammals. Cytogenet Genome Res 2004, 105(2–4):325-334.
22. Kim TH, Ren B: Genome-Wide Analysis of Protein-DNA Inter-actions. Annu Rev Genomics Hum Genet 2006, 7:81-102.
23. Weber M, Davies JJ, Wittig D, Oakeley EJ, Haase M, Lam WL, Schube-ler D: Chromosome-wide and promoter-specific analyses identify sites of differential DNA methylation in normal and transformed human cells. Nat Genet 2005, 37(8):853-862. 24. Khulan B, Thompson RF, Ye K, Fazzari MJ, Suzuki M, Stasiek E,
Figueroa ME, Glass JL, Chen Q, Montagna C, et al.: Comparative isoschizomer profiling of cytosine methylation: the HELP assay. Genome Res 2006, 16(8):1046-1055.
25. Fiegler H, Redon R, Andrews D, Scott C, Andrews R, Carder C, Clark R, Dovey O, Ellis P, Feuk L, et al.: Accurate and reliable
high-Additional file 1
Scatter-plots of control hybridizations using the MHC tiling array. a). Comparison of biological replicates; b). Comparison of biological repli-cates after PCR; c). Comparison of profiles with and without LM-PCR; d). Comparison of dye swaps after LM-PCR. Sperm DNA was used in all comparisons. Correlation coefficients (R2) are given for each com-parison.
Click here for file
[http://www.biomedcentral.com/content/supplementary/1755-8794-1-19-S1.jpeg]
Additional file 2
tDMRs within the MHC region. A total of 90 tDMRs were identified. Six pair-wise comparisons were performed and, in total, 90 tDMRs were identified using t-statistics (see Methods). tDMRs of each comparison and their co-ordinates on chromosome 6 are provided. M values which are equivalent to the log2 ratio of the two corresponding methylation profiles in each comparison are shown. A threshold of p-value <0.001 was used. P-values of the 90 tDMRs are provided.
Click here for file
Publish with BioMed Central and every scientist can read your work free of charge
"BioMed Central will be the most significant development for disseminating the results of biomedical researc h in our lifetime."
Sir Paul Nurse, Cancer Research UK
Your research papers will be:
available free of charge to the entire biomedical community
peer reviewed and published immediately upon acceptance
cited in PubMed and archived on PubMed Central
yours — you keep the copyright
Submit your manuscript here:
http://www.biomedcentral.com/info/publishing_adv.asp
BioMedcentral
throughput detection of copy number variation in the human genome. Genome Res 2006, 16(12):1566-1574.
26. Redon R, Ishikawa S, Fitch KR, Feuk L, Perry GH, Andrews TD, Fie-gler H, Shapero MH, Carson AR, Chen W, et al.: Global variation in copy number in the human genome. Nature 2006,
444(7118):444-454.
27. The International HapMap Project. Nature 2003,
426(6968):789-796.
28. Ballestar E, Paz MF, Valle L, Wei S, Fraga MF, Espada J, Cigudosa JC, Huang TH, Esteller M: Methyl-CpG binding proteins identify novel sites of epigenetic inactivation in human cancer. Embo J 2003, 22(23):6335-6345.
29. Lewis A, Murrell A: Genomic imprinting: CTCF protects the boundaries. Curr Biol 2004, 14(7):R284-286.
30. Ottaviani D, Lever E, Takousis P, Sheer D: Anchoring the genome.
Genome Biol 2008, 9(1):201.
31. Turner DJ, Miretti M, Rajan D, Fiegler H, Carter NP, Blayney ML, Beck S, Hurles ME: Germline rates of de novo meiotic deletions and duplications causing several genomic disorders. Nat Genet 2008, 40(1):90-95.
32. Oberley MJ, Tsao J, Yau P, Farnham PJ: High-throughput screen-ing of chromatin immunoprecipitates usscreen-ing CpG-island microarrays. Methods Enzymol 2004, 376:315-334.
33. Gentleman RC, Carey VJ, Bates DM, Bolstad B, Dettling M, Dudoit S, Ellis B, Gautier L, Ge Y, Gentry J, et al.: Bioconductor: open soft-ware development for computational biology and bioinfor-matics. Genome Biol 2004, 5(10):R80.
34. Smyth GK, Speed T: Normalization of cDNA microarray data.
Methods 2003, 31(4):265-273.
35. Yang YH, Thorne NP: Normalization for two-color cDNA microarray data. Science and Statistics: A Festschrift for Terry Speed
2003, 40:403-418.
36. Smyth GK: Limma: linear models for microarray data. In Bio-informatics and Computational Biology Solutions using R and Bioconductor
Edited by: R Gentleman VC, Dudoit S, Irizarry R, Huber W. New York: Springer; 2005:397-420.
37. Smyth GK: Linear models and empirical bayes methods for assessing differential expression in microarray experiments.
Stat Appl Genet Mol Biol 2004, 3:Article3.
38. Lewin J, Schmitt AO, Adorjan P, Hildmann T, Piepenbrock C: Quan-titative DNA methylation analysis based on four-dye trace data from direct sequencing of PCR amplificates. Bioinformat-ics 2004, 20(17):3005-3012.
39. The Wellcome Trust Sanger Institute Microarray Facility
[http://www.sanger.ac.uk/Projects/Microarrays]
40. Eckhardt F, Lewin J, Cortese R, Rakyan VK, Attwood J, Burger M, Bur-ton J, Cox TV, Davies R, Down TA, et al.: DNA methylation pro-filing of human chromosomes 6, 20 and 22. Nat Genet 2006,
38(12):1378-1385.
41. GNF Atlas of Gene Expression [http://symatlas.gnf.org/SymAt las/]
42. Su AI, Cooke MP, Ching KA, Hakak Y, Walker JR, Wiltshire T, Orth AP, Vega RG, Sapinoso LM, Moqrich A, et al.: Large-scale analysis of the human and mouse transcriptomes. Proc Natl Acad Sci USA 2002, 99(7):4465-4470.
43. Hubbard TJ, Aken BL, Beal K, Ballester B, Caccamo M, Chen Y, Clarke L, Coates G, Cunningham F, Cutts T, et al.: Ensembl 2007. Nucleic Acids Res 2007:D610-617.
44. Kim TH, Abdullaev ZK, Smith AD, Ching KA, Loukinov DI, Green RD, Zhang MQ, Lobanenkov VV, Ren B: Analysis of the verte-brate insulator protein CTCF-binding sites in the human genome. Cell 2007, 128(6):1231-1245.
45. Mizuguchi G, Shen X, Landry J, Wu WH, Sen S, Wu C: ATP-driven exchange of histone H2AZ variant catalyzed by SWR1 chro-matin remodeling complex. Science 2004, 303(5656):343-348. 46. Szilagyi A, Blasko B, Szilassy D, Fust G, Sasvari-Szekely M, Ronai Z:
Real-time PCR quantification of human complement C4A and C4B genes. BMC Genet 2006, 7:1.
47. Rodin SN, Riggs AD: Epigenetic silencing may aid evolution by gene duplication. J Mol Evol 2003, 56(6):718-729.
48. Seliger B, Cabrera T, Garrido F, Ferrone S: HLA class I antigen abnormalities and immune escape by malignant cells. Semin Cancer Biol 2002, 12(1):3-13.
49. Human Epigenome Project [http://www.epigenome.org] 50. Analytical Biological Services [http://www.absbio.com/]
51. BioChain Institute [http://www.biochain.com/biochain/ homepage.htm]
Pre-publication history
The pre-publication history for this paper can be accessed here: