P R O C E E D I N G S
Open Access
TSG: a new algorithm for binary and multi-class
cancer classification and informative genes
selection
Haiyan Wang
1†, Hongyan Zhang
2,3,4†, Zhijun Dai
2,4, Ming-shun Chen
5, Zheming Yuan
2,4*From
The 2011 International Conference on Bioinformatics and Computational Biology (BIOCOMP
’
11)
Las Vegas, NV, USA. 18-21 July 2011
Abstract
Background:One of the challenges in classification of cancer tissue samples based on gene expression data is to establish an effective method that can select a parsimonious set of informative genes. The Top Scoring Pair (TSP), k-Top Scoring Pairs (k-TSP), Support Vector Machines (SVM), and prediction analysis of microarrays (PAM) are four popular classifiers that have comparable performance on multiple cancer datasets. SVM and PAM tend to use a large number of genes and TSP, k-TSP always use even number of genes. In addition, the selection of distinct gene pairs in k-TSP simply combined the pairs of top ranking genes without considering the fact that the gene set with best discrimination power may not be the combined pairs. The k-TSP algorithm also needs the user to specify an upper bound for the number of gene pairs. Here we introduce a computational algorithm to address the
problems. The algorithm is named Chisquare-statistic-based Top Scoring Genes (Chi-TSG) classifier simplified as TSG.
Results:The TSG classifier starts with the top two genes and sequentially adds additional gene into the candidate gene set to perform informative gene selection. The algorithm automatically reports the total number of
informative genes selected with cross validation. We provide the algorithm for both binary and multi-class cancer classification. The algorithm was applied to 9 binary and 10 multi-class gene expression datasets involving human cancers. The TSG classifier outperforms TSP family classifiers by a big margin in most of the 19 datasets. In addition to improved accuracy, our classifier shares all the advantages of the TSP family classifiers including easy
interpretation, invariant to monotone transformation, often selects a small number of informative genes allowing follow-up studies, resistant to sampling variations due to within sample operations.
Conclusions:Redefining the scores for gene set and the classification rules in TSP family classifiers by incorporating the sample size information can lead to better selection of informative genes and classification accuracy. The resulting TSG classifier offers a useful tool for cancer classification based on numerical molecular data.
Background
With the availability of high throughput genomics data, methods for cancer class classification and prediction based on molecular information have been vigorously pur-sued in recent years. The objective of this study is to find important molecular markers and/or build a classifier
such that the classifier with selected markers as the inde-pendent variables can accurately classify the diagnostic disease status of a sample using expression data. Popular methods for this problem include Prediction Analysis of Microarrays (PAM, [1]), Top Scoring Pair (TSP, [2]), k-Top Scoring Pair (k-TSP, [3]), Support Vector Machine (SVM, [4]) etc. There are also many other endeavors such as individual-gene-ranking by evaluating the discriminat-ing power of classes (see [5,6] and the references therein), gene filtering through relevance and correlation analyses [7,8], gene selection for classification based on the Bayes * Correspondence: [email protected]
†Contributed equally
2
Hunan Provincial Key Laboratory of Crop Germplasm Innovation and Utilization, Changsha 410128, China
Full list of author information is available at the end of the article
error [9], comparing the distributions of within-class cor-relations with between-class corcor-relations via Kullback-Leibler divergence [10], recursive feature addition with Lagging Prediction Peephole Optimization to choose the final optimal marker set [11], SVM based recursive feature elimination [12,13], random forests [14] and random sub-space search [15,16], among others.
There are a few challenges associated with such study. One of them is that the number of independent variables (markers) is typically much more than the number of available samples, often referred as curse of dimensional-ity. To identify possibly nonlinear effects of many variables and their interactions, it is often necessary to estimate a large number of modeling parameters. A direct conse-quence of the curse of dimensionality is that the total number of parameters that the data can estimate is restricted by the number of the samples. When the total number of parameters greatly exceeds the number of samples, overfitting occurs such that the prediction of the phenotype works well for the learning data but the perfor-mance of the classifier applied to independent test samples exhibit poor classification accuracy. The informative mar-ker selection process unfortunately needs to consider modeling with each possible combination of all markers in order to find the globally best marker set, which has the best discriminating power for the different disease cate-gories and may or may not be the primary biological and pathological driving factors underlying disease progres-sion. Hence, an effective practice is to first reduce the dimensionality of the marker space.
The TSP and k-TSP classifiers are two simple algorithms that select gene pairs with top scores to build classifiers. They were shown to perform well for binary classification with gene expression data [2,3]. The gene pairs were selected based on simple pairwise comparisons between two marker expression levels within the same sample. Spe-cifically, letpij(C1)be the percentage of training samples in class 1 that the expression of one marker is less than that of the other marker in the same sample and letpij(C2)be similarly defined. The score for a gene pair is defined as the estimated difference between the two percentagespij
(C1) - pij(C2). Then the gene pair that received the highest
score is selected as the marker set for TSP classifier and the top k gene pairs with highest scores are used for the k-TSP classifier. Tan et al. [3] extended the two classifiers to multi-class classification through others, one-vs-one, and hierarchical classification (HC) schemes. They reported that the HC schemes for TSP and k-TSP gave better performance than the other two schemes.
There are advantages and disadvantages with the TSP and k-TSP classifiers. Some advantages of the two classi-fiers are that they are simple to implement and the resulting classifiers are easy to interpret. They are also invariant to monotone transformations as they only
depend on relative rankings of gene expressions within the same sample. The overfitting problem is largely avoided due to simple comparisons. In addition, they are different from most algorithms in that comparisons in other algorithms were mostly between expressions from different samples. Comparison of expressions within the same sample in TSP and k-TSP helps to eliminate the influence of sampling variability due to different subjects.
A disadvantage is related to how the scores for gene pairs are defined. As the scores were calculated from per-centages, the sample size information was not fully uti-lized in TSP and k-TSP. For example, suppose 4 out of 10 samples in class 1 and 6 out of 10 samples in class 2 satisfy the condition: Marker 1 has smaller expression value than marker 2. The score for the pair with markers 1 and 2 is 0.2, which is the absolute difference between the two percentages. In another case, suppose all the counts are multiplied by 10, i.e. 40 out of 100 samples in class 1 and 60 out of 100 samples in class 2 satisfy the condition. Then the score for the marker pair is identical to the previous case. So the additional information with extra sample size is completely ignored in TSP and k-TSP classifiers.
In this article, we propose a new algorithm to overcome the above problems of TSP family classifiers. We intro-duce a new definition of the score for each marker set so that the sample size information is fully utilized. In addi-tion, it is unrealistic to assume that the number of infor-mative genes is always even as in TSP family classifiers. We present a new algorithm that performs sequential search and do not restrict the informative markers to be even numbered. The binary class and multi-class cases are unified into a single framework. The algorithm was applied to 9 binary class and 10 multi-class cancer geno-mics datasets. The TSG classifier achieved better leave-one-out cross validation accuracy for the binary classifica-tion than TSP or k-TSP classifiers. For the multi-class pro-blems, our TSG classifier gives comparable performance or outperform TSP family and other popular classifiers with a big margin in independent test accuracy for several cancer datasets. Beyond high accuracy, our new algorithm also has the advantage of giving small number of informa-tive marker set and all the advantages of the TSP family classifiers.
Methods
For generality, we describe the method in terms of mar-kers, which could represent genes, probe sets, or other molecular units whose intensity is measured with high throughput instruments. Consider expression data fromP markers and suppose there areNsamples. The data can be expressed as a matrixXof dimensionNxP. The (i, j) elementxijof the matrix gives the expression value of the
jthmarker in theithsample. Let (y1,..., yN) be the class
labels for the N samples, whereyktakes one of the values
in the set of all possible classes {C1,..., CM}. Cirepresents the class phenotype that may be cancerous tumor, normal, or cancer subclasses such as different stages of a cancer. Denotexi=(xi1,..., xiP) to be thePexpression values from theithsample. ThePis typically much larger thanN, and could be in the neighborhood of exponential order O(eN) with high density microarrays. The objective is to useΩ=
{ (xi, yi),i = 1,..., N} to select a parsimonious set of
infor-mative markers and build a classifier with these markers such that the diagnosis status of a test sample can be accu-rately classified by modeling the expression data of the selected markers.
Score of a marker set
To consider the differentiating power of a set of markers consisting of k markers, we first define the score of the marker set. A normal sample contains normal proto-oncogenes that promote cell growth and mitosis and tumor suppressor genes that discourage cell growth. During cancer development, proto-oncogenes can be mutated by carcinogenic agents to become oncogenes, which produce excessive levels of growth promoting
proteins. Cancer results from cumulative mutations of proto-oncogenes and suppressor genes which together allow the unregulated growth of cells. Hence, cancer development involves uncontrolled cell division resulting from a series (progression) of gene mutations that typi-cally involve two categories of function: promotion of cell division and inactivation of cell cycle suppression. The expression values of excessive growth genes tend to be much higher than the same genes of a normal sample. Similarly, the level of tumor suppressor genes of a cancer sample tends to be much lower than a normal sample. It is relatively rare that a single marker alone could offer sufficient power to differentiate all the classes well in multi-class data. So we consider marker sets with at least two markers keeping in mind that over-growth of some genes and inactivation of other genes often happen together in cancer cases. Later stages of cancer involve tissue invasiveness, during which malignant cells travel among tissues via the circulatory and/or lymphatic sys-tem and grow and thrive in their new locations. There-fore the relative amount of two or multiple markers in a sample could be an indication of the cancer stages.
Score of marker pairs
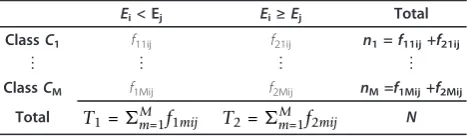
For markersi andj, we use the following notation. Let f1mij,m= 1,...M, represent the frequency count of sam-ples in classCmthat satisfy the condition: the expression value for marker iis less than the expression value of marker j. Similarly, letf2mij , m = 1,...M, be the fre-quency count of samples that satisfy the condition: the expression value for markeri is greater than or equal to the expression value of marker j. These counts can be presented in a cross-tabulation table as shown in Table 1, wheref1mij , m = 1,... M, are the entries in the first column andf2mij, m = 1,... M, are the entries in the sec-ond column.
Based on the cancer mechanism that there is excessive growth in tumor cells and inactivation of suppressor genes, the best informative genes would consist of some genes overly expressed and some other genes that are down-regulated. In particular, a marker pair with genes i and j become increasingly more informative of the
Table 1 Frequency counts of samples in each class for marker pairs.
Ei< Ej Ei≥Ej Total
ClassC1 f11ij f21ij n1=f11ij+f21ij
⋮ ⋮ ⋮ ⋮
ClassCM f1Mij f2Mij nM=f1Mij+f2Mij
Total T1=Mm=1f1mij T2=Mm=1f2mij N
TheEiandEjrepresent the population of expression values for markers i and j respectively.
cancer status as the difference of their expression values diverges away from the corresponding difference between the same marker pairs of a normal patient. Consequently, for two markers encoding genes or pro-teins that are important to differentiate the cancer sta-tus, their relative magnitude of the expressions are inter-related and whether the expression value for mar-keriis less than the expression value of markerjis not independent of the class status. To incorporate the sam-ple size information, the Chisquare statistic defined in equation (1) can be used to assess whether the pair of markers i and j are informative for classification of can-cer status:
χij2=
2
q=1Mm=1
(fqmij−nmTq/N)2 nmTq/N
=N
2
q=1Mm=1
f2 qmij nmTq
−1
, (1)
wherenmandTqare the row and column totals from themthrow andqthcolumn, respectively. If all the counts in Table 1 are large and all cell counts are at least five, a traditional way to declare significance for the pair is to compare the calculated statistic with the chi-squared-distribution withM -1 degrees of freedom. However, the significance level for declaring significance of a single test needs to be adjusted for multiple comparisons. There are various directions including family-wise error rate control, false-discovery rate (FDR) control, among others. The family-wise error rate control tends to be conservative while the FDR control could lead to high false positive rates. In this work, we do not use the chi-squared-distribu-tion and do not decide how many pairs are significant. Instead, we only use the Chi-square statistic in (1) as an indication of how much departure from independence between the class and the chance of observing marker i expression value less than that of marker j. As the depar-ture from independence increases, the chi-squared statistic value increases. We select the top pair of markers that yield the highest value of the chi-squared statistic. Addi-tional marker selection will follow the algorithm in section 2.2.
Score of ak-marker set
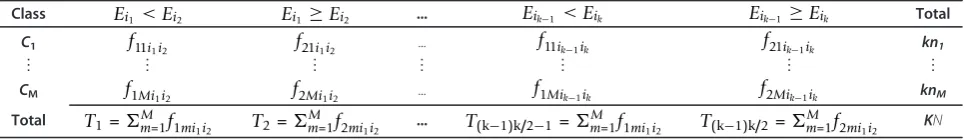
For a set that contains k markers, we consider the cross tabulated Table 2 that contains frequency counts of all unique pairwise comparisons among thekmarkers. There arek(k-1) columns of counts. The sum of counts in each column remains to be the same as that for two-marker case. The row totals are nowktimes that of the sample sizes in corresponding classes. We calculate the Chisqure statistic as in equation (2).
χ2
i1...ik=ak−1=1bk=a+1Mm=12q=1
fqmiaib−
knmTq
N 2
knmTq/N =N
k−1
a=1kb=a+1mM=1q2=1
f2
qmiaib
knmTq−
1
, (2)
Note that the χ2i1...ik only differs fromak−=11bk=a+1χ2iaib by the division factorkin the first term. So comparison of
χ2
i1...ik and χ 2
j1...jk for two sets ofk-markers {i1,..., ik} and
{j1,..., jk} is equivalent to comparing k−a=11bk=a+1χ2iaib and
k−1
a=1bk=a+1χ 2
jajb. The latter can be calculated easily with-out much computational cost after the statistics for mar-ker pairs have been computed. The statistics given in equation (2) should be restricted to comparing marker sets with the same number of markers. All the k-marker sets can be ranked according to the magnitude of the Chisquare statistic values. The k-marker set with the high-est Chisquare value is the most informative set among all k-marker sets.
Comparing marker sets of different sizes or identical Chisquare statistic
For comparing multiple sets with different numbers of markers, the Chisquare statistics given earlier can not be used because they accumulate different numbers of terms. In such case, we use the leave-one-out cross validation (LOOCV) accuracy within the training data obtained with the procedure below as the objective function.
Suppose the training data containsNtrsamples. With-out loss of generality, we useΩtr= {S1,...,SNtr} to denote
the collection of these samples. For a marker set {i1,..., ik}, the LOOCV is performed within this training
sam-ple. In particular, we
1. Leave out one training sampleSlto be used as the
test data and use the rest of the training samplesΩtr\
Slas training data.
2. For classm, (1≤m≤M), assignSlto this class and
calculate the Chisquare statistic for the marker set
{i1,..., ik}. We obtain M Chisquare statistics {χ2(m)i1...ik,
m = 1,..., M}. The predicted class mˆ(Sl)forSlis the
class that has the maximum Chisquare statistics, i.e., ˆ
m(Sl) = arg max
1≤m≤Mχ
2(m)
i1...ik.
3. Repeat 1 and 2 for all the samples inΩtrto get the prediction of all samples inΩtr: mˆ(Sl), l=1,...,
Ntr.
4. The LOOCV accuracy for marker set {i1,..., ik} is LOOCV(i1,..., ik) = the proportion of correctly classi-fied samples inΩtr.
Marker selection algorithm
For a given upper boundBon the cardinality of the mar-ker set, the marmar-ker selection process first selects the top scoring pairs and then sequentially adds additional mar-kers into the active set until the total number of marmar-kers in the active set reaches the upper boundB. This is done following the algorithm below: Denote the set of remain-ing markers asẞ. The initial value ofẞis the list of all markers.
1. Calculate and record the Chisquare statistics for all marker pairs using the training data.
2. If the highest value of the Chisquare statistics is achieved by a unique marker pair, select this pair and denote it as TS2. Calculate the LOOCV for this pair of markers and denote it as LOOCV2. Update the remaining marker set ẞby removing the mar-ker pair selected.
3. If there are multiple marker pairs that have identical maximum Chisquare statistic value, calculate the LOOCV accuracy of these marker pairs using the train-ing data. Keep the marker pairs that have the highest LOOCV accuracy. If the highest accuracy is achieved by more than one pairs, denote the different pairs as TS2,1, TS2,2, etc.
4. Find the top scoring triplets by adding additional marker to the top scoring pairs. This is done as fol-lows. For each of the top scoring pairs resulting from 2 and 3, find the marker from the list of remaining mar-kersẞsuch that the triplet has the highest Chisquare statistic value. If there are multiple triplets with identi-cal maximum Chisquare value, identi-calculate the LOOCV accuracy of these triplets and record those triplets that yield the highest LOOCV accuracy. Denote the top scoring triplet as TS3if it is unique, and TS3,1, TS3,2, etc otherwise if multiple sets achieved identical accu-racy. Record the LOOCV accuracy of the top scoring triplets.
5. For k=4, 5,...,B, find TSk and their correspond-ing LOOCV accuracy LOOCVk. Askincreases, the set TSktend to be unique.
6. Select the smallest k-marker set such that the LOOCV is maximized over all TSk,k = 1,...,B. If the marker set is not unique, randomly select one of them as the final set. Denote the final selected informative
marker set as TSG, where G = arg max1 ≤ k ≤ B LOOCVk.
As discussed in section 2.1.2, the comparison of the Chisquare statistics for χ2
i1...ikcan be simplified by com-paring the summation of all Chisquare statistics from unique marker pairs ak−=11bk=a+1χ2iaib.
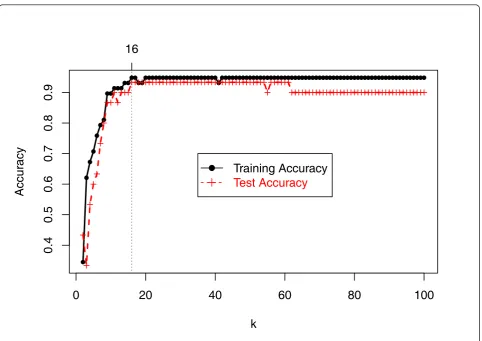
As an illustration, Figure 1 shows the the accuracy of the training and test data fork=2,...,100for the 6-class DLBCL cancer microarray data [17]. It can be seen that the training accuracy reached maximum when k=16. So the selected marker set is TS16.
Our experience suggests that it is sufficient to set the upper bound B to be 50 if the total number of classes M≤4, 100 if 5≤M≤8, and 150 if M≥9.
Prediction with TSG classifier
To predict the class information for each sample in the test data, we use the selected marker set and calculate the scores of this sample belonging to each class. A large value for a class suggests that putting this sample in that class helps to increase the separation of different classes. The predicted class is set to be the one that has the largest score. In particular, suppose the selected marker set consists of markers m1, m2,..., mk, the
train-ing data is Ωtr, and the sample to be predicted is xnew. Letχ2i1...ik|Cibe the Chisquare statistic value when we put the sample in class Ci, i = 1,..., M. There are M
Chisquare values. We assign the sample to the class with the largest Chisquare value:
Class of xnew= arg max
i=1,...,Mχ
2
i1...ik|Ci.
If multiple classes reach the same maximum Chis-quare value, we further calculate the LOOCV accuracy for these classes. The final prediction is based on which class achieves the highest LOOCV accuracy.
Results and discussion
Microarray data and method of comparison
The performance of the proposed TSG marker selection and classifier is evaluated on both binary and multi-class microarray expression data. We consider the 19 datasets that were used for evaluation of TSP, k-TSP and their multi-class version classifiers in Tan et al. 2005. There Table 2 Frequency counts of samples in each class for a set of k markers.
Class Ei1 <Ei2 Ei1≥Ei2 ... Eik−1 <Eik Eik−1 ≥Eik Total
C1 f11i1i2 f21i1i2 ... f11ik−1ik f21ik−1ik kn1
⋮ ⋮ ⋮ ⋮ ⋮ ⋮ ⋮
CM f1Mi1i2 f2Mi1i2 ... f1Mik−1ik f2Mik−1ik knM
Total T1=M
are 9 binary and 10 multi-class datasets. These datasets are related to human cancers including colon cancer, leukemia, central nervous system, diffuse large B-cell lymphoma, breast cancer, lung cancer, and prostate can-cer. The reference, sample size, number of genes in each dataset, and the number of samples in each class are summarized in Tables 3 and 4. The number of classes ranges from 2 to 14. The number of markers ranges from 2000 to 16063. Average number of samples per class ranges from 13 to 140. The ratio between the number of samples per class and the number of markers ranges from 0.000845 to 0.0155.
First, we consider comparison of TSG and k-TSP clas-sifiers for binary datasets based on 5-fold cross validation. The subjects in each class are randomly partitioned into 5 parts, 4 of which form the training data and the rest of the subjects constitute the test data. The feature selection and modeling were conducted on the training data and prediction for each subject in the test data was given. For the results to be comparable to the TSP family classifiers, we also follow the same comparison methods as in Tan et al. [3]. In particular, we perform LOOCV for binary
datasets and perform independent test for multi-class datasets. In the LOOCV, each sample is taken out and the remaining N-1 samples are used to train the classifier, which is then used to predict the class label of the leave-out sample. The LOOCV accuracy is the proportion of correctly classified samples. Each of the multi-class data-sets is partitioned into training and test data. We follow exactly the same partition scheme as in Tan et al. [3].
0
20
40
60
80
100
0.4
0.5
0.6
0.7
0.8
0.9
k
Accur
acy
16
Training Accuracy
Test Accuracy
Figure 1Accuracy of TSkfor training and test data from DLBCL cancer (Alizadeh et al., 2000).
Table 3 Binary class gene expression datasets
Dataset Platform No. of Genes
No. of samples in class I
No. of samples in class II
Source
Colon cDNA 2000 40(T) 22(N) [18]
Leukemia Affy 7129 25(AML) 47(ALL) [19]
CNS Affy 7129 25(C) 9(D) [20]
DLBCL Affy 7129 58(D) 19(F) [21]
Lung Affy 12533 150(A) 31(M) [22]
Prostate1 Affy 12600 52(T) 50(N) [23]
Prostate2 Affy 12625 38(T) 50(N) [24]
Prostate3 Affy 12626 24(T) 9(N) [25]
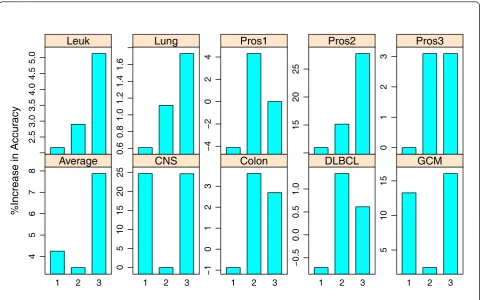
Since an objective of this research is to improve the TSP family classifiers, we present the percent of increase in classification accuracy in barplots. The percent of increase for TSG over TSP is defined as (accuracy of TSG - accuracy of TSP)/accuracy of TSP x 100%.
The percent of increase for any two classifiers are simi-larly defined. As TSP classifier uses two genes, k-TSP and TSG use at least two genes, we are particularly interested in comparing the improvement in accuracy for TSG over TSP and k-TSP over TSP in binary classifications. Simi-larly, in the multi-class cases, we are interested in compar-ing the increase in accuracy for TSG over HC-TSP and HC-k-TSP over HC-TSP.
For reference, we also include the classification accu-racy of decision trees (DT), Naive Bayes (NB), k-nearest neighbor (k-NN), Support Vector Machines (SVM) and prediction analysis of microarrays (PAM) in our compari-son tables when they are available from the literature. These results were reported in Tan et al. [3] for leave-one-out cross validation for binary data and independent test for multiclass data. We include them only for conve-nience of discussion. DT and PAM have feature selection function while NB, k-NN and SVM perform classification using the entire set of features. Since DT, k-NN, and NB in general have lower accuracy than the other classifiers, we focus our discussion on other classifiers.
Accuracy for binary cancer data
In this section we present the comparison of the TSG marker selection algorithm with other algorithms using 9 benchmark binary class cancer expression datasets. These data have been analyzed extensively by many authors with wrapper, filtering and ensemble methods.
Comparison of TSG and k-TSP classifiers based on 5-fold cross validation
Here we present our comparison of TSG and k-TSP classifiers based on 5-fold cross validation. For each bin-ary cancer dataset, we randomly split the subjects in
each class into 5 parts. One part will be left out as the test data and the remaining 4 parts are used as the training data. We then train the TSG, k-TSP and TSP classifiers using the training data to select features and build models. TSP is included for reference purpose since both TSG and k-TSP extend the TSP classifier. The resulting features and models are further used to predict the class of each subject in the test data. Each of the 5 parts in turn serves as the test data. We record the accuracy of the prediction calculated as the propor-tion of correctly classified subjects among all collected subjects. The procedure is repeated 10 times. The aver-age and standard error of the accuracy are reported in Table 5.
In five of the nine datasets (CNS, DLBCL, Leukemia, Lung, Prostate3), TSG has slightly better performance than k-TSP. In the remaining four datasets, k-TSP has slightly better performance. On average, TSG and k-TSP have comparable 5-fold cross validation performance. The k-TSP improvement over TSP is also marginal in this 5-fold cross validation setting for most of the datasets.
LOOCV accuracy
Among the LOOCV accuracy reported in the literature, we find that TSP, k-TSP, PAM and SVM are often the top performing classifiers.
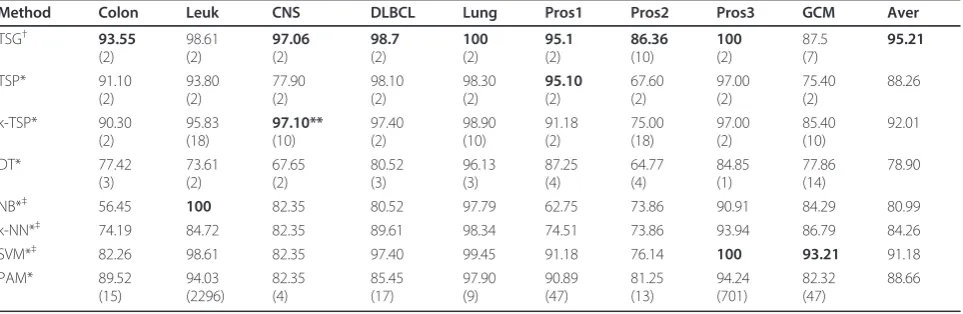
The LOOCV accuracy of the proposed TSG and afore-mentioned competing classifiers for the 9 datasets are presented in Table 6. In terms of accuracy, TSG consis-tently gives the best performance for all but the leukemia dataset, for which NB yields an accuracy of 100% while TSG gives 98.61%. For the CNS data, TSG and k-TSP have tied performance of 97% that is much better than the rest of the classifiers (all below 83%). For the prostate 1 data, TSG and TSP have equally best performance. For the prostate 3 data, TSG and SVM both have 100% accuracy.
To assess how much improvement the TSG classifier achieves by considering arbitrary number of genes instead of only top scoring pairs as in TSP and k-TSP, we give the percent of increase in LOOCV accuracy in Figure 2. The first bar in each panel is the percent of improvement in accuracy for k-TSP over TSP classifier; the second gives that for TSG over k-TSP and the third gives that for TSG over TSP. Comparing the bar heights of the first and third bars in each panel gives us an idea of whether k-TSP and TSG improve TSP with similar performance. The second bar in each panel tells how much improvement TSG achieves over k-TSP. For the CNS data, TSG and k-TSP have same improvement over TSP. The much taller heights for the third bar in all panels except for the CNS data suggest that TSG gained much more accuracy than k-TSP. There are two reasons for this observed accuracy gain: (1) the set of informative genes could be odd Table 4 Multi-class gene expression datasets
Dataset Platform No. of Classes
No. of Genes
No. of samples
in training
No. of samples
in test
Source
Leukemia1 Affy 3 7129 38 34 [19]
Lung1 Affy 3 7129 64 32 [27]
Leukemia2 Affy 3 12582 57 15 [28]
SRBCT cDNA 4 2308 63 20 [29]
Breast Affy 5 9216 54 30 [30]
Lung2 Affy 5 12600 136 67 [31]
DLBCL cDNA 6 4026 58 30 [17]
Leukemia3 Affy 7 12558 215 112 [32]
Cancers Affy 11 12533 100 74 [33]
numbered but k-TSP can only use even number of genes; (2) selection of additional genes after the top pair by the TSG classifier considers the joint effect of all selected genes on differentiating the cancer classes whereas the k-TSP classifier only consider the marginal effect of pairs. Without considering the joint effect, collection of top scoring pairs in k-TSP could easily accumulate redundant genes. So TSG naturally gives better performance than k-TSP.
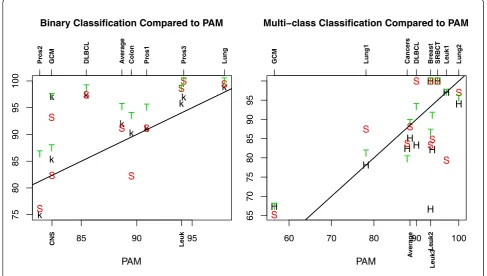
To ease the discussion about how the performance of TSG, k-TSP, HC-k-TSP, SVM, and PAM classifiers com-pare to each other, we plot the LOOCV accuracy of TSG, k-TSP, and SVM relative to that of PAM in the left panel of Figure 3. It can be seen that TSG, k-TSP, and SVM are in general better than PAM for binary data since most of the accuracy values for TSG, k-TSP, and SVM are above the straight line. The performance of TSG is consistently the best as its values are highest for all datasets. SVM has similar accuracy as k-TSP in four datasets. SVM is worse than k-TSP clearly in two datasets (Colon and CNS) and k-TSP is obviously not as accurate as SVM in the Leuk,
GCM and Pros3 datasets. On average performance, k-TSP and SVM are comparable in binary classifications with the 9 datasets. In summary, the TSG classifier outperforms k-TSP and SVM in LOOCV accuracy for the 9 binary classi-fication problems, the latter two have comparable perfor-mance and are both better than PAM in accuracy.
Accuracy of independent test for multi-class cancer data
For the multi-class datasets, the accuracy of classifiers on independent test data is presented in Table 7.
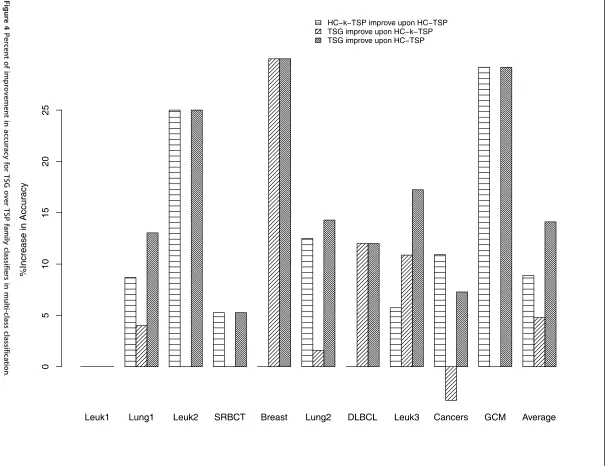
The percent of increase in accuracy for HC-k-TSP and TSG over HC-TSP is shown in Figure 4. The similar bar heights for the first and third bars in Leuk1, Leuk2, SRBCT, and GCM datasets indicate that HC-k-TSP and TSG improve upon TSP with similar amount for these datasets. For the Breast, DLBCL, Leuk3 datasets, TSG achieved a lot more accuracy gain over HC-TSP than HC-k-TSP. For these three datasets, the gain of accuracy of TSG over HC-k-TSP is 30%, 12%, and 10.87% respec-tively. For Lung1, Lung2 and on average, TSG also has better accuracy than HC-k-TSP but the gain of TSG over Table 5 Average and standard error of accuracy from 5-fold cross validation based on 10 runs.
TSG k-TSP TSP
Dataset Average Standard error Average Standard error Average Standard error
CNS 81.1 1.61 77.0 1.48 67.0 2.48
Colon 84.8 0.85 87.4 0.31 86.7 1.85
DLBCL 95.2 0.69 94.6 0.88 92.9 2.25
GCM 81.7 0.66 81.9 0.41 76.0 1.04
Leukemia 93.7 0.75 91.8 1.13 89.4 1.56
Lung 100 0 98.6 0.15 96.3 0.69
Prostate1 90.2 0.72 91 0.75 89.3 1.27
Prostate2 74.4 0.6 77.9 0.69 70.4 2.25
Prostate3 100 0 95.4 0.79 95.1 1.44
Average 89.0 88.4 84.8
Table 6 LOOCV accuracy and the number of genes used in classifiers (in parenthesis) for binary class expression datasets
Method Colon Leuk CNS DLBCL Lung Pros1 Pros2 Pros3 GCM Aver
TSG† 93.55
(2)
98.61 (2)
97.06 (2)
98.7 (2)
100 (2)
95.1 (2)
86.36 (10)
100 (2)
87.5 (7)
95.21
TSP* 91.10
(2)
93.80 (2)
77.90 (2)
98.10 (2)
98.30 (2)
95.10 (2)
67.60 (2)
97.00 (2)
75.40 (2)
88.26
k-TSP* 90.30
(2)
95.83 (18)
97.10** (10)
97.40 (2)
98.90 (10)
91.18 (2)
75.00 (18)
97.00 (2)
85.40 (10)
92.01
DT* 77.42
(3)
73.61 (2)
67.65 (2)
80.52 (3)
96.13 (3)
87.25 (4)
64.77 (4)
84.85 (1)
77.86 (14)
78.90
NB*‡ 56.45 100 82.35 80.52 97.79 62.75 73.86 90.91 84.29 80.99
k-NN*‡ 74.19 84.72 82.35 89.61 98.34 74.51 73.86 93.94 86.79 84.26
SVM*‡ 82.26 98.61 82.35 97.40 99.45 91.18 76.14 100 93.21 91.18
PAM* 89.52
(15)
94.03 (2296)
82.35 (4)
85.45 (17)
97.90 (9)
90.89 (47)
81.25 (13)
94.24 (701)
82.32 (47)
88.66
*Results reported in Tan et al. [3]†Results obtained with our method (TSG)‡NB, k-NN, SVM used entire set of genes
HC-k-TSP is not more than 5%. For the cancers dataset, TSG lost 3.27% accuracy than HC-k-TSP. In summary, TSG gains more accuracy than HC-k-TSP in all except for one dataset. We remark that there are three schemes of extending binary classifier TSP to multi-class classi-fiers (1-vs-1, 1-vs-others, and hierarchical classification schemes). The HC-k-TSP and HC-TSP results reported in Tan et al. [3] are with the hierarchical scheme that performs best out of all three schemes. Therefore, TSG classifier has even better performance than the 1-vs-1 and 1-vs-others multi-class extensions of TSP family classifiers.
The accuracy based on independent test samples for TSG, HC-k-TSP, and SVM relative to the accuracy of PAM is presented in the right panel of Figure 3. For half of the datasets SVM has better performance than PAM and for the other half of the datasets, PAM performs bet-ter than SVM in accuracy. So on average, SVM and PAM are comparable. The accuracy of HC-k-TSP in majority of datasets is below that of PAM. On average, HC-k-TSP has accuracy slightly lower than PAM. TSG has better accu-racy than PAM in five of ten datasets, and TSG is not as accurate as PAM in four datasets. On average, TSG, PAM
and SVM have comparable performance with TSG only slightly better. In summary, for multi-class problems, TSG, SVM and PAM are better than HC-k-TSP in accuracy.
The number of genes used in classifiers
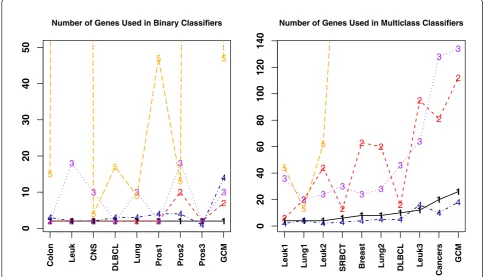
For comparison of classifiers with finite number of sam-ples, the number of genes used by each classifier is an important factor. Classifiers using more genes tend to over-fit the data. Hence classifiers with small number of genes are preferred. Since SVM, k-NN, and NB use the entire set of genes in their classification algorithm, we eliminate them from further discuss on number of genes used and restrict the rest of the discussion in this subsection to TSP, HC-TSP, DT, k-TSP, HC-k-TSP, TSG, and PAM. For these classifiers, we plot the number of genes used in each dataset for each classifier. For quite many datasets, PAM used hundreds or thousands of genes in the final classifiers. So we set the upper limit of the vertical axis in Figure 5 to be 50 in binary cases and 140 in multi-class cases so that the numbers used by other classifiers can be seen. The numbers for the same classifier under different datasets are connected for convenience of viewing.
%Increase in Accur
acy
45678
1 2 3
Average
0
5
10
15
20
25
1 2 3
CNS
−
10
1
2
3
1 2 3
Colon
−
0.5
0.0
0.5
1.0
1 2 3
DLBCL
51
0
15
1 2 3
GCM
2.5
3.0
3.5
4.0
4.5
5.0
Leuk
0.6
0.8
1.0
1.2
1.4
1.6
Lung
−
4
−
20
2
4
Pros1
15
20
25
Pros2
0123
Pros3
It can be seen from Figure 5 that TSP classifier has the lowest number of genes in binary data classification. PAM used much more number of genes than other clas-sifiers. The classifier that has the second smallest num-ber of genes in binary data classification is TSG, followed by DT that uses the third smallest number of
genes. The k-TSP classifier in general used more num-ber of genes than TSP, TSG, and DT.
For multi-class data, DT uses the least number of genes followed by HC-TSP in the second place. However, as discussed in Section 3.1, DT and HC-TSP are not as accurate as SVM, PAM, HC-k-TSP, and TSG. In 4 out of k
k
k k k
k
k
k
k
k
85 90 95
75 80 85 90 95 100 PAM S S S S S S S S S S T T T T T T T T T T Pr os2
GCM DLBCL Avera
g
e
Colon Pros1 Pros3 Lung
CNS Leuk
Binary Classification Compared to PAM
H H HH H H H H H H H
60 70 80 90 100
65 70 75 80 85 90 95 PAM S S SS S S S S S S S T T T T T T T T T T T
GCM Lung1 Cancer
s
DLBCL Breast SRBCT Leuk1 Lung2
A vera g e Leuk2 Leuk3
Multi−class Classification Compared to PAM
Figure 3The accuracy of TSG, k-TSP, HC-k-TSP, and SVM compared to PAM. Left: LOOCV accuracy of TSG (T), k-TSP (k) and SVM (S) compared to PAM in binary datasets; Right: Accuracy for independent test samples for TSG (T), HC-k-TSP (H), and SVM (S) compared to PAM in multi-class datasets. The straight lines in the plots have slope 1 and intercept 0 such that points on the lines have equal horizontal and vertical values.
Table 7 Accuracy of classifiers and the number of genes used in classifiers (in parenthesis) for the independent test set for multi-class expression datasets
Method Leuk1 Lung1 Leuk2 SRBCT Breast Lung2 DLBCL Leuk3 Cancers GCM Aver
TSG† 97.06
(6) 81.25 (20) 100 (44) 100 (13) 86.67 (63) 95.52 (60) 93.33 (16) 91.07 (95) 79.73 (81) 67.39 (112) 89.20 HC-TSP* 97.06 (4) 71.88 (4) 80 (4) 95 (6) 66.67 (8) 83.58 (8) 83.33 (10) 77.68 (12) 74.32 (20) 52.17 (26) 78.17 HC-k-TSP* 97.06 (36) 78.13 (20) 100 (24) 100 (30) 66.67 (24) 94.03 (28) 83.33 (46) 82.14 (64) 82.43 (128) 67.39 (134) 85.12 DT* 85.29 (2) 78.13 (4) 80 (2) 75 (3) 73.33 (4) 88.06 (5) 86.67 (5) 75.89 (16) 68.92 (10) 52.17 (18) 76.35
NB‡* 85.29 81.25 100 60 66.67 88.06 86.67 32.14 79.73 52.17 73.2
k-NN‡* 67.65 75 86.67 30 63.33 88.06 93.33 75.89 64.86 34.78 67.96
PAM* 97.06 (44) 78.13 (13) 93.33 (62) 95 (285) 93.33 (4822) 100 (614) 90 (3949) 93.75 (3338) 87.84 (2008) 56.52 (1253) 88.5
1-vs-1-SVM‡* 79.41 87.5 100 100 83.33 97.01 100 84.82 83.78 65.22 88.11
Leuk1 Lung1 Leuk2 SRBCT Breast Lung2 DLBCL Leuk3 Cancers GCM Average
TSG improve upon HC−k−TSP TSG improve upon HC−TSP
%Increase in Accur
acy
0
5
10
15
20
25
Percent
of
improvem
ent
in
accuracy
for
TSG
over
TSP
family
classifiers
in
multi-class
classifica
tion
.
BMC
Medical
Genomics
2013,
6
(Suppl
1):S3
tral.com/1755
-8794/6/S1/S
3
Page
11
of
10 datasets TSG used more genes than HC-k-TSP and in 5 datasets TSG used fewer genes than HC-k-TSP. On average across all 10 datasets, TSG uses 51 genes and HC-k-TSP uses 53.4 genes. PAM consistently uses a lot more genes than other classifiers except in Lung1 data. In fact, the number of genes used by PAM is in the mag-nitude of thousands in order to reach comparable accu-racy as TSG. Recall that on average TSG, PAM and SVM have comparable accuracy for independent test data and HC-k-TSP has lower performance. Now combining the accuracy and the number of genes used, TSG outper-forms the rest in that it uses smaller number of genes to reach high accuracy. Smaller number of genes makes it feasible to perform follow-up studies and further experi-mental verification after the informative genes selection.
Interpretation of the TSG classifier
The TSG classifier has an easy interpretation. Recall that the main rule to classify a sample is based on which class gives the highest Chisquare statistic value when the sam-ple is assigned to that class (see section 2.3). Note that there is a one to one correspondence between the Chis-quare statistic values and the degree of departure from
independence between the class label and the column variables in Table 2. The bigger the Chisquare statistic, the further the departure is from independence and vice versa. So the class label assignment tries to maximize the dependence between the classes and the selected vari-ables for a given set of training data and a test sample.
The TSG classifier has the same interpretation as the TSP classifier. In particular, suppose the expression values for these two genes are E1and E2for a sample, the prediction of the class label of this sample depends on whether E1< E2. For Leuk, CNS, and pros3 data, TSG achieved accuracy 98.61, 97.06, and 100 for these three datasets respectively using 2 genes. Also using 2 genes, TSP only achieved 93.80, 77.90, 97.00 in LOOCV accu-racy for these three datasets. Therefore, TSG finds genes that are even more informative than TSP classifier in these three datasets. When the selected informative genes have more than 2 genes, then the class prediction of a sample depends on all pairwise comparisons of the expression values Ei1,· · ·,Eik for the selected genes i1, i2,..., ik from this sample, i.e., which of the inequalities
Ei1 ≥Ei2, Ei1≥Ei2,..., Eik−1<Eik, Eik−1 ≥Eik are true. Due to the similar interpretation to the TSP family
1 1 1 1 1 1 1 1 1
0
102
03
04
05
0
Number of Genes Used in Binary Classifiers
2 2 2 2 2 2
2
2 2
3 3
3
3 3
3 3
3 3
4 4 4 4 4 4 4 4
4
5
5 5
5 5
5
5
Colon Leuk CNS DLBCL Lung Pros1 Pros2 Pros3 GCM
1 1 1 1 1 1 1
1
1 1
0
20
40
60
80
100
120
140
Number of Genes Used in Multiclass Classifiers
2 2
2
2
2 2
2 2
2 2
3
3 3
3
3 3
3 3
3 3
4 4 4 4 4 4 4 4
4 4
5
5 5
Leuk1 Lung1 Leuk2 SRBCT Breast Lung2 DLBCL Leuk3
Cancer
s
GCM
classifiers, we do not reiterate for TSG and refer the readers to Tan et al. [3] for details.
Conclusions
In this article, we presented the TSG classifier, an improved version of TSP family classifiers for both binary and multi-class cancer classification. The TSP family clas-sifiers only consider even number of genes and the gene selection process is based on the marginal comparison of pairwise expression values without honoring the fact that some of the marginally important genes may have similar effects as others and therefore could be redundant. We solved aforementioned shortcomings of TSP family classi-fiers by allowing both even and odd number of genes through newly defined score functions and a new selection algorithm. After some genes have been selected, our gene selection process assesses the importance of additional genes by considering the overall contribution of all the genes included in the informative set. As the joint effects of multiple genes are evaluated together, we expect that the final list of genes selected by TSG is more parsimo-nious than k-TSP and HC-k-TSP classifiers.
The TSG classifier is in a simple unified form for both binary and multi-class cases. This is different from the TSP family classifiers in that three binary to multi-class extension schemes (1-vs-1, 1-vs-others, hierarchical clas-sification) lead to three different classifiers. As reported in Tan et al [3], the hierarchical classification scheme extension HC-TSP and HC-k-TSP perform the best out of the three schemes. Our TSG classifier is in a single form and in general has equal performance or outper-forms k-TSP, HC-TSP and HC-k-TSP in the 19 datasets in terms of accuracy and number of genes used. We also compared the performance of TSG with PAM and SVM. In binary classification problems, TSG has better LOOCV accuracy than PAM and SVM; in multi-class problems, TSG, PAM, and SVM give comparable accu-racy for independent test data. All three classifiers are more accurate than TSP family classifiers. In terms of the number of genes used, TSG clearly uses much less num-ber of genes than PAM and SVM. PAM often selects thousands of genes in its final classifier and SVM uses the entire set of genes.
An obvious advantage of the TSG as well as the TSP family classifiers is that they are based on the simple pair-wise comparisons of expression values between genes from the same sample. Such comparison is robust to monotone transformation and eliminates the concern about variations among different patients, platforms, or bias from preprocessing different samples. Therefore, we expect that the results from TSG are more reliable and robust compared to many other methods that pool the data from different samples to filter genes.
List of abbreviations used
TSP: top scoring pair; k-TSP: k top scoring pairs; HC-TSP: multi-class extension of TSP with hierarchical classification scheme; HC-k-TSP: multi-class extension of k-TSP with hierarchical classification scheme; SVM: Support Vector Machine classification; PAM: Prediction Analysis of Microarray; LOOCV: leave-one-out cross validation.
Authors’contributions
ZY and HZ developed the algorithm; HZ performed gene selection and classification for the microarray data; HW conducted some of the comparisons, summarized the results and drafted the manuscript; HZ and ZD designed the software; ZY and MC provided discussion and revised the manuscript for this study. All authors have approved the final version of the manuscript.
Competing interests
The authors declare that they have no competing interests.
Acknowledgements
The research was supported by a grant from the Science Foundation for Distinguished Young Scholars of Hunan Province, China (No. 10JJ1005) to ZY, the Scientific Research Fund of Hunan Provincial Education Department (No. 11C0654) to HZ, and a grant from the Simons Foundation to HW (#246077).
This article has been published as part ofBMC Medical GenomicsVolume 6 Supplement 1, 2013: Proceedings of the 2011 International Conference on Bioinformatics and Computational Biology (BIOCOMP’11). The full contents of the supplement are available online at http://www.biomedcentral.com/ bmcmedgenomics/supplements/6/S1. Publication of this supplement has been supported by the International Society of Intelligent Biological Medicine.
Author details
1Department of Statistics, Kansas State University, Manhattan, KS 66506, USA;
this work was done while Haiyan Wang was on sabbatical leave at Hunan Provincial Key Laboratory of Crop Germplasm Innovation and Utilization, Changsha 410128, China.2Hunan Provincial Key Laboratory of Crop Germplasm Innovation and Utilization, Changsha 410128, China.3College of
Information Science and Technology, Hunan Agricultural University, Changsha 410128, China.4College of Bio-safety Science and Technology,
Hunan Agricultural University, Changsha 410128, China.5USDA-ARS and Department of Entomology, Kansas State University, Manhattan, KS 66506, USA.
Published: 23 January 2013
References
1. Tibshirani R, Hastie T, Narasimhan B, Chu G:Diagnosis of multiple cancer
types by shrunken centroids of gene expression.Proc Natl Acad Sci USA
2002,99:6567-6572.
2. Geman D, d’Avignon C, Naiman D, Winslow R:Classifying Gene Expression
Profiles from Pairwise mRNA Comparisons.Statistical Applications in
Genetics and Molecular Biology2004, doi: 10.2202/1544-6115.1071. 3. Tan AC, Naiman DQ, Xu L, Winslow RL, Geman D:Simple decision rules for
classifying human cancers from gene expression profiles.Bioinformatics
2005,21:3896-3904.
4. Chang CC, Lin CJ:LIBSVM: a library for support vector machines.ACM Transactions on Intelligent, Systems and Technology2011,2(27):1-27. 5. Li T, Zhang C, Ogihara M:A comparative study of feature selection and
multiclass classification methods for tissue classification based on gene
expression.Bioinformatics2004,20:2429-2437.
6. Yang K, Cai Z, Li J, Lin G:A stable gene selection in microarray data
analysis.BMC Bioinformatics2006,7:228.
7. Ding C, Peng H:Minimum redundancy feature selection from microarray
gene expression data.J Bioinform Comput Biol2005,3(2):185-205.
8. Ooi CH, Chetty M, Teng SW:Differential prioritization between relevance and redundancy in correlation-based feature selection techniques for
multiclass gene expression data.BMC Bioinformatics2006,7:320.
9. Zhang JG, Deng HW:Gene selection for classification of microarray data
10. Wei X, Li K:Exploring the within and between class correlation
distributions for tumor classification.Proc Natl Acad Sci USA2010,
107(15):6737-6742.
11. Liu Q, Sung A, Chen Z, Chen L, Liu J, Qiao M, Wang Z, Huang X, Deng Y:
Gene selection and classification for cancer microarray data based on
machine learning and similarity measures.BMC Genomics2011,12(Suppl
5):S1, doi:10.1186/1471-2164-12-S5-S1.
12. Guyon I, Weston J, Barnhill S, Vapnik V:Gene selection for cancer
classification using support vector machines.Machine learning2002,
46:389-422.
13. Rakotomamonjy A:Variable selection using svm based criteria.J Mach Learn Res2003,3:1357-1370.
14. Dίaz-Uriarte R, Alvarez de Andrés S:Gene selection and classification of
microarray data using random forest.BMC Bioinformatics2006,7:3,
doi:10.1186/1471-2105-7-3.
15. Ho TK:The random subspace method for constructing decision forests.
IEEE Transactions on Pattern Analysis and Machine Intelligence1998,
20(8):832-844.
16. Li X, Zhao H:Weighted random subspace method for high dimensional data classification.Statistics and its Interface2009,2:153-159.
17. Alizadeh AA, Eisen MB, Davis RE, Ma C, Lossos IS, Rosenwald A, Boldrick JC, Sabet H, Tran T, Yu X, Powell JI, Yang L, Marti GE, Moore T, Hudson J Jr, Lu L, Lewis DB, Tibshirani R, Sherlock G, Chan WC, Greiner TC, Weisenburger DD, Armitage JO, Warnke R, Levy R, Wilson W, Grever MR, Byrd JC, Botstein D, Brown PO, Staudt LM:Distinct types of diffuse large
B-cell lymphoma identified by gene expression profiling.Nature2000,
403:503-511.
18. Alon U, Barkai N, Notterman DA, Gish K, Ybarra S, Mack D, Levine AJ:Broad patterns of gene expression revealed by clustering analysis of tumor
and normal colon tissues probed by oligonucleotide arrays.Proc Natl
Acad Sci USA1999,96:6745-6750.
19. Golub TR, Slonim DK, Tamayo P, Huard C, Gaasenbeek M, Mesirov JP, Coller H, Loh ML, Downing JR, Caligiuri MA, Bloomfield CD, Lander ES:
Molecular classification of cancer: class discovery and class prediction by
gene expression monitoring.Science1999,286(5439):531-537.
20. Pomeroy SL, Tamayo P, Gaasenbeek M, Sturla LM, Angelo M, McLaughlin ME, Kim JY, Goumnerova LC, Black PM, Lau C, Allen JC, Zagzag D, Olson JM, Curran T, Wetmore C, Biegel JA, Poggio T, Mukherjee S, Rifkin R, Califano A, Stolovitzky G, Louis DN, Mesirov JP, Lander ES, Golub TR:Prediction of central nervous system embryonal
tumour outcome based on gene expression.Nature2002,415:436-442.
21. Shipp MA, Ross KN, Tamayo P, Weng AP, Kutok JL, Aguiar RC,
Gaasenbeek M, Angelo M, Reich M, Pinkus GS, Ray TS, Koval MA, Last KW, Norton A, Lister TA, Mesirov J, Neuberg DS, Lander ES, Aster JC, Golub TR:
Diffuse large B-cell lymphoma outcome prediction by gene-expression
profiling and supervised machine learning.Nat Med2002,8:68-74.
22. Gordon GJ, Jensen RV, Hsiao LL, Gullans SR, Blumenstock JE, Ramaswami S, Richards WG, Sugarbaker DJ, Bueno R:Translation of microarray data into clinically relevant cancer diagnostic tests using gene expression ratios in
lung cancer and mesothelioma.Cancer Res2002,62:4963-4967.
23. Singh D, Febbo PG, Ross K, Jackson DG, Manola J, Ladd C, Tamayo P, Renshaw AA, D’Amico AV, Richie JP, Lander ES, Loda M, Kantoff PW, Golub TR, Sellers WR:Gene expression correlates of clinical prostate
cancer behaviour.Cancer Cell2002,1:203-209.
24. Stuart RO, Wachsman W, Berry CC, Wang-Rodriguez J, Wasserman L, Klacansky I, Masys D, Arden K, Goodison S, McClelland M, Wang Y, Sawyers A, Kalcheva I, Tarin D, Mercola D:In silico dissection of
cell-type-associated patterns of gene expression in prostate cancer.Proc Natl Acad
Sci USA2004,101:615-620.
25. Welsh JB, Sapinoso LM, Su AI, Kern SG, Wang-Rodriguez J, Moskaluk CA, Frierson HF Jr, Hampton GM:Analysis of Gene Expression Identifies Candidate Markers and Pharmacological Targets in Prostate Cancer.
Cancer Res2001,61:5974-5978.
26. Ramaswamy S, Tamayo P, Rifkin R, Mukherjee S, Yeang CH, Angelo M, Ladd C, Reich M, Latulippe E, Mesirov JP, Poggio T, Gerald W, Loda M, Lander ES, Golub TR:Multiclass cancer diagnosis using tumor gene
expression signatures.Proc Natl Acad Sci USA2001,98:15149-15154.
27. Beer DG, Kardia SL, Huang CC, Giordano TJ, Levin AM, Misek DE, Lin L, Chen G, Gharib TG, Thomas DG, Lizyness ML, Kuick R, Hayasaka S, Taylor JM, Iannettoni MD, Orringer MB, Hanash S:Gene-expression profiles predict
survival of patients with lung adenocarcinoma.Nat Med2002,8:816-824.
28. Armstrong SA, Staunton JE, Silverman LB, Pieters R, den Boer ML, Minden MD, Sallan SE, Lander ES, Golub TR, Korsmeyer SJ:MLL translocations specify a distinct gene expression profile that
distinguishes a unique leukemia.Nat Genet2002,30:41-47.
29. Khan J, Wei JS, Ringnér M, Saal LH, Ladanyi M, Westermann F, Berthold F, Schwab M, Antonescu CR, Peterson C, Meltzer PS:Classification and diagnostic prediction of cancers using gene expression profiling and
artificial neural networks.Nat Med2001,7:673-679.
30. Perou CM, Sørlie T, Eisen MB, van de Rijn M, Jeffrey SS, Rees CA, Pollack JR, Ross DT, Johnsen H, Akslen LA, Fluge O, Pergamenschikov A, Williams C, Zhu SX, Lønning PE, Børresen-Dale AL, Brown PO, Botstein D:Molecular
portraits of human breast tumours.Nature2000,406:747-752.
31. Bhattacharjee A, Richards WG, Staunton J, Li C, Monti S, Vasa P, Ladd C, Beheshti J, Bueno R, Gillette M, Loda M, Weber G, Mark EJ, Lander ES, Wong W, Johnson BE, Golub TR, Sugarbaker DJ, Meyerson M:Classification of human lung carcinomas by mRNA expression profiling reveals
distinct adenocarcinoma subclasses.Proc Natl Acad Sci USA2001,
98:13790-13795.
32. Yeoh EJ, Ross ME, Shurtleff SA, Williams WK, Patel D, Mahfouz R, Behm FG, Raimondi SC, Relling MV, Patel A, Cheng C, Campana D, Wilkins D, Zhou X, Li J, Liu H, Pui CH, Evans WE, Naeve C, Wong L, Downing JR:Classification, subtype discovery, and prediction of outcome in pediatric acute
lymphoblastic leukemia by gene expression profiling.Cancer Cell2002,
1:133-143.
33. Su AI, Welsh JB, Sapinoso LM, Kern SG, Dimitrov P, Lapp H, Schultz PG, Powell SM, Moskaluk CA, Frierson HF Jr, Hampton GM:Molecular classification of human carcinomas by use of gene expression
signatures.Cancer Res2001,61:7388-7393.
doi:10.1186/1755-8794-6-S1-S3
Cite this article as:Wanget al.:TSG: a new algorithm for binary and multi-class cancer classification and informative genes selection.BMC Medical Genomics20136(Suppl 1):S3.
Submit your next manuscript to BioMed Central and take full advantage of:
• Convenient online submission
• Thorough peer review
• No space constraints or color figure charges
• Immediate publication on acceptance
• Inclusion in PubMed, CAS, Scopus and Google Scholar
• Research which is freely available for redistribution