Numerical simulation of the land use effect on
catchment flood mitigation
Kaihua Guo
1, Jingming Hou
1*, Feifei Liu
1, and Yangwei Zhang
1 1 State Key Laboratory of Eco-hydraulics in Northwest Arid Region of China, Xi'an University ofTechnology, Xi'an, 710048, China
[email protected], [email protected], [email protected], [email protected]
Abstract
Land use has significant impact on the hydrologic and hydraulic processes in a catchment. This work applies a hydrodynamic based numerical model to quantitatively investigate the land use effect on the flood patterns under various rainfall and terrain conditions in an ideal V-shaped catchment and a realistic catchment, indicating the land use could considerably affect the rainfall-flood process and such effect varies with the catchment terrain, land use scenario and the rainfall events. The rainfall-flood process is less sensitive for the side slope than the channel slope. For a channel slope lower than the critical value determined as 0.035-0.040 in this work, the forest located in the middle of the catchment slope could most effectively attenuate the flood peak. When the channel slope is higher than the critical one, forest located in the downstream of the catchment could most significantly mitigate the peak discharge. Moreover, the attenuation effect becomes more obvious as the rainfall becomes heavier. The research can help more reasonably guide the land use plan related to flood risk.
1
Introduction
As averaged temperatures increase globally, the probability for extreme rainfall events increases, leading to sever flood with more casualties and property loss and becomes a major concern world widely (Wilkinson et al., 2014). Land use could impact the rainfall-runoff process by changing the catchment property in term of hydrological and hydraulic parameters (Woldesenbet et al., 2016). It in turn influences the ecosystem, environment and local economy in a catchment, e.g. reconstruction of ecological environment and synthetic control of environment in large scale by changing cultivated land into grass land or forest are carried out in Loess Plateau, China, where suffering from severe flash floods and erosion (Zhang et al., 2017). Therefore, a better understanding and assessment of land use impacts
* Corresponding author. Tel.: +86-15809283371; fax: +86-029-83239907 E-mail address: [email protected]
Volume 3, 2018, Pages 858–865
on catchment rainfall-runoff process is of great importance. However, how to properly guide the land use to mitigate the flood in a more efficient way is still under investigation.
Recently, many researchers have paid attentions to the relations between land use and rainfall-runoff processes (Khoi and Suetsugi, 2014; Sun et al., 2016). As the catchment hydrology is a very complex process, choosing an effective methodology to investigate the impacts of land use change on storm-runoff is very important. Siriwardena et al. (2006) used a simple conceptual rainfall-storm-runoff model to investigate the effects of natural forest cover reduction on runoff. Liu et al. (2010) applied a grid-based physical-conceptual hydrological model to a catchment in Luxembourg and simulated the storm runoff contributions from different land use types. Other more complex fully-distributed hydrological models such as European Hydrological System Model (MIKE-SHE), and Soil and Water Assessment Tool (SWAT) become a common approach to assess the impact of land use on hydrological process. Although the above-mentioned hydrological models are capable of assessing such influence, the models may fail to accurately simulate the surface runoff process as they cannot reliably predict the important dynamical variables, velocities (Xia et al., 2017).
In this work, through two test cases, a hydrodynamic based numerical model is used to systematically and reliably investigate the effect of the land use patterns under different rainfall and topographic conditions on rainfall-flood processes. The results are analyzed to determine the optimal land use type for flood mitigation. The research can help guide the catchment and flood management.
2
Numerical model
The shallow water equations (SWEs) are derived from the conservation of mass and momentum by assuming hydrostatic pressure distribution. In a vector form, a conservation law of the 2D shallow water equations can be written as:
(1)
(2)
where represents the time; and are the Cartesian coordinates; denotes the vector of conserved flow variables consisting of , and , i.e. the water depth, unit-width discharges in -and -direction, respectively; and and and are depth-averaged velocities in - and -directions; and dare the flux vectors in - and - directions; is the source vector that may be further subdivided into slope source terms and friction source terms ; represents the bed elevation; is the bed roughness coefficient that is generally computed by with being the Manning coefficient. Moreover, the water level is also used in the numerical scheme adopted in this work. This section describes the numerical model for solving the SWEs within the framework of Godunov-type cell-centered finite volume scheme. The SWEs are discretized into algebraic equations by the finite volume method. The fluxes of mass and momentum are computed by
¶ +¶ +¶ =
¶ ¶ 
q f g
S
t x y
2
, / 2 ,
µ é ù é ù ê ú ê ú =ê ú =ê + ú ê ú ê ú ë û ë û x x x y y q h
q q f uq gh
q q 2
, / 2 é ù ê ú =ê ú ê + ú ë û y x y q g vq vq gh 2 2 2 2 / / é ù é ù ê ú ê ú ê ú = + =ê- ¶ ¶ ú ê+ - + ú ê- ¶ ¶ ú ê ú ë û ë- + û
b f b f
b
f i i
S S S gh z x C u u v
gh z y C v u v
t x y t
h qx qy x
y q uhx= q vhy= u v x
y f g x y S
b
S Sf Zb
f
C gn2/h1/3 n
the HLLC approximate Riemann solver (i.e. Harten, Lax, and van Leer approximate Riemann solver with contact wave restored). The slope source terms are evaluated by the slope flux method as proposed in (Hou et al., 2013). The friction source terms are calculated by the improved explicit method. The two-stage explicit Runge-Kutta approach is applied to update the flow variables to a new time level. When computing the fluxes and the slope source terms, the values at the midpoints of the cell edges are required. These values are evaluated by a novel 2D edge-based MUSCL scheme. The code is programmed by using C++ and CUDA which could run on GPUs to substantially accelerate the computation.
3
Evaluation of land use effects on rainfall-flood process in a
V-shaped catchment
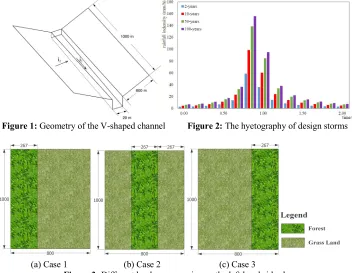
A classic theoretical V-shaped catchment (Overton and Brakensiek 1970), see Figure 1, is applied to systematically investigate the land use effects on rainfall-runoff process. There are two symmetrical side slopes and a channel in the middle of the catchment.
Figure 2 shows the land use conditions on the left hand side slope of the catchment, including forest and grass land. And the channel is considered as bare land. Land use scenarios of the other slope of the catchment are symmetrical. The different land use type can be presented by different hydrological and hydraulic parameters such as infiltration rate and Manning coefficient as shown in Table 1, where the values are based on those of Engman (1986). The design storms from Suide County, Shaanxi Province is employed as a rainfall input data with the return periods of 2, 50 years and the duration time of 2 hours (Figure 3). The storm formula is expressed as follows.
Figure 1: Geometry of the V-shaped channel Figure 2: The hyetography of design storms
(a) Case 1 (b) Case 2 (c) Case 3
(3)
where represents rainfall intensity, mm/min; is the return periods, year; denotes rainfall duration, min.
Regarding the same land use pattern, different catchment slope and channel slope will lead to different flow pattern, because the flow momentum is very sensitive to the terrain especially for over land flows (Reaney et al., 2014). This work therefore looks at the land use effect on different terrain slopes. It is noteworthy that the model is validated before calculation.
3.1
Land use effects on flood mitigation for different channel slopes
Three land use patterns in the V-shaped catchment with the side slope of 0.57 and four different channel slopes termed as i1 of 0.01 (Scenario 1), 0.05 (Scenario 2) and 0.08 (Scenario 3) are used in the
simulation. As plotted in Figure 2, three land use patterns which divide a slope plane into three parts consisting of forest or grass land are employed in this section. The model is run under the rainfall condition with 2 return periods (2, and 50 years). The flow discharge at the catchment outlet is recorded in this event.
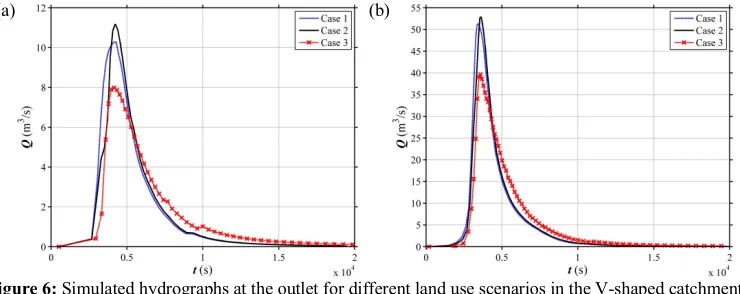
The computed hydrographs at the outlet under different land use and slope scenarios are illustrated in Figures 4 to 6. The simulated peak discharges corresponding to the different land use scenarios exhibit high variations. For Scenario 1 (i1=0.01), the Case 2 shows more obvious effects in mitigating
the peak discharge compared with the Case 1 and Case 3. The Case 3 has the highest peak discharge. The peak discharge of Case 2 can reduce by 7.02%, and 4.22% for the rainfall events with different return periods, respectively, in contrast to Case 1. Comparing to Case 3, the peak discharge of Case 2 reduces by 19.58%, and 13.52% for the rainfall events with different return periods, respectively. However, for Scenario 2 (i1=0.05), the results clearly demonstrate that the Case 3 mitigates the peak
discharge in a most efficient way. The peak discharge of Case 3 can reduce by 5.87%, and 7.93% for the rainfall events with different return periods, respectively, in comparison to Case 1. The reduction percentage between Case 3 and Case 2 reaches 10.22%-15.10% for different rainfall events. For Scenario 3 (i1=0.08), the same phenomenon as Scenario 3 is observed.
In a sum, with the channel slope (i1) lower than 0.05, the forest located in the middle of the catchment
slope could most effectively attenuate the flood, while that in the downstream causes the most sever flood. When the channel slope (i1) higher than 0.05, the forest located in the downstream of the
catchment slope mitigates the most peak discharge, meanwhile, that in the upper and middle part cause higher flood risk. Meanwhile, the flood mitigation rate becomes higher as the rainfall becomes heavier. The same phenomenon can be found for any rainfall events, so the 50-year rainfall event is selected to investigate the land use effects in the following sections.
3.2
Land use effects on flood mitigation for different side slopes
On the basis of the previous section, the rainfall-flood processes of the V-shaped catchment with the different side slopes (i2) classified into two scenarios (Scenario Ⅰ: i2 =0.58, Scenario Ⅱ: i2 =1.19)
are simulated. Figure 7 shows the simulated discharge at the outlet for different land use scenarios under 100-year rainfall. For the two side slope scenarios with the same channel slope (i1) of 0.02, the peak
flood discharge reduction in Case 2 can reach 6.37%-17.87% in contrast to other land use scenarios.
0.8898 12.10 (1 1.375685 lg )
( 12.016)
´ + ´
=
+
p i
t
i p t
Table 1: The parameters for different land use
For that with the same channel slope (i1) of 0.05, the peak flood discharge can be decreased by 9.20%
and 7.44% for Case 3, respectively for three side slope scenarios, comparing with Case 1. The peak flood discharge can be mitigated by 10.72% and 9.02% for Case 3, respectively, compared to Case 2. A similar situation occurs for channel slope (i1) of 0.08.
From the analysis, a critical channel slope (i1c) is defined in this work to determine the optimal type
of land use on side slopes, i.e. when the i1 is lower than i1c, the forest located in the middle of the
(a) (b)
Figure 4: Simulated hydrographs at the outlet for different land use scenarios in the V-shaped catchment with i1 =0.02 under (a) 2-year, (b) 50-year rainfall event
(a) (b)
Figure 5: Simulated hydrographs at the outlet for different land use scenarios in the V-shaped catchment with i1 =0.05 under (a) 2-year, (b) 50-year rainfall event
(a) (b)
catchment is the optimal land use type for flood mitigation. Otherwise, the downstream forest could mitigate the most of the flood. After calculation, the i1c is 0.035 and 0.038, respectively for Scenarios Ⅰ and Ⅱ
4
Land use effect simulation on flood mitigation in
Wangmaogou catchment
Wangmaogou catchment is applied to calibrate and validate the numerical model. It is a semiarid loessal hillslope with a catchment area of 5.9 km2, experienced cultivated land changed into grassland
or forestland. The catchment is located in Suide County, Shaanxi Province, China. Through calculation, the average channel slope (i1) of the Waomao catchment is about 0.05 and the average side slope (i2) is
about 0.70. The infiltration rate and Manning coefficient of different land use are based on those of Engman (1986). It is noteworthy that the model is validated before calculation.
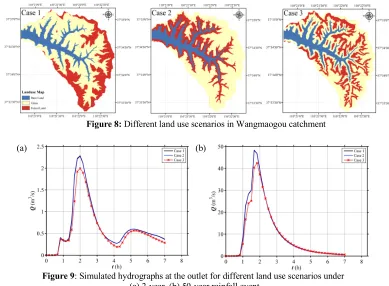
As shown in Figure 8, the land use data are reclassified, the channel of the catchment is bare land and the slopes are composed by two types of land use, i.e. grass land and forest. The forest area on the slope are the same in the three different land use types and located in the uper (Case 1), middle (Case 2) and lower (Case 3) part of slope respectively, accounting for 1/3 of the slope area. The design storms from Suide County, Shaanxi Province with different return periods (2, and 50 years) and three land use scenarios are imported into the model to simulate the runoff process.
The discharge process at the outlet of Wangmaogou catchment and the peak discharge among different land use scenarios (Case 1, Case 2 and Case 3) are presented in Figure 9. The results clearly demonstrate that Case 3 mitigates the peak discharge in the most effective way. Comparing to Case 1, the peak discharge of Case 3 can reduce by 12.28% and 13.02% for the rainfall events with the return periods of 2, and 50 years, respectively. The reduction percentage between Case 2 and Case 3 reaches
(a) i1=0.02 i2=0.58 (b) i1=0.05 i2=0.58 (c) i1=0.08 i2=0.58
(d) i1=0.02 i2=1.19 (e) i1=0.05 i2=1.19 (f) i1=0.08 i2=1.19
12.66% and 13.26%, respectively. In other words, the forest located in the downstream of the catchment slope could most significantly mitigate the peak discharge, while that in the upper and middle part causes higher flood risk. The computed land use effect on flood is very similar to that in the V-shaped catchment with the slopes i1 =0.05 and i2 =0.80, proving the universality and reasonability of the
research.
5
Conclusion
Through using a hydrodynamic based numerical model, this work quantitatively investigates the land use effect on the flood patterns in catchment, finding that different land use could cause different rainfall-flood process and the effect vary with the catchment terrain, land use scenario and the rainfall events.
l The effect of the side slope gradient is less sensitive than that of the channel slope for the same land use and rainfall patterns;
Figure 8: Different land use scenarios in Wangmaogou catchment
(a) (b)
Figure 9: Simulated hydrographs at the outlet for different land use scenarios under (a) 2-year, (b) 50-year rainfall event
Table 2: Infiltration rate (mm/h) and Manning coefficient (s/ m1/3) under different land use types
Land use Bare land Orchard Forest Grass land Transportation land Rural land Terrace Water Infiltration
rate
(mm/h) 2.480 3.12 4.120 3.250 0.00 0.50 2.60 0.00 Manning
l When the channel slope (i1) is smaller than the critical channel slope termed as i1c determined as
0.035-0.040, the forest located in the middle of the catchment slope could most effectively attenuate the flood peak, while that in the downstream causes the most sever flood;
l On the contrary, if the channel slope (i1) is higher than critical channel slope, the forest located in
the downstream of the catchment slope mitigates the peak discharge in a most effective way, while that in the upper and middle part have slight difference;
l Meanwhile, the flood mitigation extent becomes higher as the rainfall becomes more intense, indicating the optimal land use has better performance for heavier flood.
The research could be used to guide the land use plan in a catchment with consideration of the flood mitigation, especially for the ongoing ecological engineering constructions in some provinces in China suffering from flash floods and soil erosion.
References
M. Wilkinson, P. Quinn, N. Barber, J. Jonczyk. (2014). A framework for managing runoff and
pollution in the rural landscape using a Catchment Systems Engineering approach. Science of The
Total Environment, 468-469, 1245-1254.
T. A. Woldesenbet, N. A. Elagib, L. Ribbe, J. Heinrich. (2016). Hydrological responses to land use/cover changes in the source region of the Upper Blue Nile Basin, Ethiopia. Science of the Total Environment, 575, 724.
L. Zhang, R. Karthikeyan, Z. Bai, R. Srinivasan. (2017). Analysis of streamflow responses to climate variability and land use change in the Loess Plateau region of China. Catena, 154, 1-11.
D. N. Khoi, T. Suetsugi. (2014). The responses of hydrological processes and sediment yield to
land-use and climate change in the Be River Catchment, Vietnam. Hydrological Processes, 28,
640-652.
N. Sun, J. Yearsley, M. Baptiste, Q. Cao, D. P. Lettenmaier, B. Nijssen. (2016). A spatially distributed model for assessment of the effects of changing land use and climate on urban stream quality. Hydrological Processes, 30, 4779-4798.
L. Siriwardena, B. L. Finlayson, T. A. Mcmahon. (2006). The impact of land use change on catchment hydrology in large catchments: The Comet River, Central Queensland, Australia. Journal of Hydrology, 326, 199-214.
Y. B. Liu, S. Gebremeskel, F. De Smedt, L. Hoffmann, L. Pfister. (2010). Predicting storm runoff from different land-use classes using a geographical information system-based distributed model. Hydrological Processes, 20, 533-548.
X. Xia, Q.Liang, X. Ming, J. Hou. (2017). An effcient and stable hydrodynamic model with novel source term discretization schemes for overland flow and flood simulations. Water Resources Research, 53(5), 3730-3759.
J. Hou, F. Simons, M. Mahgoub, R. Hinkelmann. (2013). A robust well-balanced model on unstructured grids for shallow water flows with wetting and drying over complex topography. Computer Methods in Applied Mechanics and Engineering, 257, 126-149.
D. E. Overton, D. L. Brakensiek, A kinematic model of surface runoff response, in: In: Proceedings of the Wellington Symposium. Unesco/IAHS, Paris, 1970.
E. T. Engman. (1986). Roughness Coeficients for Routing Surface Runoff. Journal of Irrigation & Drainage Engineering, 112, 39-53.