DEMOGRAPHIC RESEARCH
A peer-reviewed, open-access journal of population sciences
DEMOGRAPHIC RESEARCH
VOLUME 32, ARTICLE 36, PAGES 1031–1048
PUBLISHED 20 MAY 2015
http://www.demographic-research.org/Volumes/Vol32/36/ DOI: 10.4054/DemRes.2015.32.36
Formal Relationship 25
The Gompertz force of mortality in terms of
the modal age at death
Trifon I. Missov
Adam Lenart
Laszlo Nemeth
Vladimir Canudas-Romo
James W. Vaupel
c
2015 Trifon I. Missov et al.
1 Relationship 1032
2 Proof of the relationship 1032
3 History and related results 1033
4 Application to statistical estimation 1035
5 Values ofa,bandMfor human populations 1040
6 Conclusion 1043
7 Acknowledgements 1044
The Gompertz force of mortality in terms of the modal age at death
Trifon I. Missov1,2
Adam Lenart3
Laszlo Nemeth1
Vladimir Canudas-Romo3
James W. Vaupel1,3,4
Abstract
BACKGROUND
The Gompertz force of mortality (hazard function) is usually expressed in terms ofa, the initial level of mortality, andb, the rate at which mortality increases with age.
OBJECTIVE
We express the Gompertz force of mortality in terms ofband the old-age modal age at deathM, and present similar relationships for other widely-used mortality models. Our objective is to explain the advantages of using the parameterization in terms ofM.
METHODS
Using relationships among life table functions at the modal age at death, we express the Gompertz force of mortality as a function of the old-age mode. We estimate the cor-relation between the estimators of old (aandb) and new (M andb) parameters from simulated data.
RESULTS
When the Gompertz parameters are statistically estimated from simulated data, the cor-relation between estimated values ofbandM is much less than the correlation between estimated values ofaandb. For the populations in the Human Mortality Database, there is a negative association betweenaandband a positive association betweenM andb.
1Max Planck Institute for Demographic Research, Konrad-Zuse-Str. 1, 18057 Rostock, Germany. Trifon I.
Missov and Adam Lenart contributed equally to this work.
2Institute of Sociology and Demography, University of Rostock, Ulmenstr. 69, 18057 Rostock, Germany.
3Max Planck Odense Center on the Biodemography of Aging, Institute of Public Health, University of
South-ern Denmark, J. B. Winsløws Vej 9, 5000 Odense, Denmark.
CONCLUSIONS
UsingM, the old-age mode, instead ofa, the level of mortality at the starting age, has two major advantages. First, statistical estimation is facilitated by the lower correlation between the estimators of model parameters. Second, estimated values ofM are more easily comprehended and interpreted than estimated values ofa.
1. Relationship
The Gompertzforce of mortality(orhazard) at agex,µ(x), has been expressed, at least since Greenwood (1928), as
(1) µ(x) =µ(x;a, b) =aebx,
whereadenotes the level of mortality at the initial age, i.e., atx= 0, andbis the rate of mortality increase over age. Note thatx= 0refers to the starting age of analysis and might not correspond to biological age 0. Ifxis to denote actual age, whilex0 is the starting age of analysis, thenxshould be replaced byx−x0in (1) and all subsequent equivalent formulas.
Gompertz (1825) used the equivalent to (1) notation
(2) µ(x) =µ(x;a, c) =acx,
withb being the natural logarithm of c. Alternatively, following Gumbel (1958), the Gompertz force of mortality can be represented as a function ofM andbas
(3) µ(x) =µ(x;M, b) =beb(x−M),
whereM is the old-age modal age at death, or for short,modal age at death. In other words, assuming constant age groups for populations with senescent mortality,M is the age at which the highest number of deaths occurs beyond the high number of deaths in the first years of life. This article provides a short proof for (3) and discusses advantages of using a Gompertz parameterization viaM (3) instead ofa(1).
2. Proof of the relationship
For any hazardµ(x), the probability density function (p.d.f.) of deathsd(x) =µ(x)`(x), where`(x)denotes the survival function, reaches a maximum at the modal age at death. Hence,
(4) d
dxd(x) = 0 ⇔
d
dxd(x)
d(x) = 0 ⇔
d
dxµ(x)
Rearranging terms, atx = M the force of mortality equals its relative derivative with respect to age
(5) µ(x) =dµ(x)/dx
µ(x)
Using (5), one can deriveM for various mortality models. In the case of the Gompertz force of mortality given in (1), the relationship in (5) implies that the mode is
(6) M =1
b ln b a.
From (6) the parameteracan be expressed in terms ofM andbas
(7) a=be−bM.
Substituting (7) in (1), yields (3).
An alternative proof could be based on the fact that in the Gompertz frameworkM
maximizes the p.d.f.
d(x) =d(x;a, b) =aexpnbx−a
b(e
bx−1)o.
Solving
(8) M = arg max
x n
aexpnbx−a
b(e bx
−1)oo
yields (6), andacan be expressed in terms ofM andbby (7). Substituting (7) in (1), results in (3).
q.e.d.
3. History and related results
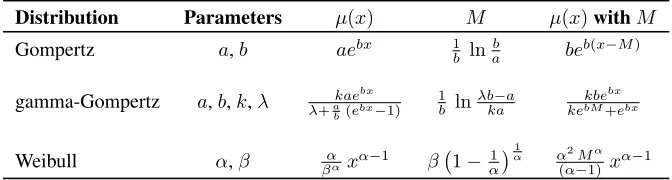
re-parameterized hazards for three distributions – the Gompertz, the gamma-Gompertz (Beard 1959; Vaupel, Manton, and Stallard 1979), and the Weibull – which represent three different aging patterns: the ones of exponential, logistic, and power-function haz-ard. Note that the re-parameterization of the gamma-Gompertz hazard via the old-age modeM results in the elimination of the scale parameterλof the gamma distribution. This is not surprising, as the gamma-Gompertz can be viewed as three-parameter model ofa/λ,b, andk
µ(x;a, b, k, λ) = kae
bx
λ+a
b(e
bx−1) =
k(a/λ)ebx
1 +a/λb (ebx−1) =µ(x;a/λ, b, k),
wherea/λcan be interpreted as a scale parameter.
To each one of the models presented in Table 1, a Makeham term c, capturing ex-trinsic mortality (Makeham 1860), can be easily added. In this case the re-parameterized hazards are augmented byc, andM designates the modal age at death of the senescent mortality component (see Horiuchi et al. 2013, p. 20 for a broader discussion). Easy re-parameterization of the Gompertz hazard fromµ(x;a, b)toµ(x;M, b)(or vice versa) is not possible in the presence of a Makeham term. Indeed, the mode of the Gompertz-Makeham model
MGM =1
b ln
b−2c+√b2−4bc 2a
does not offer a convenient expression to exchangeMGM anda.
Table 1: Modes of the Gompertz, gamma-Gompertz, and Weibull
distributions and the associated re-parameterized hazards:kandλ
are the shape and scale parameter of the gamma distribution, andα
andβare the shape and scale parameter of the Weibull distribution
Distribution Parameters µ(x) M µ(x)withM
Gompertz a,b aebx 1b lnab beb(x−M)
gamma-Gompertz a,b,k,λ λ+akaebx b(ebx−1)
1 b ln
λb−a ka
kbebx kebM+ebx
Weibull α,β α
βαx
α−1 β 1−1
α
α1 α2Mα
(α−1) x
The modal age of the life-table distribution of deaths has been suggested as an alterna-tive to life expectancy in studying longevity (Kannisto 2001; Cheung et al. 2005; Cheung and Robine 2007; Canudas-Romo 2008, 2010; Ouellette and Bourbeau 2011; Horiuchi et al. 2013). Life expectancy for Japanese females was estimated to be 86.4 years in 2012 (HMD 2014); most of the deaths in this population, however, will occur 6 years later around the modal age at death at about age 92 (HMD 2014). The burden in hospitals, nursing homes and public health is intensified at ages around the modal age at death. While life expectancy, the mean of the distribution of deaths, is highly dependent on the left tail of mortality at young ages, the modal age at death only depends on mortality at old ages (Kannisto 2001; Canudas-Romo 2010).
Research on the modal age at death has also considered measures of the dispersion of deaths around it. Instead of studying the standard deviation around the mean, i.e., around life expectancy, one can consider the standard deviation around the mode (Canudas-Romo 2008) or the standard deviation beyond the modal age (Kannisto 2001; Cheung et al. 2005; Cheung and Robine 2007; Thatcher et al. 2010; Horiuchi et al. 2013) as a measure to calculate the dispersion of the distribution of deaths. As suggested by Kannisto (2001), the standard deviation above the mode pertains to senescent mortality without much dis-tortion from non-senescent mortality beyond the modal age. In Kannisto’s study, con-firmed by Thatcher et al. (2010), the standard deviation above the mode has declined at a slower pace or stagnated in recent decades and the modal age at death has increased with life expectancy, suggesting that mortality is declining at roughly the same rate at all older ages, leading to a shift in the force of mortality to higher and higher ages (Vaupel 1986; Bongaarts 2005; Canudas-Romo 2008).
In sum, the modal age of death is a useful measure. It is more informative in many applications than the value of the force of mortality at age zero. Hence, expressing the Gompertz force of mortality in terms of bandM, as in equation (3), provides deeper understanding than expressing the Gompertz force of mortality in terms ofaandb. As explained below, the weaker relation betweenMandbcompared with the one betweena
andbis a second strong argument for usingM rather thana.
4. Application to statistical estimation
Expressing the Gompertz force of mortality in terms of the modeMcan be advantageous when fitting the Gompertz model to data. In its specification in (1), the Gompertz model is characterized by a pair of parametersaandb, whose maximum likelihood estimators are highly (negatively) correlated. This correlation originates in the basic structure of the Gompertz distribution, with a density of deaths
(9) d(x) =aexpnbx−a
b(e bx
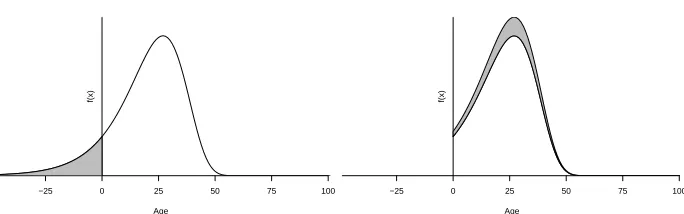
which can be viewed as a truncated version of the Gumbel distribution. If the density of the Gumbel distribution
(10) f(x;ν, β) = 1
β exp
−x−ν
β −exp
x−ν
β
, x∈R, ν∈R, β >0
is re-expressed withx=−xand is truncated at 0 (see Figure 1) with
(11) b= 1
β
and
(12) a=be−bν,
then (9) is the result (see, for example, Lenart and Missov 2015).
Figure 1: Truncation of the Gumbel distribution: redistribution of the
probability mass on the negative half-axis to the positive half-axis to obtain a Gompertz density
Age
−25 0 25 50 75 100
f(x)
Age
−25 0 25 50 75 100
Figure 2: Values of thea-bcorrelation (left panel) and theM-bcorrelation (right panel) for a set of values ofb(0–0.3), values ofa(0–0.1) and
values ofM (0–100)
0.1 0.2 0.3
0.00000001 0.000001 0.0001 0.01 0.1 a
b
r (−1,−0.99]
(−0.99,−0.98]
(−0.98,−0.97]
(−0.97,−0.95]
(−0.95,−0.93]
(−0.93,−0.9]
(−0.9,−0.85]
(−0.85,−0.7] 0.1 0.2 0.3
25 50 75 100
M
b
r (0.29,0.35]
(0.35,0.4]
(0.4,0.5]
(0.5,0.6]
(0.6,0.7]
(0.7,0.8]
(0.8,0.9]
(0.9,0.99]
Notes: The areas framed by a yellow border on the left panel and a black border on the right panel present the set of maximum-likelihood estimates fora,bandMfrom fitting a Gompertz model for all Human Mortality Database (HMD 2014) countries, years 1950 to last available, ages 50–90 (year-by-year estimates are presented in Figures 3 and 4). The range of the estimated parameters is10−7–0.002fora,0.06–0.15for b, and60–93forM.
The Gumbel distribution is a location-scale distribution withνdenoting the mode and
βbeing the scale parameter. The maximum likelihood estimators of Gumbel parameters are often independent. In general, location-scale distributions can be re-parameterized so that the maximum likelihood estimators are fully independent (Gupta and Sz´ekely 1994). The Gompertz parametersaandb, however, are often highly dependent on one another, as suggested by the expression in (12) and as documented in Table 4. This dependency arises because of the truncation of the Gumbel distribution and because of the use of
ainstead ofM as a parameter. Parameterization (3) partially overcomes this problem because it requires estimation ofM instead ofa(Lenart and Missov 2015). In mortality research, the “inverse relationship” between aand b is first identified by Strehler and Mildvan (1960, eq. 16, p. 16) who derive an age-independent formula that linkslnaand
bfrom a resulting dual representation of death rates (Strehler and Mildvan 1960, model on p. 15–16). They show empirical evidence for this relationship by fitting a Gompertz model to human mortality data. Figure 2 shows the correlations between the estimators of aandb(left panel), as well as M andb (right panel), for a set ofb-values (0–0.3) anda-values (0–0.1). Thea-values in the left panel can be transformed into respective
mortality, the absolute correlation between the maximum-likelihood estimators can be reduced from values above 0.95 to values below 0.4 by fitting model (3) instead of (1).
The estimation procedure is based on the assumption that death countsD(x)at agex
are Poisson-distributed with parameterE(x)µ(x), whereE(x)denotes exposure to risk (Brillinger 1986). As a result we maximize a Poisson log-likelihood
lnL=X
x
[D(x) lnµ(x)−E(x)µ(x)].
This is equivalent to fitting a Poisson regression withD(x)as the response, agexas a single covariate, andlnE(x)as an offset.
For a fixed band a list of values of M, a unique list of corresponding values ofa
can be determined. Table 4 compares – forb = 0.1and a list of values ofM and (cor-responding) values ofa– theM-bcorrelation (denoted byR) with the (corresponding)
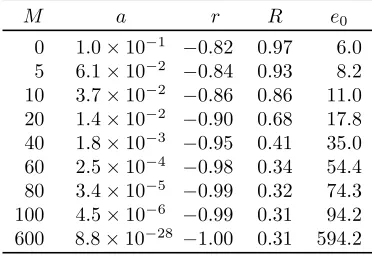
a-bcorrelation (denoted byr). For pertinent values of the adult modal age at death for modern humans, i.e.M = 60,80,100, the use of (3) instead of (1) pays off in terms of a much smaller correlation (in absolute terms) between the maximum-likelihood estimators of model parameters. Note that a parameterization
(13) µ(x) =µ(x;a, b, x∗) =a∗eb(x−x∗),
wherex∗ denotes an age (e.g., 70) that centers the distribution of deaths anda∗ is the death rate atx∗, can also reduce the correlation between the Gompertz parameters,a∗
andbin this case, as (1) is a log-linear GLM on age (see Dowd et al. 2010, model M5). The lower correlation between the estimators of M andb plays an important role when a Gompertz model is fitted to death rates that do not increase exponentially over the entire range of study, e.g., when background mortality (captured by the Makeham term) is not negligible or when at later ages there is evidence for mortality deceleration (captured by a gamma distribution with a single parameter γ = 1/k = 1/λ). In both casesb
is underestimated andais overestimated, whereas M is overestimated when frailty is neglected and underestimated when the Makeham term is omitted (Nemeth and Missov 2014). However, due to the smallerM-bcorrelation, the relative absolute bias inM is smaller than the one ina. The relative absolute bias is defined as
(14) ABθ=|
ˆ θ−θ|
θ ,
greater than errors in the estimates ofM. As a result, a model misspecification leads to a relatively small bias in estimated M in comparison to the bias in the estimateda. Nevertheless, if the target of inference is the force of mortality at a particular age, the relative absolute bias in the corresponding estimate will be the same, regardless of model parameterization.
Table 2: Relative absolute bias (averaged over 100 simulations) in estimated
b(row 2),a(row 3) andM (row 4) if a Gompertz model is fitted to
simulated data from a Gompertz-Makeham (a= 0.00002,b= 0.09)
withc-values given in the first row.
cterm 0.0004 0.002 0.004 0.006 0.008 0.01
bias inb 0.0759 0.2958 0.4563 0.5596 0.6326 0.6877
bias ina 0.9532 10.3378 38.7082 86.5563 151.3701 229.4323
bias inM 0.0082 0.0434 0.0929 0.1514 0.2221 0.3061
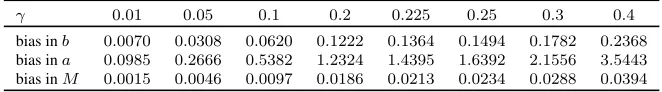
Table 3: Relative absolute (averaged over 100 simulations) bias in estimated
b(row 2),a(row 3) andM (row 4) if a Gompertz model is fitted to
simulated data from a gamma-Gompertz (a= 0.00002,b= 0.09)
withγ-values given in the first row
γ 0.01 0.05 0.1 0.2 0.225 0.25 0.3 0.4
bias inb 0.0070 0.0308 0.0620 0.1222 0.1364 0.1494 0.1782 0.2368
bias ina 0.0985 0.2666 0.5382 1.2324 1.4395 1.6392 2.1556 3.5443
bias inM 0.0015 0.0046 0.0097 0.0186 0.0213 0.0234 0.0288 0.0394
The Gompertz curve is often used to describe human mortality starting from age 30 or 50. In this case, when the Gompertz distribution is left-truncated at an age higher than 0, the modal age at death decreases by the same amount. For example, if the fitting of the Gompertz distribution to a population with a modal age at death of 80 starts not from age 0, but from age 30, the modal age at death of the truncated population will appear as 50. Equivalently, a higher starting age corresponds to a higher Gompertza. As indicated in Table 4, the Gompertz model formulated in terms ofM andbyields fewer correlated parameter estimates than the Gompertzaandbmodel whenever the modal age at death is not close to zero. Note that the value ofR approaches a limit of about 0.31 asM
Table 4: a-bcorrelation (r, column 3) vsM-bcorrelation (R, column 4) for a fixedb= 0.1, a list of fixedM-values (column 1), and a uniquely
determined, using (6), list of corresponding values ofa(column 2).
The last column contains the respective life expectanciese0
calculated by eq. (5), p. 30 in Missov and Lenart (2013).
M a r R e0
0 1.0×10⁻¹ −0.82 0.97 6.0
5 6.1×10⁻² −0.84 0.93 8.2
10 3.7×10⁻² −0.86 0.86 11.0
20 1.4×10⁻² −0.90 0.68 17.8
40 1.8×10⁻³ −0.95 0.41 35.0
60 2.5×10⁻⁴ −0.98 0.34 54.4
80 3.4×10⁻⁵ −0.99 0.32 74.3
100 4.5×10⁻⁶ −0.99 0.31 94.2
600 8.8×10⁻²⁸ −1.00 0.31 594.2
5. Values of
a
,
b
and
M
for human populations
Figure 3: The relationship ofaandbbased on estimated parameters for all HMD countries, years 1950 to last available, ages 50–90, by sex. The yellow curve results from applying a cubic regression spline to the data (we use the ‘gam’ function from the ‘mgcv’ R package: Wood 2012). ● ● ● ● ● ● ● ● ● ● ● ● ● ● ● ●● ● ● ●● ● ● ●● ● ● ● ● ● ● ● ● ● ● ● ● ● ● ● ● ● ● ● ● ● ● ● ● ● ● ● ● ● ● ● ● ● ● ● ● ● ● ● ● ● ● ● ● ● ● ● ● ● ● ● ● ● ● ● ● ● ● ● ● ● ● ● ● ● ● ● ● ● ● ● ● ● ● ● ● ● ● ● ● ● ● ● ● ● ● ● ● ● ● ● ● ● ● ● ● ● ● ● ● ● ● ● ● ● ● ● ● ● ● ● ●●●●●● ● ● ● ●● ● ● ● ● ●●● ● ● ● ● ● ● ● ● ● ● ● ● ●● ● ● ● ● ● ● ● ● ● ● ● ● ● ● ● ● ● ● ●● ● ● ● ● ● ● ● ● ● ● ● ● ● ● ● ● ● ● ● ● ● ● ● ● ● ● ● ● ● ● ● ● ● ● ● ● ● ● ● ● ● ● ● ● ● ● ● ● ● ● ●● ● ● ● ● ● ● ● ● ● ● ● ● ● ● ● ● ●● ●● ● ●●●● ● ● ● ● ● ● ● ● ● ● ● ● ● ●● ● ● ● ●●● ● ● ● ● ● ● ● ● ● ● ● ● ● ● ● ● ● ● ●● ● ● ● ● ● ● ● ● ● ● ● ● ● ● ● ● ● ● ● ● ● ● ● ● ● ● ● ● ● ● ● ● ● ● ● ● ● ● ● ● ● ● ● ● ● ● ● ● ● ● ● ● ● ● ● ● ● ● ● ● ● ●● ● ● ● ● ●● ● ● ● ● ●● ● ● ● ● ● ● ● ● ● ● ● ● ● ● ● ● ● ● ● ● ● ●●● ●● ● ● ● ● ● ●● ● ● ● ● ● ● ● ● ● ● ● ● ● ● ● ● ● ● ● ● ● ● ● ● ● ● ● ● ● ● ● ● ● ● ● ● ● ● ● ● ● ● ●● ● ● ●● ● ●● ● ● ● ● ●● ● ●● ●● ● ● ● ●● ● ● ● ● ● ● ● ● ● ● ● ● ● ● ● ● ● ● ●● ● ● ● ● ● ● ● ● ● ● ● ●●● ● ●● ●● ● ● ● ● ● ● ● ● ● ● ● ● ● ● ● ●● ● ● ● ● ● ● ● ● ● ● ● ● ● ● ● ● ● ● ● ● ● ● ● ● ● ● ● ● ● ● ● ● ● ● ● ● ● ● ● ● ● ● ● ● ● ● ● ● ● ● ● ● ● ● ● ● ● ● ● ● ● ● ● ● ● ● ● ● ● ● ● ● ● ● ● ● ● ● ● ● ● ● ● ● ● ● ● ● ● ● ● ● ● ● ● ● ● ● ● ● ● ● ● ● ● ● ● ● ● ● ● ● ● ● ● ● ● ● ● ● ● ● ● ● ● ● ● ● ● ● ● ● ● ● ● ● ● ● ● ● ● ● ● ● ● ● ● ● ● ● ● ● ● ● ● ● ● ● ● ● ● ● ● ● ● ● ● ● ● ● ● ● ● ● ● ● ● ● ● ● ● ● ● ● ● ● ● ● ● ● ● ● ● ● ● ● ● ● ●●●●●●●●● ● ● ● ● ● ● ● ● ● ● ● ● ● ● ● ● ● ● ● ● ● ● ●● ● ● ● ● ● ● ● ●● ● ● ● ●● ● ● ● ● ● ●● ● ●● ● ● ● ● ●●● ●● ● ● ● ● ● ● ● ● ● ● ● ● ● ● ● ● ● ● ● ● ● ● ● ● ● ● ●● ● ● ● ● ● ● ● ● ● ● ● ● ● ● ● ● ● ● ● ● ● ● ● ● ● ● ● ● ● ● ● ● ● ● ● ● ● ● ● ● ● ● ● ● ● ● ● ● ● ● ● ● ● ● ● ● ●● ● ● ● ● ● ● ● ● ● ● ● ● ● ● ● ● ● ● ● ● ● ● ● ● ● ● ● ● ● ● ●● ● ● ● ● ● ● ● ● ● ● ● ● ● ● ● ● ● ● ● ● ● ● ●● ● ● ● ● ● ● ● ● ● ● ● ● ● ● ● ● ● ● ● ● ● ● ● ● ● ● ● ● ● ● ● ● ● ● ● ● ● ● ● ● ● ● ● ● ● ● ● ● ● ● ● ● ● ● ● ● ● ● ● ● ● ● ● ● ● ● ● ● ● ● ● ● ● ● ● ● ● ● ● ● ● ● ● ● ● ● ● ● ● ● ● ● ● ● ● ● ● ● ● ● ● ● ● ● ● ● ● ● ● ● ● ● ● ● ● ● ● ● ● ● ● ● ● ● ● ● ● ● ● ● ● ● ● ● ● ● ● ● ● ● ● ● ● ● ● ● ● ● ● ● ● ● ● ● ● ● ●● ● ● ●● ● ● ● ● ● ●● ● ● ● ● ● ● ● ● ● ● ● ● ● ● ● ●● ● ● ● ● ● ● ● ● ● ● ● ● ● ● ● ● ● ● ● ● ● ● ●● ● ● ● ● ● ● ● ● ● ● ●● ● ● ● ● ● ● ● ●● ● ● ● ● ● ● ● ● ● ●●● ● ● ● ● ● ● ● ● ● ● ● ● ● ● ● ● ● ● ● ● ● ● ● ● ● ● ● ● ● ● ● ● ● ● ● ● ● ●● ● ● ● ●● ● ● ● ● ● ● ●●● ● ● ● ● ● ●● ● ● ● ● ● ● ● ● ● ● ● ● ● ● ● ● ● ● ● ● ● ● ● ● ● ● ● ● ● ● ● ● ● ● ● ● ● ● ● ● ● ●● ● ● ● ● ● ● ● ● ● ● ● ● ● ●● ● ● ● ● ● ● ● ● ●● ● ● ● ● ● ● ● ●● ●●● ● ● ● ● ●●● ● ● ● ● ● ●● ● ● ● ● ● ● ● ● ● ● ● ● ● ● ● ● ● ● ● ● ● ● ●● ● ● ● ● ● ● ● ● ● ● ● ● ● ● ● ● ● ● ●● ● ● ● ● ● ● ● ● ● ● ● ● ● ● ● ● ● ● ● ● ● ● ● ● ● ● ● ● ● ● ● ● ● ● ● ● ● ● ● ● ● ● ● ● ● ● ● ●● ●● ● ● ● ● ● ● ● ●● ●●● ● ● ● ● ● ● ● ● ● ● ● ● ● ● ● ● ● ● ● ● ● ● ● ● ● ● ● ● ● ●●● ● ● ● ● ● ● ● ● ● ●●● ●● ●● ● ● ● ● ● ● ● ● ● ● ● ● ● ● ● ● ● ●●● ● ● ● ● ● ● ● ● ● ● ● ● ● ● ● ● ● ● ● ● ● ● ● ● ● ● ● ● ● ● ●●●●● ● ●●●● ● ● ● ● ●● ● ● ● ● ● ●●● ● ● ● ● ● ● ●● ● ● ● ● ● ● ● ● ● ● ● ● ● ● ● ● ● ● ● ● ● ● ● ● ● ● ● ● ●● ● ● ● ●●●● ● ● ● ● ● ●●● ●● ● ● ● ● ● ● ● ● ●● ● ● ● ● ● ● ● ● ● ● ● ● ● ● ● ● ● ● ● ● ● ● ● ● ● ● ● ● ● ● ● ● ● ● ● ● ● ● ● ● ● ●● ● ● ● ● ● ● ● ● ● ● ● ● ● ● ● ● ● ● ●● ● ● ● ● ● ● ● ● ● ● ● ● ● ● ● ● ● ● ● ● ● ● ● ● ● ● ● ● ● ● ● ● ● ● ● ● ● ● ● ● ● ● ● ● ●● ● ● ● ● ● ● ● ● ● ●● ● ● ● ● ● ● ● ● ● ● ● ● ● ● ● ● ● ● ● ● ● ● ● ● ● ● ● ● ● ● ● ● ● ● ● ● ● ● ● ● ● ● ● ● ● ● ● ● ● ● ● ● ● ● ● ● ● ● ● ● ● ● ● ● ● ● ● ● ● ● ● ● ● ● ● ● ● ● ● ● ● ● ● ● ● ● ● ● ● ● ● ● ● ● ● ● ● ● ● ● ● ● ● ● ● ● ● ● ● ● ● ● ● ● ● ● ● ● ● ● ● ● ● ● ● ● ● ● ● ● ● ● ● ● ● ● ● ● ● ● ● ● ● ● ● ● ● ● ● ● ● ● ● ● ● ● ●●●● ● ● ● ● ● ● ● ●● ● ● ● ● ● ● ● ● ● ● ● ● ● ● ● ● ● ● ● ● ● ● ● ● ● ● ● ● ● ● ● ● ● ● ● ● ● ● ● ● ● ● ● ● ● ● ● ● ● ●●●● ● ● ● ● ● ● ● ●● ● ● ● ● ● ● ● ● ● ● ● ● ● ● ● ● ● ● ● ● ● ● ● ● ● ● ● ● ● ● ● ● ● ● ● ● ● ● ● ● ● ● ● ● ● ● ● ● ● ●●●● ● ● ● ● ● ● ● ●● ● ● ● ● ● ● ● ● ● ● ● ● ● ● ● ● ● ● ● ● ● ● ● ● ● ● ● ● ● ● ● ● ● ● ● ● ● ● ● ● ● ● ●●● ● ● ● ● ●● ●● ● ● ● ●● ● ● ● ● ●● ● ● ● ● ● ● ● ● ● ● ● ● ● ● ● ● ● ● ● ● ● ● ● ● ● ● ● ● ● ● ● ● ● ● ● ● ● ●● ● ● ● ● ● ● ● ● ● ● ● ● ● ● ● ●●● ● ● ● ● ● ● ● ● ●● ● ●● ● ● ● ● ● ● ● ● ● ● ● ● ● ● ● ● ● ● ● ● ● ● ● ● ● ● ● ● ● ● ● ● ● ● ● ● ● ● ● ● ● ● ● ● ● ● ●● ● ● ● ● ● ● ● ● ● ● ●●● ● ● ● ● ● ● ● ● ● ● ● ● ● ● ● ● ● ● ● ● ● ● ● ● ● ● ● ● ● ● ●● ● ● ●●●●● ● ●● ● ● ● ● ● ● ● ●● ● ● ● ● ● ● ● ● ●●●●● ● ● ● ● ●●● ● ●● ●● ● ● ● ● ●●● ● ● ● ● ● ●●● ●●●● ● ● ● ● ●● ● ● ● ● ● ● ● ● ● ● ● ● ● ● ● ● ● ● ● ● ● ● ● ● ● ● ● ● ● ● ● ● ● ● ● ● ● ● ● ● ● ● ● ● ●● ● ● ●● ● ● ● ● ● ● ● ●●● ● ● ● ● ● ● ● ● ● ● ● ● ● ● ● ● ● ● ● ● ● ● ● ● ● ● ● ● ● ● ● ● ● ● ● ● ● ● ● ● ● ● ● ● ● ●● ● ● ●●●●●● ●●●● ●● ● ● ●● ● ● ●● ● ●●● ● ●● ● ●●●● ● ● ● ● ● ● ● ●● ●● ● ● ● ● ● ● ● ●● ● ● ●● ● ●● ●●●●●●●●● ● ● ● ● ● ● ● ● ●● ● ● ● ● ● ● ● ● ● ● ● ●● ● ● ● ● ● ● ● ● ● ● ● ●● ● ● ● ● ●● ● ● ● ● ● ● ● ● ● ● ● ● ● ● ●●●●●● ● ●●●● ● ●● ● ●●● ●● ● ● ● ● ● ● ●● ● ● ●●● ● ● ● ● ● ●●● ● ● ● ●●● ● ● ● ● ● ● ● ● ●● ● ● ● ● ● ● ● ●● ● ● ● ● ● ● ● ● ● ● ● ● ● ● ● ● ● ● ● ● ● ● ● ● ● ● ● ● ● ● ● ● ● ● ● ● ● ● ● ● ● ● ● ● ● ● ● ● ● ● ● ● ● ● ● ● ●● ● ●● ●●● ● ● ● ●●●●● ● ● ● ●● ● ● ● ●●●●●●● ● ● ● ● ● ● ● ● ● ● ● ● ● ● ● ● ● ● ●● ● ● ● ● ● ● ● ● ● ●● ● ● ● ●● ● ●● ●●●● ● ● ● ● ● ● ● ● ● ● ●● ●● ● ● ● ●●●● ●● ● ● ● ● ● ● ● ● ● ● ● ● ● ● ● ● ● ● ● ● ● ● ● ● ● ● ●● ● ● ● ● ● ●●●●●● ●● ● ●●● ● ● ● ●● ● ● ● ● ●● ●● ● ● ● ● ● ● ● ● ● ● ● ● ●●● ● ● ● ● ● ● ● ● ●●●● ● ●● ● ● ● ● ● ●● ● ● ● ● ● ● ● ●● ● ● ● ● ● ● ● ● ● ● ● ● ● ● ● ● ● ●● ● ● ● ● ● ● ● ● ● ● ● ● ● ● ● ● ●● ● ●● ● ● ●● ● ●● ●● ● ● ● ● ●●● ● ● ● ● ● ● ● ● ● ● ● ● ● ● ● ● ● ● ● ● ● ● ● ● ● ● ● ● ● ● ● ● ● ● ● ● ● ● ● ● ● ● ●● ● ●● ● ● ●● ● ●● ●● ● ● ● ● ●●● ● ● ● ● ● ● ● ● ● ● ● ● ● ● ● ● ● ● ● ● ● ● ● ● ● ● ● ● ● ● ● ● ● ● ● ● ● ● ● ● ● ● ● ● ● ● ● ● ● ● ● ● ● ● ● ● ● ● ● ● ● ● ● ● ● ● ● ●● ● ●● ● ● ● ● ● ● ●● ● ● ● ● ● ● ●●● ● ● ●● ● ● ● ● ● ● ● ● ●● ● ●●● ● ● ●● ● ● ● ●● ●● ● ● ● ● ● ● ● ● ● ● ● ● ● ● ● ● ●● ● ●● ● ● ● ● ● ● ● ● ● ● ● ● ● ● ● ●● ● ● ● ● ● ● ● ● ● ● ● ● ● ● ● ● ● ● ● ● ● ● ● ● ● ● ● ● ● ● ●● ● ● ● ● ● ●●●● ● ● ● ● ●● ● ●● ● ● ● ● ● ●● ● ● ●● ●● ● ● ● ● ● ● ●● ● ● ● ● ● ● ● ● ● ● ● ● ● ● ● ● ● ● ●●● ● ● ●● ● ● ● ● ● ● ● ● ● ● ● ● ● ● ● ● ● ● ● ● ● ● ●● ● ● ● ●●●●●●●●● ● ● ● ● ● ● ●●● ● ● ● ● ● ● ● ● ● ● ● ● ● ● ● ● ● ● ● ● ● ● ● ● ● ● ● ● ● ● ● ● ● ● ● ● ● ● ● ●● ● ● ● ● ● ● ● ● ● ● ● ● ● ● ● ● ● ● ● ● ● ● ● ● ●● ● ● ● ● ● ● ● ●● ● ● ● ● ● ● ● ● ● ● ● ● ● ● ● ● ● ● ● ● ● ● ● ● ● ● ●● ● ● ●● ● ● ● ●●●● ● ●●● ● ●●● ● ● ● ● ● ● ● ● ● ● ● ● ●● ● ● ● ● ● ● ● ● ● ● ●● ● ● ●● ●●●●● ●● ● ● ● ● ● ● ● ● ● ●●● ● ●● ● ● ● ● ● ● ● ● ● ● ● ● ●●●● ● ● ● ● ● ● ● ● ● ● ● ● ● ● ● ● ● ● ● ● ● ● ● ● ● ● ● ● ● ● ● ● ● ● ● ● ● ● ● ●● ● ● ● ● ● ● ● ● ● ● ● ● ● ● ● ● ● ● ● ● ● ● ●● ● ● ●● ●●● ●●● ● ● ●● ●● ● ●●● ● ● ● ● ● ● ● ● ● ● ● ● ● ● ● ● ● ● ● ● ● ● ● ● ● ● ● ● ● ● ● ● ● ● ● ● ● ● ● ●● ● ● ● ● ●● ● ●● ● ● ●● ● ● ● ● ● ● ● ● ● ● ● ● ● ●● ● ● ● ● ● ● ● ● ● ● ● ● ● ● ● ● ● ● ● ● ● ● ● ● ●●●● ● ● ●●● ● ●●● ● ● ● ●●●● ●●● ● ● ● ● ●●● ● ● ● ● ● ●● ● ● ● ● ● ● ● ● ● ● ● ● ● ● ● ● ● ● ● ● ● ● ● ● ● ● ● ● ● ● ●● ●●● ● ●●●● ● ●● ●● ● ●● ●● ● ● ●● ● ● ● ● ● ● ● ● ● ● ● ● ● ● ● ● ● ● ● ● ●● ● ●●● ● ● ● ● ● ● ● ● ● ● ● ● ●● ●● ● ●● ● ● ● ● ●●● ● ● ● ● ● ● ● ●●● ● ● ● ● ● ● ● ● ● ● ● ● ● ● ● ● ● ● ● ● ● ● ●● ● ● ●●●●●●●●●●●● ● ●●● ● ● ●●● ● ●●● ●● ● ● ● ● ● ● ● ● ● ● ● ●● ●● ● ● ● ● ● ● ● ● ●● ● ●● ●● ● ● ● ● ● ● ● ●● ●●● ●●● ● ●●●●● ● ●● ● ● ● ● ● ●● ● ● ● ● ● ● ● ● ● ● ● ● ● ●● ● ● ● ● ● ● ● ● ● ● ● ● ● ●● ● ● ● ● ● ● ● ● ● ● ● ● ● ● ● ● ● ● ● ● ● ● ● ● ●● ● ●●● ● ● ● ● ●● ●● ●●●●● ● ● ● ● ● ● ● ● ● ● ● ● ● ● ● ● ● ● ● ● ● ● ● ● ● ● ● ● ● ● ● ● ● ● ● ●● ● ● ●● ● ● ● ●● ● ● ● ● ● ● ● ●●●●●●●●●● ● ● ● ● ● ● ● ● ● ● ● ● ● ● ● ● ● ● ● ● ● ● ● ● ● ● ● ● ● ● ● ● ● ● ●● ● ● ● ● ● ● ● ● ● ● ● ● ● ● ●● ● ● ● ● ● ● ● ● ● ● ● ● ● ● ● ● ● ● ● ● ● ● ● ● ● ● ● ● ● ● ● ● ● ● ● ● ● ● ● ● ● ● ● ● ●● ● ● ● ● ● ● ● ● ● ● ● ● ● ●● ● ● ● ● ●● ● ● ● ● ● ● ● ● ●●● ● ● ● ● ● ●● ● ● ● ● ● ● ● ● ●●● ● ●● ● ● ● ● ● ●● ● ● ● ● ● ● ● ● ● ● ● ● ● ● ● ● ● ● ● ● ● ● ● ● ● ● ● ● ● ● ● ● ● ● ● ● ● ● ● ●● ● ● ● ● ● ● ● ● ●●●● ● ● ● ● ● ● ● ●● ● ● ● ● ● ● ● ● ● ● ● ● ● ● ● ● ● ● ● ● ● ● ● ● ● ● ● ● ● ● ● ● ● ● ● ● ● ● ● ●● ● ● ● ● ● ● ● ● ●●●● ● ● ● ● ● ● ● ●● ● ● ● ● ● ● ● ● ● ● ● ● ● ● ● ● ● ● ● ● ● ● ● ● ● ● ● ● ● ● ● ● ● ● ● ● ● ● ● ● ● ● ●●●● ● ●● ● ● ●● ● ● ● ●●●● ●●● ● ● ● ●●● ● ● ● ● ● ● ● ● ● ● ● ● ● ● ● ● ● ● ● ● ● ● ● ● ● ● ● ● ● ● ● ● ● ● ● ● ● ● ●● ● ● ●●● ● ● ● ● ● ● ●● ● ● ●● ●● ● ●● ● ● ● ● ● ● ● ● ● ● ● ●● ● ● ● ● ● ● ● ● ● ● ● ● ● ● ● ● ● ● ● ●●● ● ● ● ●●● ●● ●●●●● ● ●● ● ● ● ● ● ● ● ● ● ● ● ● ● ● ● ● ● ● ● ● ● ● ● ● ● ● ● ● ● ● ● ● ● ● ● ● ● ● ● ● ● ● ● ●● ● ● ●●●● ●●● ● ● ●●●● ●● ●● ● ● ●● ● ●●● ● ●● ●● ● ● ● ● ● ●● ● ● ● ●● ● ● ● ● Female Male 0.07 0.09 0.11 0.13
0.000 0.005 0.010 0.015 0.020 0.000 0.005 0.010 0.015 0.020
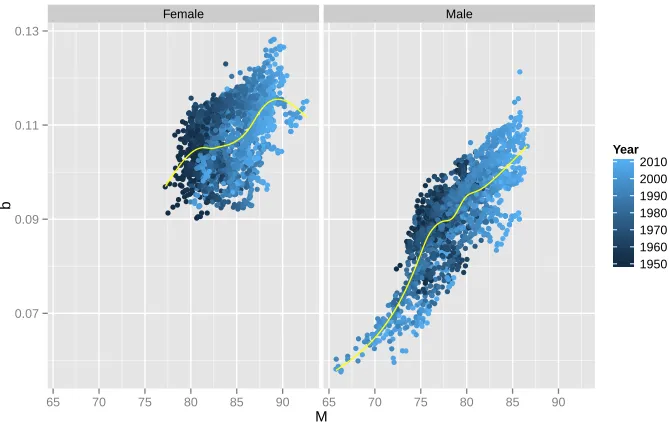
Figure 4: The relationship ofM andbbased on estimated parameters for all HMD countries, years 1950 to last available, ages 50–90, by sex. The yellow curve results from applying a cubic regression spline to the data (we use the ‘gam’ function from the ‘mgcv’ R package: Wood 2012). ● ●●●● ● ● ● ● ●●●● ● ● ● ● ● ● ● ● ●●●●● ● ●●● ●● ● ● ● ● ●●● ●● ● ●● ● ● ●●● ●●●● ●●●●● ● ● ● ●●●●●●●● ● ● ● ● ●● ●●●● ●● ● ●●●● ● ● ● ●● ● ● ●●●●● ●●●●●●●●●● ●●● ● ● ● ●●●● ● ●● ● ●● ● ● ● ● ● ● ● ● ● ● ● ● ● ● ● ● ● ● ● ● ● ● ● ●●● ● ● ● ● ● ● ● ● ● ● ● ●● ● ●●●●●●● ●● ● ● ● ●● ● ● ● ● ● ●● ● ● ● ● ● ● ●● ● ● ●●● ●● ●● ● ● ●●●● ●●●●● ● ●●●● ● ●● ●●●●●●●●● ●● ● ● ●●● ● ● ● ● ●●● ● ● ● ● ●● ● ●●●● ● ● ●● ● ●●● ● ● ● ● ● ● ● ● ● ● ●● ●●●● ● ● ● ● ● ● ●● ● ●●● ●●●●● ● ● ● ● ● ● ●● ● ● ● ● ●●●●● ● ●● ● ●●●●●●●●●●●●●●● ●●● ● ● ●●●●●●● ●●●● ●●●●●●● ● ●●● ● ● ● ● ●● ● ● ● ● ● ● ●● ● ●● ● ● ●● ●●● ● ● ● ● ● ●●● ● ● ●●●●●● ● ● ● ● ● ●● ●●●●●●●●● ● ●●●●●●●●●● ●●● ●●● ●●● ● ● ● ●● ●● ●●● ● ● ● ● ● ● ● ●● ● ●●●●● ● ● ● ● ● ●● ● ● ● ● ●●●● ●● ● ● ● ●●●● ●● ● ● ● ●●●●● ●●● ● ● ● ● ●● ● ●●● ●● ● ● ● ● ● ● ● ● ● ● ●●● ● ●●●● ● ● ●● ● ● ●●●●●●● ● ● ●● ● ● ● ●● ● ● ● ● ●● ● ● ● ● ● ● ● ● ● ● ● ●● ●● ● ●●●● ●●●●● ● ● ● ●● ● ● ● ● ● ●●● ● ● ● ● ● ● ● ●● ● ● ● ●● ● ●● ● ● ● ● ● ● ● ● ● ● ● ● ● ● ● ● ● ● ● ● ●●● ●●●●●●●● ● ● ●●●● ●●● ●●●● ● ●●●●●● ● ● ● ● ● ● ● ●●●● ● ● ● ● ● ● ● ● ● ● ● ● ● ● ● ● ● ● ● ● ● ●●● ●●●●●●●● ● ● ●●●● ●●● ●●●● ● ●●●●●● ● ● ● ● ● ● ● ●●●● ● ●●●●●●●● ●●●●● ● ● ●●●● ●● ● ● ● ● ●● ● ● ●●● ●● ● ●● ● ● ● ● ● ● ●●●●● ● ● ● ● ● ●● ● ● ● ● ●●●●●●● ●● ● ●● ●● ●● ● ● ● ●●●● ● ● ● ● ● ● ● ●● ● ●● ● ●● ● ● ● ● ● ● ● ● ● ● ● ● ● ● ● ● ● ● ● ● ●● ● ● ● ● ● ● ● ● ● ●● ● ● ● ● ● ● ● ● ● ● ●● ● ● ● ●● ● ●●● ● ● ● ●●● ● ● ● ● ● ● ●● ● ● ●● ● ● ●● ●●● ●● ● ● ●● ●● ● ● ●●●●●● ●● ● ● ●●● ●●●● ●● ● ● ●● ●●● ● ● ● ●●● ● ●●● ●●●● ● ●●● ● ●●●●● ● ●●● ●● ●● ● ●●● ● ● ●●● ● ● ●●●●●●●● ● ● ●● ●●● ● ●●●●●●●● ●●●● ● ● ●●●●● ●● ● ● ●● ● ● ●● ●● ● ●● ● ●● ●●●● ● ●●● ●●●●●●●●●● ●●●● ● ●●●● ● ●● ● ● ●●●●●● ●●●● ● ● ● ● ●●●●● ● ● ●●● ●● ●● ● ● ●● ● ● ● ● ● ● ● ● ● ●● ● ● ●● ● ● ●●●●●●●● ● ●●● ● ● ● ● ● ● ●● ● ● ● ● ● ● ● ●● ● ● ● ● ● ● ●●● ● ● ● ● ● ● ● ● ●● ● ●● ● ● ●●●●● ● ● ● ● ●● ● ● ● ● ● ● ●● ● ● ● ● ● ● ● ● ● ● ● ● ● ● ● ● ● ● ● ●● ● ● ● ● ● ● ●●● ● ● ●●● ● ● ● ● ● ● ● ●● ● ●●●●● ● ● ●● ● ●● ● ● ● ● ● ● ● ●●● ● ●●●● ● ● ●●● ● ● ● ● ● ● ● ●●●● ● ●● ●●●●●●●●●●● ● ●● ● ●● ● ● ● ● ●● ●● ● ● ● ● ● ● ● ●● ● ● ●● ● ● ●● ● ● ● ● ● ● ● ● ● ● ● ● ● ● ● ●●● ●● ● ● ● ●●● ●●●●● ●● ● ● ●●● ● ● ● ●● ● ● ●●● ● ● ● ● ●●● ●●●●●●●● ●● ● ● ● ● ●●●● ● ● ● ● ● ●●●● ● ●●● ● ● ● ●● ● ● ● ● ● ● ●●● ● ● ● ● ●●●●●● ● ●● ● ● ● ● ● ● ● ● ● ●● ●● ●●●●●●●●●●● ● ● ●●●● ● ●● ● ● ● ● ●● ● ● ●● ● ●● ●●● ●●●● ● ● ● ● ● ●● ●● ● ●●● ● ● ●● ●● ● ●● ● ●●●●●● ● ● ● ●● ●●● ● ● ● ● ● ● ● ● ● ●● ● ● ● ●● ● ● ● ● ●● ● ● ●●●● ● ●● ● ● ● ●● ● ● ●● ● ●● ● ● ● ● ●●● ●● ●●● ● ● ● ● ● ●● ● ● ●●● ● ● ● ●●● ● ● ● ●●●●●●● ●● ● ● ● ●●● ● ●● ● ● ●●● ● ●●●●● ● ●●●● ● ● ● ●● ● ●● ● ● ●● ● ● ● ●●●● ● ● ● ● ● ● ● ● ● ●● ● ● ● ● ● ●● ● ● ●●● ●● ● ●●●●● ● ● ● ●● ●●●●●●●● ● ● ●● ●● ● ●● ●●●●●● ●● ● ● ●● ● ● ● ● ● ●●● ●●●● ● ● ● ●●● ●● ● ● ● ●●●● ● ●●● ● ● ● ● ● ● ● ● ● ● ●● ●● ● ●●● ●● ● ● ● ●●● ● ● ● ● ●● ●● ●● ● ●● ● ● ● ● ● ● ● ● ● ● ● ● ● ● ● ● ●●● ● ●●●●●● ● ● ●●● ●●● ● ● ● ● ●● ● ●●● ● ●●●● ●●●●●● ● ●●● ●●● ●● ● ●● ●●●● ● ● ●● ● ● ● ●● ● ●● ● ● ●●●● ● ●●●●●●●● ● ●●● ● ● ● ● ●● ●● ● ●●●●●● ● ● ● ● ● ●●●●●●●●●●●●●●● ● ●● ●● ●●●● ●●●●●●●●● ● ●●●●●●●●● ● ● ● ●● ●● ● ● ●● ●● ● ● ● ● ● ● ●●●●●●●●●●●●●●● ● ●● ● ● ●●●● ●●● ●●●●● ● ● ●●●●●●●● ● ● ● ● ●● ●● ● ● ●● ●● ● ● ● ● ● ● ●●●●●●●●●●●●●●● ● ●● ● ● ●●●● ●●● ●●●●● ● ● ●●●●●●●● ● ● ● ●●●● ● ● ●●●●●● ● ● ● ● ● ●● ● ●●●●● ● ●●●● ● ● ● ●● ●● ● ●●● ● ● ●●●● ●●●● ●●● ● ●●●●● ● ● ●● ● ●●●●●● ● ● ●●● ● ● ● ● ● ● ● ● ● ● ●●● ● ●●● ● ● ● ● ● ● ● ● ●● ●●● ● ● ● ● ● ● ●● ●●●● ● ●● ● ●●●●● ● ● ●●●●● ● ●●●●●●● ●●●●●●●●●●●●●●●●●●●●●●● ● ● ●●● ● ●●●●●●●● ● ● ● ● ●●● ●●●●●●● ● ●● ●● ● ● ● ● ● ● ●● ● ● ● ●●●● ● ● ● ● ● ● ●●● ● ● ● ● ● ● ● ●●● ● ● ● ●●● ●● ● ●● ●●●●● ● ● ● ● ● ● ●●●● ● ● ● ●●●● ● ● ●● ●●●● ● ●●● ● ●● ●●●●●● ● ●● ●●●●● ● ●●●● ● ● ●●●●● ●● ● ● ● ● ● ●● ●●●● ●● ● ● ●●● ● ● ● ●●●●●●●●●●●●●●●● ●●●●●●● ● ●● ● ● ● ● ●● ● ● ● ● ● ●● ● ● ● ● ● ● ● ● ● ● ● ● ● ● ● ● ● ● ● ● ● ● ● ● ● ● ● ●● ● ●●●● ● ● ●● ● ● ● ● ●●●● ● ● ●●● ● ● ● ● ● ●●● ● ●●●● ●● ● ● ● ●●● ●● ●●● ● ●● ●●●● ● ● ●● ● ●●●●● ●● ●●● ●●●●● ● ● ● ● ●● ● ●● ● ●● ● ●● ●● ● ● ●● ● ●●● ● ● ● ● ● ● ● ● ● ● ● ● ● ●● ●● ● ● ● ● ● ● ●●● ●●●● ●●●● ● ● ● ● ●●●●● ●● ●● ● ● ● ● ●● ● ● ● ●● ●●●●● ●●● ●●● ●● ●●● ●●● ●●● ● ●●● ●● ●●●●●●●●●● ● ● ● ●● ●● ● ● ●●● ●● ● ●● ● ● ● ● ●●●●● ● ● ● ● ● ● ● ● ●●●● ●●● ● ● ● ●●● ●●●● ●● ● ● ●●●●●●● ●●●●●●●●● ●● ●●● ● ● ● ● ● ● ● ●●●●● ●● ● ● ● ● ● ●● ● ●● ● ● ● ● ● ● ● ●●●●●●●●● ●●● ●●●● ●●●● ●●●● ● ●●● ●●● ●● ● ● ● ● ● ● ● ● ● ●●●● ● ● ● ● ●● ● ●● ● ● ● ● ● ● ● ● ● ● ● ●● ●● ● ●● ●● ●●●●● ● ● ● ● ●● ● ●● ●●●●● ● ● ● ●● ●●●● ●●●●●●●●●●● ● ●● ● ● ● ● ●●● ●● ● ●●●●●●● ●●●● ● ● ●● ● ● ● ● ● ● ● ● ● ● ● ● ● ● ● ● ● ● ● ● ● ●● ●●●●●●●● ●●●●●●●●●●●●●● ●●●●● ●●●● ● ● ● ● ●● ●●●●● ● ● ● ● ● ● ● ● ● ● ● ● ● ● ● ● ● ● ● ●● ●●●●●●●● ●●●●●●●●●●●●●● ●●●●● ●●●● ● ● ● ● ●● ●●●●● ●●●●●●●●●●●●● ● ●●●●●●●● ● ● ● ● ●● ● ●● ● ● ● ● ● ● ● ● ● ● ● ● ●●● ● ● ● ● ● ● ● ● ● ● ●● ●● ● ● ● ● ● ●●● ●●●●●●●● ● ● ● ●●● ● ● ● ● ● ● ● ● ● ● ● ● ● ● ● ● ● ●● ● ● ● ● ● ●●● ● ● ● ● ●● ● ● ● ● ● ● ● ● ● ● ● ● ● ● ● ● ● ● ● ● ● ● ● ● ● ● ● ● ● ● ●● ● ● ● ● ● ● ● ●● ● ● ● ● ● ● ● ●● ●●●● ●● ● ●●● ● ● ● ●●●●● ● ● ● ●●● ●●● ● ●●●●●● ●●●● ● ●● ● ●●●● ● ●● ● ●●●● ●●●●●●●● ●●● ● ●●● ● ● ● ●●●● ● ● ● ● ●●●● ● ●●● ● ● ●●● ●●●●● ● ● ●●●●● ●●●●● ●●●● ●●● ● ● ● ●●● ●● ●●● ● ●● ● ● ●● ●● ● ●● ● ●● ●●●●● ●●●●●●●●● ● ●●●●●●●●●●●●● ●● ● ● ●●●●●●● ● ●● ● ●● ●●● ● ● ● ● ● ● ● ● ● ● ● ● ● ● ●● ●●● ● ● ● ● ● ● ● ● ● ● ●● ● ● ●●● ● ●● ● ● ● ● ●● ● ● ● ● ● ● ● ● ● ● ● ● ● ● ● ●● ● ● ● ● ● ● ● ●● ● ● ●●● ● ● ● ● ● ● ● ● ● ●●●● ●● ● ● ● ● ● ● ●●● ● ● ● ● ● ● ● ● ● ●● ●● ● ● ● ● ● ●● ●● ● ● ● ● ●● ● ● ● ● ● ●● ● ● ● ●●●● ● ●● ● ● ●●● ● ● ● ● ● ● ● ● ● ● ● ● ● ● ● ● ● ● ● ● ●● ●●●●●● ●●●●● ●● ●●●● ●●● ● ●●● ●●●●● ●● ● ● ●●●●● ● ●● ● ● ● ● ●●● ● ● ● ● ● ● ● ● ● ● ● ●● ● ●● ●● ● ● ● ● ●●● ●●●● ●●● ●●●● ●●● ●● ●●● ● ● ●●● ● ● ● ● ● ● ● ● ● ● ● ● ● ● ● ● ● ● ● ●● ●● ●●●●●●●● ● ● ● ● ● ● ●●● ●● ● ● ● ●● ● ● ●● ● ●● ● ● ● ●●● ● ● ● ● ● ● ●●● ● ● ●● ● ● ●● ● ● ● ● ● ● ● ● ● ● ● ● ●● ● ● ●● ●● ●●●●●●●●● ●● ● ●●● ● ●● ● ● ● ● ●● ● ● ● ● ● ● ● ●● ● ●●●● ● ● ● ●● ●● ● ●●●●● ●● ●●●●●●●● ●●● ●●●●●●● ●●●●● ● ● ●●● ●●●●● ● ● ● ● ● ● ● ● ● ● ● ● ● ●● ● ● ● ● ● ● ● ● ● ● ● ● ●● ● ●● ● ● ● ● ●●● ● ●●● ● ● ● ● ● ● ● ● ● ● ● ● ● ● ●● ● ● ● ● ● ● ● ● ● ●● ● ● ●● ● ● ● ● ●● ● ● ● ● ● ●●●● ●●●● ●●●● ● ● ●●●●● ● ●●● ● ●● ●● ● ●●● ● ●●● ●●● ●● ● ● ●● ● ● ● ● ●●● ● ●●● ● ● ● ●●●●●● ●●●● ●●●●●●●●●● ● ● ● ●●●●●● ●●●●● ● ● ● ●●● ● ● ● ● ●●● ●●●●● ● ● ●● ● ● ● ●● ● ●● ● ● ● ● ●● ●●● ●●●●●●●●● ●●● ●●●●● ● ● ●●●● ●●●●●●●●● ●●●● ● ●●● ● ● ● ● ● ● ● ● ● ● ● ● ● ● ● ●●●●● ●●● ● ●●●●●●●●●● ●● ● ●●● ● ● ●●● ● ●●●●● ●●● ●●●● ●●●● ● ● ●●● ●●● ● ● ● ● ● ● ● ● ● ● ● ●● ●● ●●●● ●●●●● ● ●●●● ● ● ● ●● ● ● ● ● ●● ● ● ● ● ● ● ● ● ●●●●●● ● ● ● ● ●●●●●● ●●●● ●●●● ●●●● ●●●●● ●●●● ●●●●●● ● ● ● ●● ● ● ● ● ●● ● ● ● ● ● ●●● ●●●●●● ● ● ● ●●●● ●●● ●●●● ● ●●● ●●●● ●●●●●●●●● ●●●●●● ● ● ● ●● ● ● ● ● ●● ● ● ● ● ● ●●● ●●●●●● ● ● ● ●●●● ●●● ●●●● ● ●●● ●●●● ●●●●●●●●● ●●●●●● ● ●● ● ●●● ● ● ● ● ● ● ● ● ● ● ● ● ● ●● ● ●●● ● ● ● ●●● ●●●● ●●● ● ●●●●●●●●● ● ●●● ● ●●●●●●● ● ● ● ● ● ● ● ● ● ● ●● ●● ●●● ● ● ● ● ● ● ● ● ●●● ●●● ●●●●●●● ● ●●● ●● ●●● ● ●● ●●● ● ● ●●●● ● ● ● ● ● ●●●●●●●●●●● ● ●●● ●● ●●●●● ●●●●●●● ●●●●● ●●●●●●●●●● ●● ●●●●●●● ●●● ● ● ●● ●●● ● ● ● ●● ● ● ● ● ● ● ● ● ● ● ● ● ● ● ● ● ● ● ●●●● ● ● ● ● ● ● ●●● ● ● ●● ●● ● ● ● ●● ● Female Male 0.07 0.09 0.11 0.13
65 70 75 80 85 90 65 70 75 80 85 90
M b 1950 1960 1970 1980 1990 2000 2010 Year
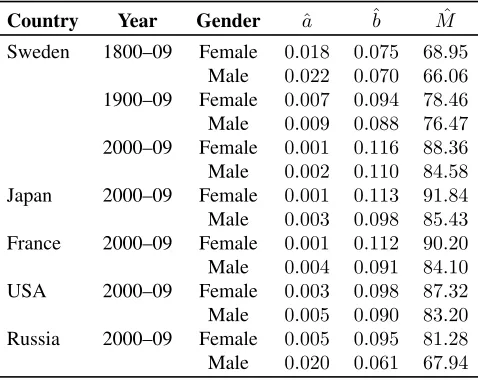
Table 5: Gompertz maximum likelihood estimates of different populations from the Human Mortality Database, ages 50–90
Country Year Gender ˆa ˆb Mˆ
Sweden 1800–09 Female 0.018 0.075 68.95
Male 0.022 0.070 66.06
1900–09 Female 0.007 0.094 78.46
Male 0.009 0.088 76.47
2000–09 Female 0.001 0.116 88.36
Male 0.002 0.110 84.58
Japan 2000–09 Female 0.001 0.113 91.84
Male 0.003 0.098 85.43
France 2000–09 Female 0.001 0.112 90.20
Male 0.004 0.091 84.10
USA 2000–09 Female 0.003 0.098 87.32
Male 0.005 0.090 83.20
Russia 2000–09 Female 0.005 0.095 81.28
Male 0.020 0.061 67.94
6. Conclusion
7. Acknowledgements
References
Beard, R.E. (1959). Note on Some Mathematical Mortality Models. In: Woolstenholme, G.E.W. and O’Connor, M. (eds.).The Lifespan of Animals. Ciba Foundation Collo-quium on Ageing. Boston, MA: Little, Brown, and Company: 302–311.
Bongaarts, J. (2005). Long-Range Trends in Adult Mortality: Models and Projection Methods.Demography42(1): 23–49.doi:10.1353/dem.2005.0003.
Brillinger, D.R. (1986). The Natural Variability of Vital Rates and Associated Statistics. Biometrics42(4): 693–734. doi:10.2307/2530689.
Canudas-Romo, V. (2008). The Modal Age at Death and the Shifting Mortality Hypoth-esis. Demographic Research19(30): 1179–1204.doi:10.4054/DemRes.2008.19.30.
Canudas-Romo, V. (2010). Three Measures of Longevity: Time Trends and Record Val-ues.Demography47(2): 299–312. doi:10.1353/dem.0.0098.
Cheung, S.L.K. and Robine, J.M. (2007). Increase in Common Longevity and the Compression of Mortality: The Case of Japan. Population Studies19(30): 85–97.
doi:10.1080/00324720601103833.
Cheung, S.L.K., Robine, J.M., Tu, E.J.C., and Caselli, G. (2005). Three Dimensions of the Survival Curve: Horizontalization, Verticalization, and Longevity extension. Demography42(2): 243–258. doi:10.1353/dem.2005.0012.
Dowd, K., Cairns, A.J.G., Blake, D., Coughlan, G.D., Epstein, D., and Khalaf-Allah, M. (2010). Evaluating the Goodness of Fit of Stochastic Mortality Models. Insurance: Mathematics and Economics47(3): 255–265. doi:10.1016/j.insmatheco.2010.06.006.
Gompertz, B. (1825). On the Nature of the Function Expressive of the Law of Human Mortality, and on a New Mode of Determining the Value of Life Contingencies. Philo-sophical Transactions of the Royal Society of London115: 513–583. doi:10.1098/rstl.
1825.0026.
Greenwood, M. (1928). “Laws” of Human Mortality from the Biological Point of View. The Journal of Hygiene28(3): 267–294.doi:10.1017/S002217240000961X.
Gumbel, E.J. (1958). Statistics of Extremes. New York: Columbia University Press.
Gupta, A.K. and Sz´ekely, G.J. (1994). On Location and Scale Maximum Likelihood Estimators. Proceedings of the American Mathematical Society120(2): 585–589.
doi:10.1090/S0002-9939-1994-1207537-3.
HMD (2014). The human mortality database. http://www.mortality.org/.
Death: Lifespan Indicator in the Era of Longevity Extension. Vienna Yearbook of Population Research11: 37–69. doi:10.1553/populationyearbook2013s37.
Kannisto, V. (2001). Mode and Dispersion of the Length of Life. Population13: 159– 171.
Lenart, A. and Missov, T.I. (2015). Goodness-of-Fit Tests for the Gompertz Distribution. Communications in Statistics: Theory and Methods44. doi:10.1080/03610926.2014.
892323.
Missov, T.I. and Lenart, A. (2013). Gompertz-Makeham Life Expectancies: Expressions and Applications. Theoretical Population Biology90: 29–35. doi:10.1016/j.tpb.2013.
09.013.
Nemeth, L. and Missov, T.I. (2014).How Wrong Could Parameter Estimates Be? Statis-tical Consequences of Fitting the Wrong Model to Human Mortality Data. Presented at the 2014 European Population Conference, Budapest, Hungary, June 25–28 2014.
Ouellette, N. and Bourbeau, R. (2011). Changes in the Age-at-Death Distribution in Four Low Mortality Countries: A Nonparametric Approach. Demographic Research 25(19): 595–628.doi:10.4054/DemRes.2011.25.19.
Pletcher, S.D. (1999). Model Fitting and Hypothesis Testing for Age-Specific Mor-tality Data. Journal of Evolutionary Biology 12(3): 430–439.
doi:10.1046/j.1420-9101.1999.00058.x.
Pollard, J.H. (1998a). An Old Tool – Modern Applications. School of Economic and Financial Studies, Macquarie University Sydney NSW Australia. 001/98.
Pollard, J.H. (1998b). Keeping Abreast of Mortality Change. School of Economic and Financial Studies, Macquarie University Sydney NSW Australia. 002/98.
Strehler, B.L. and Mildvan, A.S. (1960). General Theory of Mortality and Aging. A Stochastic Model Relates Observations on Aging, Physiologic Decline, Mortality, and Radiation.Science132(3418): 14–21.doi:10.1126/science.132.3418.14.
Thatcher, A.R., Cheung, S.L.K., Horiuchi, S., and Robine, J.M. (2010). The Compression of Deaths above the Mode. Demographic Research22(17): 505–538. doi:10.4054/
DemRes.2010.22.17.
Vaupel, J.W. (1986). How Change in Age-Specific Mortality Affects Life Expectancy. Population Studies40(1): 147–157.doi:10.1080/0032472031000141896.
Vaupel, J.W. (2010). Biodemography of Human Ageing. Nature464: 536–542. doi:10.
1038/nature08984.
in Individual Frailty on the Dynamics of Mortality. Demography 16(3): 439–454.
doi:10.2307/2061224.