in the population sciences published by the Max Planck Institute for Demographic Research Konrad-Zuse Str. 1, D-18057 Rostock · GERMANY www.demographic-research.org
DEMOGRAPHIC RESEARCH
VOLUME 19, ARTICLE 62, PAGES 2057-2114
PUBLISHED 19 DECEMBER 2008
http://www.demographic-research.org/Volumes/Vol19/62/ DOI: 10.4054/DemRes.2008.19.62
Research Article
Union formation and fertility
in Bulgaria and Russia:
A life table description of recent trends
Dimiter Philipov
Aiva Jasilioniene
© 2008 Philipov & Jasilioniene.
This open-access work is published under the terms of the Creative Commons Attribution NonCommercial License 2.0 Germany, which permits use, reproduction & distribution in any medium for non-commercial purposes, provided the original author(s) and source are given credit.
1 Introduction 2058
2 Data and methods 2059
2.1 Data used 2059
2.2 Application of life table methods 2060
3 Results 2062
3.1 Separation from the parental family 2062
3.1.1 Leaving the parental home 2062
3.1.2 Separation from the family of the parents: competing risks 2065
3.2 Marital and non-marital union 2068
3.2.1 Experience of union formation 2069
3.2.2 Duration of first union 2077
3.3 The experience of childbearing 2086
3.3.1 Experience of transition to parenthood 2086
3.3.2 Duration of childlessness 2091
3.3.3 Second birth 2092
3.4 Recent trends and the second demographic transition: a schematic comparison
2097
4 Summary and discussion 2100
5 Acknowledgement 2103
References 2104
Union formation and fertility in Bulgaria and Russia:
A life table description of recent trends
Dimiter Philipov 1 Aiva Jasilioniene 2
Abstract
The paper provides an extensive descriptive analysis and comparison of recent trends in union formation and fertility in Bulgaria and Russia. The analysis is based on data from the Generation and Gender Surveys (GGS) carried out in 2004. We generate a large number of single- and multi-decrement life tables describing various life course events: leaving home and separation from the parental family, entry into union, first and second childbirth, divorce. Life tables are constructed for real cohorts as well as for synthetic cohorts. We study four real cohorts, born in 1940-44, 1950-54, 1960-64 and 1970-74. Synthetic-cohort life tables are constructed for three periods of time, referring to the pre-transitional demographic situation (1985-1989), the beginning of the transition (1990-1994) and recent demographic developments (1999-2003). We study also Roma and Turkish ethnic groups in Bulgaria. The life tables deliver detailed information that is otherwise unavailable. Our tentative findings indicate that societal transformation had a stronger impact on family-related behavior in the Bulgarian population than in the population of Russia. There is evidence that in some aspects Bulgaria is lagging behind other former socialist and Western European countries where the second demographic transition is more advanced. Evidence also suggests that Russia is lagging behind Bulgaria. However, certain specific features distinctive to Russia, such as the low level of childlessness, a drastic drop in second and subsequent births, and very high divorce rates even compared to Western European countries (it is a long-standing, not just recent trend), lead us to think that Russia may have a model of change particular to the country.
1. Introduction
To demographers, societal commonalities and differences between Bulgaria and Russia give rise to a natural question: How do they shape fertility and family formation in the two countries? Common cultural features include an orthodox religion and a Slavic language and alphabet. Both countries are situated in the East of Hajnal's line defining the Eastern European marriage pattern of early and nearly universal entry into marriage (Hajnal 1965). They have a common political history and were governed by similar political regimes, in Bulgaria until 1989 and in Russia until 1991. However, recent history starting in the early 1990s is different. Bulgaria’s transition to democracy is characteristic of a small society with an open economy, heavily dependent on external markets. The country is oriented towards western values and joined the European Union
on the 1st of January 2007. Russia’s economy is large and not as dependent on the rest
of the world as Bulgaria. A priori it can be expected that cultural determinants and
long-lasting political, economic and societal trends may have a parallel effect on demographic change in the two countries. In fact, in his comparative study of recent fertility change in Central and Eastern European countries, Sobotka (2003) frequently contrasts Bulgaria, Romania, Russia and other former Soviet countries with the Czech Republic and other Central European countries. Philipov and Kohler (2001) report that the start of fertility decline in Bulgaria and Russia in the beginning of the 1990s differed from the one observed in the Czech Republic, Hungary, and Poland.
However, the sweeping recent political, economic and social transformations may have exerted a strong effect on the demographic trends in the countries concerned and as a result may have included considerable diversities along with the commonalities. Societal change may have had an accumulating effect on demographic trends, thus possibly replacing with diversities the uniformity that has been observed until the beginning of the 1990s. Is this the case, however? Did demographic diversities emerge, or did common features prevail until today?
Hence, the purpose of this paper is to provide information and a comparative descriptive analysis of recent changes in union formation and fertility in the two countries so far not available. The outcome of the analysis provides a solid approach to answering questions similar to those posed above. We use data from the Generation and Gender Surveys (GGS) carried out in 2004. They contain unique and rich information on the two populations, including demographic event histories. We construct a large variety of single- and multi-decrement life tables to describe real cohorts as well as synthetic cohorts constructed over different time-periods, starting from the mid-1980s. The life-tables complement the study of Andersson and Philipov (2002) and hence open
opportunities for broader international comparison.3
The next chapter describes the data and methods of analyses used, and the following chapters report the results for the demographic events in sequence. The summary discusses the findings of the analyses from the perspective of the questions above.
2. Data and methods
2.1 Data used
We use the Generation and Gender Surveys (GGS) carried out in 2004 in both countries. Details on the GGS can be found on the website of the Population Activities Unit of the United Nations Economic Commission for Europe (UNECE PAU) (http://www.unece.org/pau/ggp) and the website of the Max Planck Institute for Demographic Research (http://www.demogr.mpg.de). The two surveys were organized as the first wave of a panel. The sample in the Bulgarian survey includes 5851 men and 7007 women, 12858 persons in all, with an age span ranging from 18 to 79 completed years. The sample size until age 45 is twice as large as that for the ages above 45. The sample is stratified. The sample size of the Russian GGS is 11261 persons (4223 men and 7038 women), and the age span is the same as in the Bulgarian survey. There is no age-specific over-sampling in the Russian survey. Kish weights were applied in the analysis on Russia to reduce the bias related to the sampling procedure (for more extensive information on the sampling procedure in Russia, see Kosolapov and Zakharov 2005).
Both surveys were still in the process of cleaning at the time of writing this report. We have performed our own cleaning but do not report about it here because it affected less than 1% of the sample.
Questions on the timing of specific events inform about the date at which the event took place. The date is measured in years and months. We consider the middle of the reported month as the exact timing of an event.
2.2 Application of life table methods
In order to understand better the swift demographic changes in the two countries, it is necessary to dispose with detailed statistical information on trends and level changes in family-related events that goes far beyond the supply of statistical agencies. Moreover, demographic data collection in Russia was reduced as of 1997. Surveys are the only additional source of information; this source first became possible with the GGS surveys in the two countries. Derivation of statistical information from survey data is most convenient with the application of life table methods, which justifies their use as a first approach to the analyses of family-related changes. Hence, life tables are used as a main method of analysis in this paper (see Appendix 1 for a brief formal description of the applied methods). However, life table outcomes do not fit best for explaining the observed changes. Explanations require solid theoretical approaches and relevant modeling framework, which is outside the scope of this paper. For this reason, we provide only a restricted speculative interpretation of our quantitative findings.
We closely follow the life table construction approach developed by Andersson and Philipov (2002), which makes international comparisons possible.
We construct synthetic-cohort life tables for three periods of time. The first one, 1985-1989 including, describes the pre-transition demographic status in the two popu-lations. The second period, 1990-1994, refers to the beginning of the transition, and the third includes the years 1999-2003, thus showing the most recent patterns.
In addition to the three synthetic types of life tables, we construct life tables for real cohorts. We use four cohorts born in 1940-44, 1950-54, 1960-64, and 1970-74. They correspond to the following age groups at the time of interview: 60-64, 50-54, 40-44, and 30-34.
All computations were performed using the statistical package Stata, Release 9
(StataCorp 2005) and our own programming in Stata. Competing-risk
(multi-decrement) cumulative incidence functions were computed using the program stcompet (Coviello and Boggess 2004). E. Coviello made available to us an improved version of the program.
We frequently provide graphs of smoothed hazard curves. These curves are much easier to understand and to comment than cumulative curves of survival or failure, and they present in a concise manner a wide array of tabulated data. The schedules received this way are similar to those that would be obtained using age-parity-specific demographic rates for the same event. The schedules should be interpreted with care, however, since they are the result of a smoothing procedure, briefly described below.
The hazard rate includes in the numerator the number of events that have occurred within a month to a population that is of equal age at the beginning of the month. This number of events is equal usually to 0 or 1, and rarely to more than 1. The hazard, therefore, will be a very small number or zero, and its curve does not make sense without previously having been smoothed. We apply the smoothing procedure
elaborated by Stata (with the exception discussed below). It is based on weighted
kernel-density estimates. The kernel density is a function that can be defined in diverse
ways (details are found in the explanation of the command kdensity, StataCorp
2005). This method of smoothing may produce biased results for points of the kernel function whose distance from the start of time is smaller than the width. This is because the number of observed hazard values drops, i.e. the estimate is truncated on the left. This was observed when smoothing the hazard shown in Figure 9 for ages below 1 year with a width equal to 1 year. Specifically for this hazard, i.e. to handle truncation, we
used the package sthaz developed by K. Simon (downloadable). No left or right
truncation effect was found in all other smoothed hazards.
The number of individuals who have not experienced the event of study decreases with the advancement of age (or time). Hence, the number may become as low as a few persons, say three, although the sample sizes are large. To avoid artifacts due to outliers in the text, we discuss life table values whose estimate is based on a population at risk not lower than 15 individuals.
3. Results
3.1 Separation from the parental family
The first substantive topic analyzed in this paper by using life tables is separation from the parental family. The demographic literature mostly focuses on physical separation in terms of leaving the parental home and moving to another dwelling. Leaving the parental home is one of two possible expressions of separation from the parental family. The other expression is the formation of an own family while staying in the parental home. In Western European countries, the latter form of separation from the parental family is rare. It is common in Eastern Europe, however, where multi-family households have deep historical roots (Hajnal 1982).
We carry out the discussion by first focusing on the conventional type of separation from the parental family: (first) leaving home. Next, we discuss a competing-risk approach where the competing-risks for separation include (first) entry into union, i.e. the formation of an own family, while residing in the parental home. We do not distinguish between non-marital and marital union. We also discuss the overall life table reflecting the aggregated effect of risks, i.e. the single-decrement life table for separation from the parental family.
3.1.1 Leaving the parental home
This process is measured by a question that asks about the date at which the individual left home for the first time to live separately from the parents. The reason for leaving is not specified. It may be moving to another settlement to continue studies or to find work, men’s obligatory service in the army, etc. The GGS data enable only to dis-tinguish between leaving home and starting to live with a partner from the other causes of leaving home.
Table 1 gives the cumulative percent at age 40 and the mean ages at transition, for the periods 1985-1989, 1990-1994 and 1999-2003 for Bulgaria and Russia. During the 1999-2003 period, the cumulative percentages in Bulgaria were lower than in the 1990-1994 period, but did not change much in Russia. The mean ages in Bulgaria increased significantly. In Russia, the mean age rose for men but for women we do not find support for a change. Thus, the data in the table indicate a decrease in the rate of leaving home in Bulgaria, but not in Russia. In Bulgaria a postponement of this event is apparent both for men and women; in Russia for men only.
between the two countries; the Russian one is placed slightly to the right, reflecting a slightly higher mean age (Table 1). The 1999-2003 schedule for the Bulgarian women is lower than that for Russian women for all ages.
Table 1: Cumulative percent ever leaving the parental home by age 40, Bulgaria and Russia
Experiencing the event by age 40 Cumulative
percent
95% confidence
intervals Mean age*
95% confidence intervals BULGARIA
Men
1985-1989 86 82.7 88.8 21.9 21.4 22.4
1990-1994 85 82.0 88.4 22.7 22.2 23.2
1999-2003 81 77.3 84.1 23.0 22.5 23.5
Women
1985-1989 93 90.2 94.5 19.9 19.6 20.2
1990-1994 90 87.6 92.2 20.0 19.7 20.3
1999-2003 83 80.0 86.3 21.6 21.2 22.0
RUSSIA
Men
1985-1989 92 89.3 94.6 21.5 21.0 22.1
1990-1994 90 86.8 92.7 21.3 20.8 21.8
1999-2003 92 88.6 93.9 21.6 21.2 22.1
Women
1985-1989 94 92.2 95.8 21.3 20.8 21.7
1990-1994 93 90.2 94.8 21.2 20.7 21.7
1999-2003 93 90.3 94.6 21.2 20.8 21.6
Figure 1: Smoothed hazard rates for leaving the parental home, by age, in 1985-1989 and in 1999-2003, Bulgarian and Russian females
0
.0
5
.1
.1
5
.2
15 20 25 30 35 40
Age
Bulgaria Russia
1985-1989
0
.0
5
.1
.1
5
.2
15 20 25 30 35 40
Age
Next, we briefly turn to changes in leaving the parental home by cohorts. Figure 2 gives the smoothed hazards for four cohorts, born in 1966-1970, 1956-1960, 1946-1950, and 1936-1940. A log-rank test for the equality of the survival functions for the ages of leaving home before 30 indicates that in Bulgaria the four cohorts do not differ statistically. In Russia, the two younger cohorts exhibit a higher mode and a steeper decline with age after the mode. That is, younger Russian female cohorts tend to leave home earlier than do the older ones. This observation is in line with the process of rejuvenation of entry into union that precipitated in this country until about the beginning of the 1990s (see Vishnevsky 1996, 1998-99, Zakharov 1997, 2003, 2008, Avdeev and Monnier 2000, Avdeev 2003, Scherbov and van Vianen 1999, 2004).
3.1.2 Separation from the family of the parents: competing risks
As mentioned in the introduction to this chapter, separation from the parental family can be performed either by leaving the parental home or by starting one's own family while staying in the parental home. Evidently, the two events may coincide in time: this is true when the newly formed couple moves to live somewhere outside of the parental home of the individual whose life course is studied. The latter case can be considered as a separate competing risk in order to avoid time coincidence of the first two risks. Thus, the effect of the following three risks is considered: (i) leaving the parental home before starting a union; (ii) leaving the parental home with the start of a union, and (iii) starting a union while being in the home of the parents. We allow for a difference of one month between the two events in the second risk, i.e. if the two events have taken place in two successive months we consider them as having taken place at one and the same time and hence that the second risk has been experienced.
Figure 2: Smoothed hazard rates for leaving the parental home by age for four cohorts born in 1940-44, 1950-54, 1960-64, 1970-74, Bulgarian and Russian females
0
.0
5
.1
.1
5
.2
15 20 25 30 35 40
Age
1970-74 1960-64
1950-54 1940-44
Bulgaria
0
.0
5
.1
.1
5
.2
15 20 25 30 35 40
Age
1970-74 1960-64
1950-54 1940-44
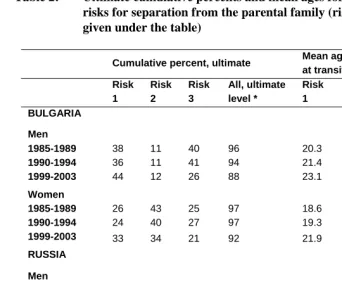
Life table extracts are given in Table 2. The table displays the ultimate cumulative percents for the three risks; this is the percentage reached at the maximum age when the population exposed to any of the risks has decreased to 15 individuals but not fewer. The maximum age differs among periods, countries, and gender; it is usually between 28 and 35 years. The table provides the percentages for each risk separately as well as for all risks. The estimate for the aggregated risk was obtained using a single-decrement life table: it is the ultimate percentage reached at the maximum age, usually between 30 and 40 years, when the population at risk is still made up of 15 individuals and not fewer. Theoretically, the sum of the percents for the three risks at a given age should be equal to the estimate from the single-decrement life table at the same age, but they do differ in Table 2 because ultimate percentages for separate risks have been reached at different ages.
The cumulative percents for the third risk, starting an own family in the home of the parents, are significant in both countries. Billari et al. (2001) showed descriptively that this observable fact has been common to most Central and Eastern European countries. It is a topic that needs detailed deliberation; however, here we sketch only a few observations.
In both countries, the ultimate level of starting an own family in the home of the parents has dropped drastically in the third period for men and for women. In Bulgaria, the drop is due mainly to the relative increase in first risk: increasing mobility of the population during the transition period probably leads to a decline of tradition. Postponement of entry into unions may play a role as well. In Russia, there is indication of another tendency among men: a relative increase in starting an own family along with leaving home is observed. Where Russian women are considered, it is not as apparent to allocate the reason for the drop in the third risk.
The second risk is very low among Bulgarian men, but it is highest among women. This observation can be explained by the tradition that a new family is more likely to live with the parents of the man than with the parents of the woman. The same observation holds for Russia but is not as pronounced as in Bulgaria.
All risks taken together describe the overall process of separation from the parental family. There is a notable drop in the ultimate level in Bulgaria, both among men and
women, towards the beginning of the 21st century. That is, there is a relative increase in
individuals who have never had an own family and live with their parents. One reason for this observation may be postponement of entry into first union. Meanwhile, in Russia, the ultimate level remains relatively stable and exceeds 90% for both genders.
Table 2: Ultimate cumulative percents and mean ages for three competing risks for separation from the parental family (risk definitions are given under the table)
Cumulative percent, ultimate Mean ages,
at transition before age 40 Risk 1 Risk 2 Risk 3 All, ultimate level * Risk 1 Risk 2 Risk
3 All
BULGARIA
Men
1985-1989 38 11 40 96 20.3 22.9 23.0 21.8
1990-1994 36 11 41 94 21.4 23.4 22.9 22.4
1999-2003 44 12 26 88 23.1 24.9 23.9 23.6
Women
1985-1989 26 43 25 97 18.6 20.1 20.6 19.8
1990-1994 24 40 27 97 19.3 20.0 20.5 20.0
1999-2003 33 34 21 92 21.9 21.4 23.1 22.0
RUSSIA
Men
1985-1989 43 13 36 93 19.1 23.7 22.1 21.1
1990-1994 40 15 37 95 19.9 23.1 22.4 21.4
1999-2003 36 20 24 94 21.0 22.3 22.6 21.8
Women
1985-1989 35 21 40 96 18.8 21.2 20.4 20.0
1990-1994 25 29 41 96 19.6 19.8 20.4 20.0
1999-2003 27 26 36 95 20.0 20.8 20.9 20.6
*) The sum of the percentages given for the three risks differs from the percentage given in this column because ultimate levels are achieved at different ages.
Risk 1: ever leaving the parental home before starting a first union, competing events: leaving the parental home with a first union and starting a first union before leaving the parental home.
Risk 2: ever leaving the parental home with starting a first union, competing events: leaving the parental home before a first union and starting a first union before leaving the parental home.
Risk 3: ever starting a first union before leaving the parental home, competing events: leaving the parental home before a first union and leaving the parental home with a first union.
3.2 Marital and non-marital union
section of this chapter concentrates on entry into first union, either marriage or non-marital cohabitation. In the second section, we study union duration.
3.2.1 Experience of union formation
Entry into first union: single-decrement perspective
Table 3 displays the cumulative percentages of ever starting a first union at age 40 and the mean ages of entering a first union with the corresponding confidence intervals. The levels reached at age 40 in Russia indicate that there has been no particular change in the universality of marriage when the three synthetic cohorts are considered. In Bulgaria, the levels mark a precipitated decline towards the turn of the century, although this decline was modest in the beginning of the 1990s. The process apparently started in the beginning of the 1990s and has gained considerable momentum towards the end of the decade.
The mean ages of entry into first union have grown in Bulgaria, by two years for women and slightly less for men. This trend indicates first union postponement to later years in life. Postponement is moderate in Russia and it is observed among women only.
Figure 3 displays the hazard curves for four cohorts. In Russia, the curves for the younger cohorts shifted to the left compared to the older ones, which is in line with the rejuvenation of entries into first marriage observed in this country until the early 1990s and with the results of our analysis of leaving the parental home. In Bulgaria, with the exception of the youngest cohort, we do not notice drastic changes at the cohort level. The mode of the youngest cohort's schedule decreased, and a relative increase is observed in the age group 25-29. The change in the schedule is apparently the result of the postponement of the event to later years in life.
Table 3: Cumulative percent ever starting a first union by age 40, Bulgaria and Russia
Experiencing the event by age 40 Cumulative
percent
95% confidence intervals
Mean age*
95% confidence intervals BULGARIA
Men
1985-1989 91 87.7 93.0 23.7 23.4 24.1
1990-1994 88 84.4 90.6 23.8 23.5 24.2
1999-2003 74 69.3 77.7 25.2 24.8 25.7
Women
1985-1989 93 91.4 95.2 20.8 20.6 21.1
1990-1994 92 89.8 94.0 20.9 20.6 21.1
1999-2003 82 77.8 84.9 22.8 22.4 23.2
RUSSIA
Men
1985-1989 96 93.2 97.6 23.5 23.1 23.9
1990-1994 98 96.3 98.7 23.4 23.0 23.9
1999-2003 94 91.1 96.2 23.3 22.9 23.7
Women
1985-1989 97 95.6 97.8 21.9 21.5 22.2
1990-1994 96 94.8 97.6 21.1 20.7 21.5
1999-2003 96 94.3 97.6 21.6 21.2 22.0
Figure 3: Smoothed hazard rates for starting a first union of four cohorts born in 1940-44, 1950-54, 1960-64, 1970-74, Bulgarian and Russian females
0
.1
.2
.3
15 20 25 30 35 40
Age
1970-74 1960-64 1950-54 1940-44
Bulgaria
0
.1
.2
.3
15 20 25 30 35 40
Age
1970-74 1960-64
1950-54 1940-44
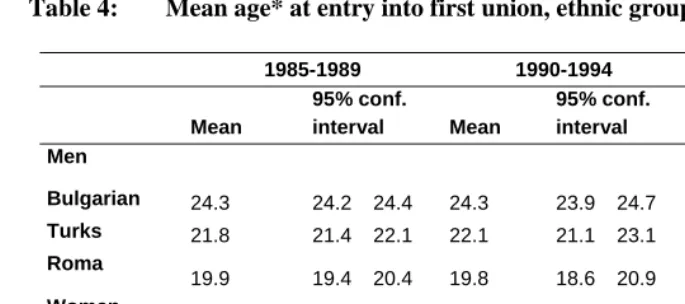
Table 4: Mean age* at entry into first union, ethnic groups in Bulgaria
1985-1989 1990-1994 1999-2003
Mean
95% conf.
interval Mean
95% conf.
interval Mean
95% conf. interval Men
Bulgarian 24.3 24.2 24.4 24.3 23.9 24.7 25.9 25.5 26.4
Turks 21.8 21.4 22.1 22.1 21.1 23.1 22.8 21.5 24.0
Roma
19.9 19.4 20.4 19.8 18.6 20.9 22.4 20.9 23.8
Women
Bulgarian 21.2 21.1 21.3 21.2 20.9 21.5 23.4 23.0 23.8
Turks 19.2 18.9 19.5 19.7 19.0 20.3 20.0 18.8 21.2
Roma 17.9 17.6 18.3 17.8 17.0 18.7 18.6 17.6 19.6
* at transition, conditional on transition before age 40
Entry into first marriage: single-decrement perspective
In this section, we discuss first marriages independently of whether the persons involved have previously been in non-marital cohabitation or not. Thus, for some of them, first marriage may be a second or even a third union that follows separation from the partner of a preceding non-marital union.
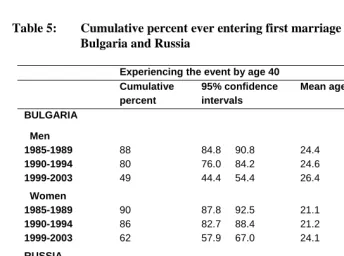
As shown in Table 5, the level of first marriage at age 40 in Bulgaria is lower than that in Russia; the difference is small but it shows that the Bulgarian population is lagging behind the universality of marriages more so than its Russian counterpart.
The confidence intervals for the period of 1985-1989 surpass the boundary of 90% in both countries. It is safe to conclude that marriage was universal in this synthetic cohort. The confidence intervals for the next period suggest the same inference for Russia but not for Bulgaria: an end to the universality of entry into marriage has come in Bulgaria in the beginning of the 90s. Finally, in our last period, the level is apparently low in Bulgaria, and the end of marital universality has arrived in Russia.
Postponement of first marriage has been significant in Bulgaria. In Russia, we note the continuation of marriage rejuvenation during the first half of the 90s, and return to the pre-transition mean age towards the start of this century.
Europe, family formation and childbearing patterns of women born in the early 1970s diverged greatly from those of previous cohorts because they were only starting their adult lives at the onset of the societal transition. The cohort of 1970-74 has experienced a pronounced decline in the entry into marriage. In Russia, the curve is shifted to the left, which indicates that the youngest cohort has experienced first marriage earlier than the preceding ones and illustrates the rejuvenation process. The curve of the youngest in Bulgaria has clearly shifted downwards compared to the three older cohorts; however its part beyond age 25 does not decrease as much as the one that lies below age 25. This cohort probably has experienced modest postponement.
Table 5: Cumulative percent ever entering first marriage by age 40, Bulgaria and Russia
Experiencing the event by age 40 Cumulative
percent
95% confidence intervals
Mean age* 95% confidence
intervals BULGARIA
Men
1985-1989 88 84.8 90.8 24.4 24.0 24.7
1990-1994 80 76.0 84.2 24.6 24.2 25.0
1999-2003 49 44.4 54.4 26.4 25.9 26.9
Women
1985-1989 90 87.8 92.5 21.1 20.8 21.3
1990-1994 86 82.7 88.4 21.2 21.0 21.5
1999-2003 62 57.9 67.0 24.1 23.7 24.6
RUSSIA
Men
1985-1989 90 86.6 92.9 24.1 23.7 24.4
1990-1994 90 86.9 92.7 23.9 23.4 24.3
1999-2003 78 72.9 82.2 24.7 24.2 25.2
Women
1985-1989 94 91.8 95.1 22.2 21.9 22.6
1990-1994 88 84.7 90.4 21.5 21.0 21.9
1999-2003 79 75.3 82.9 22.5 22.1 22.8
Figure 4: Smoothed hazard rates for entering first marriage of four cohorts born in 1940-44, 1950-54, 1960-64, 1970-74, females
0
.0
5
.1
.1
5
.2
.2
5
10 20 30 40
Age
1970-74 1960-64
1950-54 1940-44
Bulgaria
0
.0
5
.1
.1
5
.2
.2
5
10 20 30 40
Age
1970-74 1960-64 1950-54 1940-44
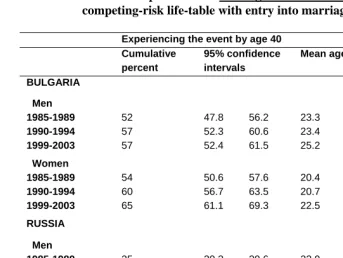
Entry into first union: marriage and non-marital cohabitation as competing risks
In this section, we discuss two types of entry into first union, direct marriage or non-marital cohabitation, as competing risks. The trend of first union formation is the same in both countries: union formation increasingly starts as cohabitation, confirming the findings and predictions of previous studies about establishing cohabitations as a new form of household formation in Central and Eastern Europe during the 1990s (Lesthaeghe and Surkyn 2002). This does not mean, however, that non-marital cohabitation did not exist in these countries before the fall of communism – it did. It is just that only during the 1990s the spread of cohabitation took place in an explosive manner (Koytcheva and Philipov 2008; Zakharov 2008). This observation is of primary significance for demographic analyses on union formation and fertility in the two countries.
From the results provided in Tables 6a and 6b, we learn that in Bulgaria the cumulative percentage for the first union being a non-marital cohabitation is considerably higher compared to marriage. This is mainly because couples often begin to cohabit a few months before marriage. It is common for this type of cohabitations, observed in Bulgaria well before the 1990s (Hoem and Kostova 2008), to start at the time when a date of the forthcoming marriage is fixed. This observation is supported by the quick conversion of non-marital cohabitation to marriage (shown below in the paper) and by the fact that the mean age of entry into cohabitation is lower than that for marriage. In Russia, this pattern is much less pronounced.
Table 6a: Cumulative percent ever starting a first union as cohabitation, competing-risk life-table with entry into marriage as competing event
Experiencing the event by age 40 Cumulative
percent
95% confidence intervals
Mean age* 95% confidence
intervals BULGARIA
Men
1985-1989 52 47.8 56.2 23.3 22.8 23.7
1990-1994 57 52.3 60.6 23.4 23.0 23.9
1999-2003 57 52.4 61.5 25.2 24.6 25.7
Women
1985-1989 54 50.6 57.6 20.4 20.1 20.7
1990-1994 60 56.7 63.5 20.7 20.4 21.0
1999-2003 65 61.1 69.3 22.5 22.1 23.0
RUSSIA
Men
1985-1989 35 30.3 39.6 22.9 22.1 23.7
1990-1994 47 42.1 51.3 23.2 22.6 24.0
1999-2003 66 61.0 70.2 23.3 22.5 23.4
Women
1985-1989 34 30.6 38.1 21.6 21.0 22.2
1990-1994 46 41.8 50.0 20.9 20.3 21.5
1999-2003 63 59.1 67.2 21.5 21.0 22.0
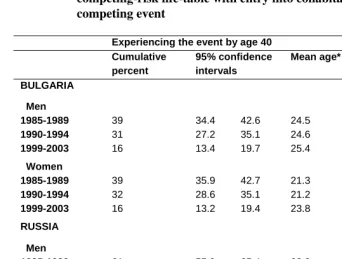
Table 6b: Cumulative percent ever starting a first union as a marriage, competing-risk life-table with entry into cohabitation as competing event
Experiencing the event by age 40 Cumulative
percent
95% confidence intervals
Mean age* 95% confidence
intervals BULGARIA
Men
1985-1989 39 34.4 42.6 24.5 23.9 25.0
1990-1994 31 27.2 35.1 24.6 23.9 25.2
1999-2003 16 13.4 19.7 25.4 24.6 26.2
Women
1985-1989 39 35.9 42.7 21.3 20.9 21.8
1990-1994 32 28.6 35.1 21.2 20.8 21.6
1999-2003 16 13.2 19.4 23.8 22.9 24.7
RUSSIA
Men
1985-1989 61 55.9 65.4 23.9 23.5 24.3
1990-1994 51 46.2 55.5 23.6 23.0 24.2
1999-2003 28 23.5 32.1 24.0 23.3 24.8
Women
1985-1989 63 58.7 66.3 22.1 21.7 22.5
1990-1994 50 46.2 54.5 21.3 20.8 21.8
1999-2003 33 28.9 36.8 21.8 21.2 22.3
* at transition, conditional on transition before age 40
3.2.2 Duration of first union
Does the drastic rise in the preferences to start a union with cohabitation indicate that cohabitation is an increasingly preferred stable form of union? We can approach this question by studying duration of cohabitation.
of the partner: as mortality is higher among males it is likely that the sample will include a larger number of widowed females than males.
Duration of first cohabitation
We start with a discussion on the duration of first non-marital cohabitations. They may later result into marriage, they may end with the separation of the two partners, or they may end because one partner dies. We estimated competing-risk life tables for the two risks: transition to marriage or separation (Tables 7a and 7b).
Table 7a indicates that the transition to marriage was a very intensive one during the first period. At this time, most of the cohabitations were a start to living together several months before a planned marriage. In Bulgaria, nearly all cohabitations turned into marriage within six years after the start. In Russia, 19% of cohabitations did not result in marriages within six years.
During the next two periods, fewer cohabitations resulted in marriage in both countries. The decrease is drastic during the third period. Nearly half of the cohabitations in the 1999-2003 synthetic cohort in Russia will not result in marriage, and the same holds for nearly 40% of cohabitations in Bulgaria.
Table 7a: Cumulative percent of cohabitations that turn into marriages by the indicated exact year, with separation as a competing risk (based on the responses of female respondents)
1985-1989 1990-1994 1999-2003
Years Cum. Conf. Interval Cum. Conf. Interval Cum. Conf. Interval
percent low high percent low high percent low high
Bulgaria
1 77 81 73 63 67 59 38 43 33
2 87 90 84 74 78 70 50 55 45
3 92 94 88 79 82 75 55 60 50
6 95 92 96 84 80 87 61 56 66
Russia
1 53 59 46 44 50 38 27 31 22
2 67 73 61 57 63 51 40 45 35
3 72 77 65 62 67 55 48 54 43
6 81 75 86 65 58 71 54 48 58
Table 7b: Cumulative percent of cohabitations that end because of separation by the indicated exact year, with entry into marriage as a competing risk (based on the responses of female respondents)
1985-1989 1990-1994 1999-2003
Years Cum. Conf. Interval Cum. Conf. Interval Cum. Conf. Interval
percent low high percent low high percent low high
Bulgaria
1 0.2 0.0 1.2 0.6 0.2 1.6 2 0.8 3.4
2 1.0 0.3 2.3 1.0 0.4 2.2 4 2.4 6.2
3 1.2 0.5 2.7 2.1 1.1 3.7 5 2.9 7.0
6 (1.4) (1) 0.6 2.9 (2.9) (1) 1.6 4.8 7 5.1 10.4
Russia
1 2 0.7 4.6 3 1.4 5.7 7 4.4 9.7
2 6 3.5 9.9 6 3.4 9.1 13 9.6 16.5
3 7 3.9 10.6 8 5.0 11.9 19 15.2 23.3
Duration of first marriage
In this section, we address the duration of first marriage. The starting time is the date of entry into first marriage. This date may (i) coincide with the start of a first union, (ii) follow after the start of a first cohabitation resulting in marriage, or (iii) follow the dissolution of one or more non-marital cohabitations. Here, we do not distinguish between the three origins of a first marriage.
We describe the duration of first marriage until its break, which may be a divorce or the death of the partner. Hence, we apply a competing-risk estimation approach. The death of the partner is a low risk among younger respondents; however its effect grows with time elapsed after the start of the marriage, i.e. with advancing years into the marriage. Mortality is considerably higher among males, particularly during the beginning of the 1990s in Russia, and therefore an estimate based on their responses is likely to show a higher level of marriage survival compared with the responses of women. For this reason, we consider the responses of the women only. Thus, the results are conditional on the survival of women to report the event of interest. Tables 8a, 8b and 8c display the results of the estimations.
Table 8a shows that an end of first marriage due to the death of the husband is a rare event before 30 years into marriage. However, the difference between the two countries is apparent. In Russia, this percentage increased from 14 to 17% during the second period when a significant male over-mortality was recorded (Shkolnikov et al. 2004) and decreased to 12% in third period. In Bulgaria, about 7 to 9% of marriages end because of the male partner’s death at the time of 30 years into marriage. This level did not change considerably from 1985-1989 to 1999-2004.
The risk of marriage breakdown due to divorce is considerably higher during the first decades of the marriage (Table 8b). Divorces in Bulgaria slightly declined during the 1990s while in Russia they were on the increase. We study divorces in more detail in the next section.
Table 8c demonstrates the effect of both risks together. We recall that the numbers in Table 8c should be equal to the sum of the numbers from the corresponding cells in Tables 8a and 8b. The table shows that the duration of marriage in Bulgaria did not change considerably. It decreased significantly in Russia. The previous two tables show a decrease in the effect of a husband’s death and an increase in divorces; the latter has dominated significantly.
Table 8a: Cumulative percent of first marriages ending because of the death of the partner, with divorce as competing event, in years after the start of the marriage (based on the responses of female respondents)
1985-1989 1990-1994 1999-2003
Years Cum. Conf. Interval Cum. Conf. Interval Cum. Conf. Interval
percent low High percent low high percent low high
Bulgaria
10 2 1 3 1 0 2 1 0 2
15 2 1 3 2 1 4 2 1 3
20 3 2 5 3 2 4 3 2 4
25 6 4 9 5 3 7 5 3 7
30 9 7 12 7 5 10 9 6 11
35 15 11 19 14 11 18 12 9 15
40 21 16 26 20 16 24 19 16 23
Russia
10 2 1 3 4 3 6 3 2 6
15 4 3 5 6 5 8 5 3 7
20 6 4 8 9 7 12 6 5 9
25 10 8 13 13 11 16 9 7 11
30 14 11 18 17 14 20 12 10 15
35 19 16 23 22 19 26 18 15 21
Table 8b: Cumulative percent of first marriages ending because of divorce, with the death of the partner as competing event, in years after the start of marriage (based on the responses of female respondents)
1985-1989 1990-1994 1999-2003
Years Cum. Conf. Interval Cum. Conf. Interval Cum. Conf. Interval
percent low high percent low high percent low high
Bulgaria
5 4 3 6 4 3 5 6 4 8
10 8 6 10 8 6 10 9 7 12
15 10 8 13 11 9 13 12 9 15
20 11 8 13 13 10 15 13 10 16
25 11 9 14 14 11 17 14 11 17
30 12 9 15 15 12 18 15 12 18
Russia
5 10 8 13 13 10 16 16 13 20
10 14 12 17 20 17 23 26 22 30
15 20 17 23 24 21 28 32 27 36
20 23 19 26 27 24 31 35 31 39
25 25 21 28 29 25 33 37 33 42
Table 8c: Cumulative percent of first marriages ending because of divorce or the death of the partner, in years after the start of the marriage (based on the responses of female respondents)
1985-1989 1990-1994 1999-2003
Years Cum. Conf. Interval Cum. Conf. Interval Cum. Conf. Interval
percent low high percent low high percent low high
Bulgaria
5 5 4 7 5 3 6 6 4 9
10 9 7 12 9 7 11 10 7 13
20 14 12 18 15 13 19 16 13 19
25 18 15 22 19 16 22 19 16 22
30 21 18 26 22 19 26 24 21 28
40 33 28 39 35 31 40 35 31 40
50 -- -- -- (52)(1) 46 60 51 46 56
Russia
5 11 9 14 15 12 18 18 14 22
10 16 14 19 24 21 28 29 25 34
20 29 25 32 37 33 40 41 37 46
25 35 31 40 42 38 46 46 42 50
30 40 36 45 47 43 51 51 47 55
40 53 47 59 59 55 64 64 60 68
50 -- -- -- (70)(1) 60 80 79 76 83
Figure 5: Smoothed hazard rates for the end of first marriages because of divorce or the death of the partner in 1999-2003, Bulgarian and Russian females
0
.0
2
.0
4
.0
6
.0
8
0 10 20 30 40 50
Years since the start of marriage
Bulgaria Russia
Divorce
The comparative analysis of first marriages revealed a significant difference in the intensities of divorces in the two countries. In order to highlight further this difference, we introduce a different competing-risk life table, where the other risk is treated as censoring, i.e. as if the partners do not die. Divorce is the only way to break-up an existing marriage. Table 9 demonstrates the results.
Divorces have increased moderately in Bulgaria. In Russia, they have marked a significant rise in each subsequent period. Thus, in Russia the level is more than twice that observed in Bulgaria.
Table 9: Cumulative percent of ending first marriages by divorce, censored at the death of the partner, at indicated years after the start of the first marriage (based on the responses of female respondents)
Years 1985-1989 1990-1994 1999-2003
Bulgaria Russia Bulgaria Russia Bulgaria Russia
5 4 10 4 13 6 17
10 8 14 8 20 9 26
20 11 23 13 28 13 36
25 12 25 14 30 14 38
30 12 27 15 32 16 40
Figure 6: Smoothed hazard rates of ending first marriage by divorce, censored at the death of the partner, 1999-2003, Bulgarian and Russian females
0
.0
1
.0
2
.0
3
0 10 20 30 40
Years since the start of marriage
3.3 The experience of childbearing
We describe in sequence the birth of a first child (transition to parenthood) and of a second child. The third section presents the results for the duration of unions until the birth of the first child.
3.3.1 Experience of transition to parenthood
As in most Central and Eastern European countries, universality of motherhood is observed in Bulgaria and Russia (Table 10), while the percentages of men who have ever experienced fatherhood is considerably lower. Transition to parenthood sets in at an earlier stage in life; this observation is in line with the early union entry mentioned in the previous chapter. Since transition to fatherhood raises many questions that are outside the scope of this paper, we continue the discussion about transition to parenthood by focusing on women only (for more data on male fertility in Bulgaria and Russia, see the appendix in Philipov and Jasilioniene 2007).
Table 10 informs about the two major trends in the transition to motherhood observed in Bulgaria: a decrease in fertility and birth postponement, trends that have emerged in the 1990s. The fall in first births by 11 percentage points from 1990-94 to 1999-2003 is considerable. When this value is subtracted from 100, we get an indicator of childlessness. It stood at 19% in the 1999-2003 period in Bulgaria.
In Russia, the level of entry into motherhood did not fall below 90%. Childlessness remained below 10% for each of the three periods; hence there is no indication of rising voluntary childlessness. The mean age at entry into motherhood decreased in the beginning of the 1990s compared with the second half of the 1980s. At the turn of the century, the mean age resumed the level observed in the 80s. A more detailed study is necessary to find out whether this resumption is the result of a population policy effect becoming less pronounced (to learn more about the effect of the pronatalist policy implemented in the 80s in Russia, read in Zakharov and Ivanova, 1996; Zakharov, 1997, 1999, 2008; Avdeev and Monnier, 1995; Avdeev, 2003) or whether it indicates the emergence of first birth postponement.
Bulgaria and Russia will persist for a relatively long time (Kohler et al. 2002, Sobotka 2004).
Figure 7 depicts the hazard schedules of first births. The schedules for the two countries were approximately equal in 1990-1994, but in the second period (1990-1994) the Bulgarian schedule was lower than the Russian one and its mode stands to the right of the Russian one. The Bulgarian schedule has become wider as a result of an increase in the variance by age of transition to motherhood.
Table 10: Cumulative percent of women who ever have had a first child by age 40, Bulgaria and Russia
Experiencing the event by age 40 Cumulative
percent
95% confidence intervals
Mean age* 95% confidence
intervals BULGARIA
1985-1989 93 90.6 94.8 22.0 21.8 22.3
1990-1994 92 89.9 93.9 22.0 21.8 22.3
1999-2003 81 77.7 84.4 23.9 23.6 24.3
RUSSIA
1985-1989 97 95.6 97.8 23.4 23.0 23.7
1990-1994 95 93.3 96.5 22.7 22.3 23.1
1999-2003 92 88.7 93.9 23.3 23.0 23.7
* at transition, conditional on transition before age 40
Figure 7: Smoothed hazard rates for having a first child in 1990-1994 and 1999-2003, Bulgarian and Russian females
0
.05
.1
.1
5
.2
15 20 25 30 35 40
Age
Bulgaria Russia
1990-1994
0
.05
.1
.1
5
.2
15 20 25 30 35 40
Age
Figure 8: Smoothed hazard rates for having a first child of four cohorts born in 1940-44, 1950-54, 1960-64, 1970-74,
Bulgarian and Russian females
0
.0
5
.1
.1
5
.2
.2
5
15 20 25 30 35 40
Age
1970-74 1960-64 1950-54 1940-44
Bulgaria
0
.0
5
.1
.1
5
.2
.2
5
15 20 25 30 35 40
Age
1970-74 1960-64 1950-54 1940-44
There are substantial differences in childbearing behavior by ethnic groups in Bulgaria, and our findings are similar to those reported in previous studies, based on different data sets (e.g., Koytcheva 2006; see also Koytcheva and Philipov 2008). Table 11 gives the mean ages at entry into parenthood by ethnic groups in Bulgaria. The mean ages have increased significantly among Bulgarians as well as among Turks. The increase by about 1 year in the Roma population is not statistically significant, although from a demographic point of view it can be assessed as existing and being moderate. The table also provides the cumulative percent of women who ever have had a first child by age 40. The ethnic group of the Bulgarians is the only such group who has done so, and they did so only in the last period, where universality of parenthood is not observed. Confidence intervals play an important role for this inference.
Table 11: Mean age* at having a first child and cumulative percent of women who ever had a first child by age 40, Bulgarian ethnic groups
Mean ages: 1985-1989 1990-1994 1999-2003
Mean 95% conf.
interval Mean
95% conf.
interval Mean
95% conf. interval Men:
Bulgarian 25.6 25.2 26.0 25.9 25.4 26.3 27.3 26.8 27.8
Turks 23.5 22.7 24.3 23.5 22.6 24.5 24.6 23.2 26.1
Roma 21.7 20.3 23.1 22.8 20.8 24.8 23.3 21.6 25.0
Women:
Bulgarian 22.4 22.1 22.6 22.5 22.2 22.8 24.7 24.3 25.1
Turks 20.6 19.8 21.3 20.6 19.8 21.4 22.0 20.7 23.2
Roma 18.9 17.8 20.0 19.1 18.0 20.2 20.0 19.1 21.0
Cumulative percent:
Bulgarian 92 90 95 91 88 93 79 75 83
Turks 97 90 99 97 92 99 94 86 98
Roma 87 71 99 94 85 98 91 80 97
3.3.2 Duration of childlessness
This section considers the duration of childless life of a couple since the time the union was formed. The unit of analysis is a union, independent of whether it is cohabitation or marriage. The process time starts at the date at which the union was formed. Cohabitations turned into marriage are considered as a union whose life has started at the time of cohabitation formation. The event of interest is the birth of the first child, union disruption is considered as a competing risk. An end to the union owing to the death of the partner is a rare event, hence it is disregarded. Table 12 gives the estimated cumulative percentages of couples that have become parents, by union duration. The tables also provide the average time to transition to parenthood.
Table 12: Cumulative percent of couples who ever have had a first child by the year after the start of the union, with separation as competing risk (based on the responses of both male and female respondents)
Bulgaria Russia
Duration 1985- 1990- 1999- 1985- 1990- 1999-
(years) 1989 1994 2003 1989 1994 2003
1 39 37 27 42 32 22
2 74 71 56 72 64 45
3 84 81 69 80 74 57
5 91 89 80 86 80 69
10 95 92 86 89 85 73
Mean* 1.7 1.7 2.1 1.8 1.8 2.0
* at transition, conditional on first childbirth before the year 15th year
Additional estimates indicate that the proportion of childlessness among Turkish and Roma couples in Bulgaria was around 7% in the 1999-2003 period. It is the Bulgarian ethnic group only that has witnessed an increase in childlessness during the 1990s.
3.3.3 Second birth
We analyze the occurrence of second births by studying the time elapsed since the first childbirth in the three periods and in the four birth cohorts of women. Additionally, we provide some information on the ethnic groups in Bulgaria as far as the birth of the second child is considered.
The life table given in Table 13 refers to women who have ever had a first birth. The origin of time is the date of the birth of the first child.
The cumulative percentages for the 1985-89 period grow faster in Bulgaria: 3 years after first childbirth 37% of the mothers concerned have a second child, while in Russia this percentage reaches 30 points. However, 16 years after the birth of the first child, the cumulative percents in the two countries are about equal, i.e. the ultimate level of having a second child is about the same. During the subsequent years, the ultimate level decline considerably in both countries. The data for the 1999-2003 period indicate that in Russia barely 50% of the women who ever have had a first child will ever have a second one; the corresponding figure for Bulgaria is 60%.
The means represent the average interval between first and second birth. In the 1985-1989 period it was lower in Bulgaria and increased considerably during the 1999-2003 period in both countries. This increase indicates a postponement of second birth relative to the date of the birth of the first child.
Table 13: Cumulative percent of second births, by years after the first birth, and means of the interval between the first and the second birth, Bulgarian and Russian females
Bulgaria Russia
Year after 1985- 1990- 1999- 1985- 1990- 1999-
first birth 1989 1994 2003 1989 1994 2003
1 2 2 2 4 2 1
2 21 17 9 18 11 7
3 37 31 18 30 20 11
5 59 48 35 53 34 18
10 75 65 54 73 50 41
16 77 68 59 78 56 49
95% conf. interval at 16th year
73-80 64-71 56-63 75-81 52-60 45-54
Mean* 3.5 3.6 5.2 4.6 4.8 6.6
95% conf.
interval 3.3-3.7 3.4-3.8 4.9-5.5 4.4-4.9 4.5-5.2 6.1-7.1
* at transition, conditional on the birth of the second child before 16 years
Figure 10 shows the smoothed hazard rates for the four cohorts. These estimates have been also made by using a life table where time is measured since the birth of the first child. The event of interest is the birth of a second child, and the population at risk is formed by women who have ever had a first child. The hazard schedule of the youngest cohort in each country differs significantly from those of the other three cohorts. However, both of them look relatively similar and both illustrate a marked postponement and decline in the intensity of second births.
Figure 9: Smoothed hazard rates for the birth of a second child, in years since the birth of the first child, Bulgarian and Russian females
0
.05
.1
.1
5
.2
0 5 10 15
Years since the birth of 1st child
Bulgaria Russia
1990-1994
0
.0
5
.1
.1
5
.2
0 5 10 15
Years since the birth of 1st child
Figure 10: Smoothed hazard rates for having a second child of four cohorts born in 1940-44, 1950-54, 1960-64, 1970-74, in years since the birth of the first child, Bulgarian and Russian females
0
.0
5
.1
.1
5
.2
0 5 10 15
Years since the birth of 1st child
1970-74 1960-64
1950-54 1940-44
Bulgaria
0
.0
5
.1
.1
5
.2
0 5 10 15
Years since the birth of 1st child
1970-74 1960-64
1950-54 1940-44
Table 14 displays the mean ages of women at second childbirth. The youngest cohort is censored from the right: at the time of the survey, it was 30-34 years of age. Apparently, second births are likely to be witnessed in later years in this cohort. The censoring may bias the mean age given in the table by making it too low.
Table 14: Mean ages at second childbirth, four cohorts of Bulgarian and
Russian females
Cohort born in: 1940-44 1950-54 1960-64 1970-74
Bulgaria 26.5 25.5 25.5 (25.1)
Russia 28.1 28.2 26.0 (26.0)
Note: the mean ages for the youngest cohorts are censored at the time of interview at age 30-34.
We conclude this chapter with brief information on the ethnic groups in Bulgaria (Table 15). Progression to second birth has been universal among the Romas and nearly universal among the Turks in the beginning of the 1990s. It has fallen significantly in both ethnic groups about 10 years later. Note that Roma and Turkish families increasingly chose to have one child only, which is remarkable. It is equally remarkable that progression to second child among this Bulgarian ethnic group for the 1999-2003 period (52%) is very close to that observed in Russia (49%, Table 13).
The mean duration since first birth also has increased significantly. A decrease and postponement has been observed at higher levels for the Bulgarian ethnic group.
Table 15: Cumulative percent of second births and mean interval between the birth of the first and the second child, by ethnic groups,
Bulgarian females*
1985-1989 1990-1994 1999-2003 Cum.
percent Mean
Cum.
percent Mean
Cum.
percent Mean
Bulgarians 74 3.6 62 3.7 52 5.5
Turks 89 3.2 87 3.5 77 5.0
Roma 92 2.9 86 2.5 84 3.2
* The cumulative percent is estimated until the 15th year following the birth of the first child for Bulgarians and Turks, and until the 10th
3.4 Recent trends and the second demographic transition: a schematic comparison
Our detailed study of diverse trends related to union formation and fertility leads to the question that we have already posed in the introductory section of the paper: have Bulgaria and Russia witnessed the second demographic transition?
The second demographic transition comprises a number of changes in the demo-graphic trends. Van de Kaa (1997:8) describes 15 stages of its development, based on an empirical examination of data for European countries for the period 1965-1995. It is convenient to use this classification for our two countries. The stages are listed below in italics as they appear in the original, and each is followed by a comment about its applicability to Bulgaria and Russia.
1. Decline in total period fertility due to reduction in fertility at higher ages of childbearing: decline in high-order birth rates.
- We observed a decline in second births in both countries since the second half of
the 1980s, reflected in Table 13.
2. Avoidance of pre-marital pregnancies and "forced" marriages.
- We did not consider this topic.
3. Not withstanding that the mean age at first marriage continues to decline.
- The mean age at first marriage remained low in Bulgaria until the first half of the
1990s and it did decline in Russia (Table 5).
4. Postponement of childbearing within marriage, fertility among young women declines, lower-order birth rates decline, this accentuates decline in total fertility
- Table 12 shows that postponement of first births within a union context was not
observed before the first half of the 1990s; a rising mean ages is observed in later years but cannot be verified statistically. As regards fertility among young women, we do find a decline (see Table A12 in Philipov and Jasilioniene 2007 where we provide complete life tables).
5. Increase in judicial separation and divorce (when allowed).
- Table 9 shows that divorces increased moderately in Bulgaria and more
signify-cantly in Russia.
6. Postponement of marriage largely replaced by pre-marital cohabitation, increase in age at first marriage.
(the further decline refers to Stage 10). Tables 5 and 6b show an increase in the age at first marriage in Bulgaria but no such increase in Russia as far as the periods 1985-1989 and 1999-2003 are compared.
7. Cohabitation becomes more popular, marriage postponed until bride is pregnant, increase in pre-marital births, increase in mean age at first birth.
- Tables 6a and 6b display the relative increase in cohabitation, showing that this
type of union is preferred when the first two periods are compared. An increase in the mean age at first birth is observed in Bulgaria in the second half of the 1990s; no increase was observed in Russia during the period 1999-2003 relative to 1985-1989 (Table 10).
8. Legislation of sterilization and abortion further reduce unwanted fertility; fertility at border ages of childbearing declines further.
- This topic has not been discussed in the present paper.
9. Cohabitation gains further support, is frequently also preferred by the widowed and the divorced.
- Tables 6a and 6b show the relative increase in cohabitation as a preferred form of
the first union when the last two periods are compared.
10. Cohabitation increasingly seen as alternative to marriage, non-marital fertility increases.
- Table 7a, also mentioned in Stage 6, shows the change in the union status for the
second to the third period. Regarding non-marital fertility, vital statistics show a drastic increase in births outside of wedlock after the transition in both countries, particularly in Bulgaria. In 2004, the proportion of non-marital births constituted 48.7% of all live births in Bulgaria and 29.8% respectively in Russia (Council of Europe 2006). Our calculations based on the GGS data confirm this trend, showing a continuous rise in these births. In Bulgaria, this climb is evident for all three birth orders that have been studied, while in Russia, the increase is significant for the first birth and modest for the other birth orders (Appendix 2; see also Philipov and Jasilioniene 2007 for a more extensive discussion on the issue).
11. Total fertility rates tend to stabilize at low level.
- The vital statistics data of the two countries suggest that it is the case with Bulgaria
the TFR was between 1.2 and 1.3. In Russia, relatively similar trends in period fertility were observed. The TFR dropped below the replacement level in the late 1960s in Russia. During the 1970s, fertility was relatively stable, with the TFR fluctuating between 1.90 and 2.05. The 1980s witnessed the last notable fertility increase in Russia when the TFR rose from 1.87 in 1980 to 2.23 in 1987. Beginning from 1988, the downward trend in fertility resumed. The bottom was hit in 1999, when the TFR dropped to 1.16. Then, it has been slowly growing to reach 1.33 in 2004 (Council of Europe 2005, 2006).
12. Total fertility rates increase slightly where women who postponed births start a fertility career; increase of lower order birth rates at higher ages of
childbearing.
- Figure 7 shows that towards the turn of the Century first-birth hazards for higher
ages declined, but not as much as for the lower ages.
13. Not all postponed births can be realized at later reproductive ages.
- This topic has not been discussed in the present paper.
14. Voluntary childlessness becomes increasingly significant.
- This was observed in Bulgaria towards the turn of the century, but not so in Russia
(Table 10).
15. Cohort fertility appears to stabilize below replacement level.
- Figures 8 and 10 show that the youngest cohort in Bulgaria has a lower fertility
compared to the older cohorts; this is evident for Russia only for second births. Stabilization of low cohort fertility is not yet observed, although it is likely to be expected, based on the observation for the youngest cohort.
The information supplied shows that most of the stages have taken place in both countries. In Bulgaria, only the last stage and in Russia the last two stages are not supported by the data. The second demographic transition seemingly is not completed yet in the two countries and the trends described in the last two stages can be expected to emerge in the near future. In addition, note that all of our inferences are valid under the condition that the tempo effect on the values of life tables is not too large.
4. Summary and discussion
Our main task was to provide a thorough descriptive analysis of recent demographic trends in union formation and fertility in Bulgaria and Russia. We achieved this by using GSS data from 2004 and applying the life table method. Below we summarize our findings and provide some conjectures concerning the observed diversity and future course of demographic trends in the two countries.
Leaving the parental home takes place relatively early in life in both countries; however, the trend towards leaving the nest later is all the time more evident, particularly in Bulgaria. During the 1990s, the rate of leaving home considerably declined in Bulgaria and the mean age at leaving significantly increased. In Russia, the intensity of leaving home remains high and the proportion of those still living in the parental home at age 40 is very small (7-8 percent). A moderate increase in the mean age at leaving home is observed among Russian men, whereas the female pattern of nest leaving remains stable.
We extended the description of the process of leaving the parental home to separation from the parental family, where the new issue is the formation of an own union while remaining in the home of the parents. The extended view of separation from the parental family discussed above rarely has been addressed by the demographic literature and it needs a more deliberate consideration, not only within the context of the two countries considered in this paper.
Starting an own family in the home of the parents has been traditional and widely spread in the past in Russia and Bulgaria. However, since the early 1990s the rate of starting a first union before leaving the parental home has been dropping drastically for men and women in both countries. This observation points to the emergence of a new pattern of behavior, requiring in-depth analysis. In Bulgaria, along with this fall we observe a simultaneous increase in the risk of leaving home before forming a first union. Both newly established trends run in parallel with the growing individualization and increasing popular mobility during the transition period, modifying traditional behavior. In Russia, a relative increase in forming an own family along with leaving home is observed for men, whereas for women the reason for the decline in the rate of forming a union before leaving the parental home is much less apparent.