RP-HPLC DETERMINATION OF
PARACETAMOL-CONTAINING COMPONENTS IN QUATERNARY AND BINARY
MIXTURES
Hamad M. Adress Hasan,
[a]*Ibrahim H. Habib
[b]and Amira A. Khatab
[a]Keywords: use the Keywords style for the list of keywords, separating with a comma each items.
A simple reversed-phase high-performance liquid chromatographic (RP-HPLC) technique for the simultaneous determination of ascorbic acid (ASC), methionine (MET), paracetamol (PAR) and caffeine (CAF) has been developed and validated. The cited components are separated completely using Brownlee Bio C18 column (250 x 4.6 mm, 5 μm) by isocratic elution of water-acetonitrile (85:15) (v/v) mobile phase flowing at 1.0 mL min-1 at ambient temperature. The spectrophotometric detection is carried out sequentially at 260 nm for ASC (2
min), 200 nm for MET (1 min), 240 nm for PAR (1.5 min) and 270 nm for CAF (1.5 min). Total chromatographic analysis time per sample was approximately 6 min. The linear range of determination for ASC, MET, PAR and CAF are 40-160 μg mL-1, 40-200 μg mL-1, 20-400 μg
mL-1 and 40-160 μg mL-1, respectively. Thus, proposed method can be successfully applicable to analysis the pharmaceutical preparation
containing the above mentioned drugs without any interference of excipients. Recovery ranges and relative standard deviation are in turn 96.46 to 102.70 %, 2.65 % for ASC, 96.33 to 103.43 %, 2.93 % for MET, 98.31 to 102.73 %, 2.09 % for PAR and 95.82 to 102.13 %, 2.68% for CAF.
*Corresponding Authors
E-Mail: drhamadmhasn85@yahoo,com
[a] Chemistry Department, Faculty of Science, Omar El – Mukhtar University, Libya.
[b] El–Doki Research Centre, Cairo, Egypt.
Introduction
Most of the drugs in multi component dosage forms can be analyzed by HPLC method because of the following advantages. Speed (analysis can be accomplished in 20 min or less), greater sensitivity (various detectors can be employed), improved resolution (wide variety of stationary phases), reusable columns (expensive columns but can be used for many analysis), ideal for the substances of low volatility, easy sample recovery, precise and reproducible, and easy of automation.
Reversed phase liquid chromatography is generally used for pharmaceutical applications because most of the drug molecules are polar in nature and hence travel faster through the column of non-polar stationary phase and take less time to elute. This is because of the lower affinity between the polar compounds and the stationary phase. In chromatographic analysis, the main problem of this method involves the optimization of experimental conditions such as selection of column type, temperature of column, variety and composition of mobile phase, selection of specific wavelength and cheap instrumentation. In spite of the fact that this method undoubtedly provides more sensitive determination than the spectrophotometric methods, Reversed Phase Chromatography (RPC) is effective, reproducible and rugged and often easier for UV detectors. It has now become the method of choice for most of drug and combinations of drugs.1,2
The objective of using this method in the present study is to develop and validate a specific, accurate, precise and reproducible quality control method for ASC, MET, PAR and CAF in their quaternary and binary combinations.
Experimental
Chemicals and Reagents
All chemicals are of HPLC-analytical grade and are used without further purification. Phosphoric acid and potassium hydroxide, used for adjusting pH of mobile phase, were purchased from BDH, UK. PAR is prepared as reference standard by methanolic extraction from PAR tablets (PARALIEF, Clon Medica, Irland) with m. p. 260 °C, CAF is obtained from PRS Panreac (Spain), MET from Riedel-de Haen (Germany) and ASC from ANALAR, UK.
Pharmaceutical formulation
Commercial pharmaceutical samples of Panadol extra tablets containing 500 mg PAR and 65 mg CAF (Teriak, Egypt), Hepamol tablets containing 500 mg PAR and 100 mg MET (Hikma,, Egypt), Efferalgan Vitamin C effervescent tablets containing 330 mg PAR and 220 mg ASC (UPSA,Tunisie) were purchased from the local market of EL-Beida city (Libya)
Apparatus
This low operating temperature is used because the stability of ascorbic acid decreases with increasing temperature. The injection volume is 10 µL. The system is controlled and data analyses are performed with the TotalChrom Workstation Navigator software and peak areas are estimated by Microsoft ORIGIN software program (version 6). Linearity data are computed on a personal computer using Microsoft Excel program (version 2003, Microsoft Co., Redmond, USA).
Preparation of standard stock and calibration solutions
ForPAR, MET, ASC and CAF standard solutions, 50 mg each of standard powdered analytes were weighed, transferred to 4 separate 100 mL volumetric flasks, dissolved in distilled water and completed to the mark having final concentrations of 500 μg mL-1 each.
Series 10 dilutions of the standard stock solutions are made separately by pipetting out 0.25 up to 10 mL of standard stock solutions into separate 25 mL volumetric flasks and diluting to volume with distilled water to produce the concentrations ranging from 5-200 μg mL-1.
Preparation of synthetic quaternary mixtures
Equal volumes (3 mL) of the working standard solutions of each drug are transferred into a 25-mL volumetric flask to prepare synthetic quaternary mixtures of PAR with MET, ASC or CAF. The solutions are then diluted with distilled water to the volume.
Preparation of pharmaceutical samples
One tablet is vigorously dissolved in distilled water with magnetic stirrer, transferred to 250 mL volumetric flask and completed to the mark with distilled water. The stock solution is filtered through a Whatman Filter paper number 42 and 1 mL of the filtrate is transferred to 25-mL volumetric flasks and diluted to the mark with distilled water.
Linearity and range
The linearity of the method is determined at six concentration levels ranging from 5 to 200 µg mL-1 for
each component. The calibration curves are constructed by plotting peak heights versus concentrations of cited components, and the regression equations are calculated.
RESULTS AND DISCUSSION
Optimization of chromatographic conditions
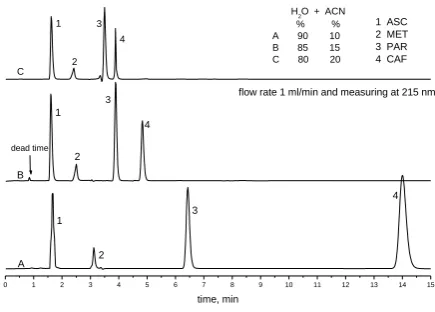
During preliminary investigations of chromatographic behaviour of CAF, PAR, ASC and MET the influence of mobile phase composition at various ratio and its pH value were investigated. From the chromatograms shown in it is evident (Figure 1), that a mobile phase consisting of (water-acetonitrile) (85:15) (v/v) is most suited to achieve fast and maximum separation and sensitivity.
It is evident also that variation in pH value does not improve in the separation (Figure 2). The chromatographic run time is 6 min and the dead time t0 is 0.85 min which is
defined by the time required to move the mobile phase from the injection loop, capillary connections and the column to the detector as demonstrated in Figure 1.
Figure 1. Effect of composition of mobile phase on the separation performance with flow rate 1 mL min-1 and monitoring at 215 nm.
Figure 2. Effect of 10 mM phosphate buffer at different pH on the separation performance.
Based on the highest UV absorbance for ASC, MET, PAR and CAF, 260, 200, 240 and 270 nm are chosen for detection of this new HPLC method at which the best detector responses for all substances are obtained. The overlapped UV Spectrum is shown in Figure 3. The proposed method is subjected to validation for various parameters like system suitability, specificity, range and linearity, accuracy, precision and robustness in accordance with International Conference on Harmonization guidelines.
Linearity
Figures 4 through 7 demonstrate linearity of peak height with the concentration and Table 1 presents the slope and intercept of the regression line, correlation coefficient (r). Excellent linearity is obtained for all compounds between the peak heights and concentrations of 10-120 µg mL-1 with
r = 0.9919, 10-400 µg mL-1 with r = 0.9976, 10-240 µg mL-1
with r=0.9954 and 10-240 µg mL-1 with r=0.9995 for ASC,
MET, PAR and CAF, respectively.
0 1 2 3 4 5 6 7 8 9 10 11 12 13 14 15
A
4 3
2 1
time, min
dead time
flow rate 1 ml/min and measuring at 215 nm 1 ASC 2 MET 3 PAR 4 CAF
B
4
2 1 C
3 4
3 2 1
H2O + ACN % % A 90 10 B 85 15 C 80 20
4 3
pH 5 4
3 2 1
1 ASC 2 MET 3 PAR 4 CAF pH 6 4
3 2 1
85% 10 mM phosphate buffer +15% ACN with flow rate 1 ml/min and measuring at 215 nm
pH 7
0 1 2 3 4 5 6 7 8 9 10 11 12 13 14 15
4 3 2 2
1 1
time, min
Figure 3. Overlapped spectra of ASC, MET, PAR and CAF.
Limits of detection and quantification
Sensitivity of the proposed method is estimated in terms of limit of detection (LOD) and limit of quantification (LOQ). LOD, which is defined as the lowest active substance concentration that can be determined by a method, usually cannot be calculated precisely and accurately. On the other hand, LOQ is the concentration of the sample used in analysis that can be obtained with adequate precision and accuracy. These limits are estimated by the two following equations.
𝐿𝑂𝐷 =3×𝑆y/x
𝑆 (1)
𝐿𝑂𝑄 =10×𝑆y/x
𝑆 (2)
where Sy/x is the residual standard deviation and S is the
slope of the regression line.
The LOD is calculated to be 3.75, 13.74, 4.14 and 10.50 µg mL-1 and the LOQ is calculated to be 12.50, 45.81, 13.82
and 35.00 µg mL-1 for ASC, MET, PAR and CAF,
respectively
Suitability of the method
The resolution, Rs, of two neighbouring peaks is defined
as the ratio of the distance between two peak maxima. It is the difference between the retention times of two solutes divided by their average peak width. For baseline separation, the ideal value of Rs is 1.5. It is calculated by
using Eqn. (3).
𝑅s= (𝑡R1− 𝑡R2)/0.5(𝑡w1+ 𝑡w2) (3)
The calculated resolution values between each peak-pair are no less than 3.60 and the selectivity is not less than 1.30. Three fundamental parameters that influence the resolution of a chromatographic separation are capacity factor (k'), selectivity (α) and column efficiency (N). These parameters s h o u l d b e provided by different means to achieve better resolution, as well as defining different problem sources.
Figure 4. Chromatogram of ASC at different concentrations and its corresponding calibration curve.
Figure 5. Chromatogram of MET at different concentrations and its corresponding calibration curve.
Figure 6. Chromatogram of PAR at different concentrations and its corresponding calibration curve.
Capacity or retention factor (k’) is a measure of how well
the sample molecule is retained by a column during an isocratic separation. The ideal value of k’ ranges from
2-10. Capacity factor can be determined by using Eqn. (4).
𝑘
′=
𝑡R−𝑡0𝑡0 (4)
where tR = retention volume at the apex of the peak (solute)
and t0 = void volume of the system or alternatively dead
time.
0.0 0.5 1.0 1.5 2.0 2.5 3.0 3.5 4.0 4.5 5.0
0 20 40 60 80 100 120 0
20 40 60 80 100 120 140
3.88
PAR
time, min
Y = 1.11145 * X + 0.4227
r = 0.9995
S y/x= 1.536
peak
area
concentration PAR, g/ml
1.5 2.0 2.5 3.0 3.5 4.0 4.5 5.0 5.5 6.0
0 20 40 60 80 100 120 140 160 180 200
0 5 10 15 20 25 30 35 40 45 50
MET 2.50
time, min
Y = 0.22558*X - 0.5418 r = 0.9979 S
y/x = 1.0334
p
e
a
k a
re
a
concentration MET, g/ml 200 220 240 260 280 300 320
0.0 0.2 0.4 0.6 0.8 1.0 1.2
abs
orbanc
e
wavelength, nm
5 ug/ml PAR 12.5 ug/ml MET 5 ug/ml ASC 5 ug/ml CAF
1.0 1.5 2.0 2.5 3.0 3.5 4.0 4.5 5.0
0 10 20 30 40 50 60 70 80 90 100 0
10 20 30 40 50 60 70 80 90 100 110 120
ASC 1.61
time, min
Y = 1.1321*X + 2.0187
r = 0.9995
Sy/x = 1.416
p
e
a
k
a
re
a
Table 1. Linearity results, Limit of Detection (LOD) and Limit of Quantification (LOQ)
Compound Range µg mL-1 slope Intercept r Sy/x LOD µg mL-1 LOQ µg mL-1
ASC 5-100 1.1321 2.0187 0.9995 1.416 3.75 12.50
MET 5-200 0.2256 -0.5418 0.9979 1.033 13.74 45.81
PAR 5-120 1.1114 0.4227 0.9995 1.539 4.14 13.82
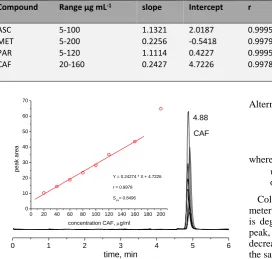
CAF 20-160 0.2427 4.7226 0.9978 0.8496 10.50 35.00
Figure 7. Chromatogram of CAF at different concentrations and its corresponding calibration curve.
Ideally, the retention factor for an analyte is between one and five. Lower values may give inadequate resolution. Higher values are usually associated with excessively brood peaks and unacceptably long run times. Increasing the retention factor is accompanied with decreasing the water content in mobile phase.
The s eparation or selectivity factor (α) is the ratio of the capacity factors of two adjacent peaks and represents the separation power of particular adsorbent to the mixture of these particular components. The selectivity factor is always greater than one and the ideal value is 2 providing species A elutes faster than species B. It can be calculated by using Eqn. (5).
𝛼 = 𝑘
′
B/𝑘
′
A(5)
Selectivity (α) value is sensitive to changes in pH, ionic strength or temperature.
Column efficiency (N) is a measure of number of theoretical plates per meter and is calculated by using eqn. (6).
𝑁 = 16× (
𝑡R𝑤b
)
2(6)
where
N = number of theoretical plates,
tR = elution volume, retention time or retention
distance (mL, sec, or cm) and
wb= width of the peak at the base line (mL, sec, or cm).
Alternative formula is given in Eqn. (7).
𝑁 = 5.54× (
𝑡𝑅𝑤1/2
)
2
(7)
where
w1/2 = width of the peak at half peak height (mL, sec,
or cm).
Columns with N ranging from 5,000 to 100,000 plates meter-1 are ideal for a good column efficiency. The column
is degraded when the peak is broaden and to make sharp peak, increase number of plates in the column either by decreasing flow rate, decreasing injection volume or diluting the sample.
Peak asymmetry or tailing factor T is a measure of column performance. At 10 % peak height, the asymmetry factor is given by Eqn. (8).
𝐴
s= 𝑏𝑎
(8)where
As = peak asymmetry factor,
b = distance from the point at peak midpoint to the trailing edge (measured at 10 % of peak height) and
a = distance from the leading edge of peak to the midpoint (measured at 10 % of peak height).
At 5% peak height, the tailing factor is given by Eqn. (9).
𝑇 =
𝑎+𝑏2×𝑎 (9)
where
T = tailing factor (measured at 5% of peak height),
b = distance from the point at peak midpoint to the trailing edge and
a = distance from the leading edge of the peak to the midpoint.
As values of 1.00-1.05 are taken as excellent, those
between 1.05-1.20 as acceptable. The As value of 2 and
above are considered unacceptable. For a well packed column, a tailing factor of 0.9 to 1.2 should be achievable.
From the chromatogram shown in figures 1 and 2, it is evident, that under the proposed chromatographic conditions, ASC, MET, PAR and CAF are completely separated, which is indicated that the method is selective and could be used for their simultaneous identification and quantification. System suitability test is an integral part of chromatographic methods and is used to verify that the resolution and reproducibility of the system are adequate for the analysis to be performed.
0 1 2 3 4 5 6
0 20 40 60 80 100 120 140 160 180 200 0
10 20 30 40 50 60 70
4.88
CAF
time, min Y = 0.24274 * X + 4.7226 r = 0.9978 Sy/x= 0.8496
p
e
a
k
are
a
Table 4. Recovery Results for ASC, MET, PAR and CAF in Synthetic Mixtures by RP-HPLC
Mixture No.
ASC MET PAR CAF
taken % taken % taken % taken %
1 2 3 4 5
60 120 60 60 60
98.56 102.70 96.46 100.94 97.08
60 60 120 60 60
101.54 96.33 97.41 99.20 103.43
60 60 60 120 60
98.62 101.04 102.56 98.31 102.73
60 60 60 60 120
101.47 95.82 99.36 102.13 97.44 Mean, %
RSD, %
99.15 99.58 100.65 99.24
2.65 2.93 2.09 2.68
The chromatographic parameters of resolution Rs,
retention factor k', selectivity α and peak asymmetry T are satisfactory for these compounds as given in table 2.
Table 2. System suitability parameters of ASC, MET, PAR and CAF.
Compound tR N k' T α Rs
ASC 1.62±0.025 3297 0.90 1.15
2.11 5.27 MET 2.47±0.058 3875 1.90 1.11
1.86 8.33 PAR 3.83±0.008 17651 3.53 1.32
0.91 6.83 CAF 4.89±0.014 19059 3.42 0.64
Flow rates between 0.5 and 1.5 mL min-1 were studied. A
flow rate of 1.0 mL min-1 gave an optimal signal to noise
ratio with a reasonable separation time. Using a reversed-phase C18 column, the retention times for ASC, MET, PAR and CAF are observed to be 2.88, 3.22, 4.29 and 4.93 min respectively. Total time of analysis was less than 6 min.
Precision and accuracy
A standard working solution containing ASC, MET, PAR and CAF, yielding final concentrations of 60 µg mL-1 for
each is prepared and is injected 5 times as a test sample. From the calibration curves of each compound, the concentrations of the ASC, MET, PAR and CAF are calculated using the detector responses. The precision of the method, expressed as the RSD % is 3.99, 4.95, 1.44 and 5.63% for ASC, MET, PAR and CAF, respectively. The accuracy, defined in terms of % deviation of the calculated concentrations from the actual concentrations, is listed in table
Analysis of synthetic mixtures
With the calibration curve of the corresponding standard component, calculate the concentration (in milligram per liter or microgram per milliliter) of the analyte in the test solution by using eqn. (10).
[Analyte] =
(𝐴−𝐼)𝑆 (10)
where
A = the peak area of the analyte in the test solution,
I = the y-intercept of the 5-point calibration curve,
s = the slope of the 5-point calibration curve.
Recovery studies in this method are performed on the synthetic mixtures prepared by adding accurately weighed amounts of the drugs Mean recoveries and RSD are found to be 101.62 and 4.28% for ASC, 101.62 and 4.28% for MET, 100.11 and 3.38% for PAR 100.86 and 2.88% for CAF, respectively.
Table 3. Precision and accuracy of the Developed Method ( n= 5).
Compound Added
µg mL-1
Found
µg mL-1
RSD %
Deviation %
ASC 60 62.28 ± 2.63 3.996 -3.80
MET 60 54.43 ± 2.49 4.953 5.95
PAR 60 57.94 ± 0.87 1.444 3.43
CAF 60 63.11 ± 3.38 5.630 -5.18
Application of pharmaceutical formulations
Assay results for the determination of PAR with MET, ASC or CAF in commercial pharmaceutical are given in tab RSD (%) indicates the accuracy of determination of active ingredients in the investigated pharmaceutical preparations.
Conclusion
References
1Erdal, D., Chem. Pharm. Bull., 2006, 54, 415-421.
https://doi.org/10.1248/cpb.54.415; Ali, N. W., Gamal, M., Abdelkawy, M., Arabian J. Chem., 2017, 10, S1868-S1874 DOI: 10.1016/j.arabjc.2013.07.015; Esteve-Romero, J., Albiol-Chiva, J., Peris-Vicente, J., Anal. Chim. Acta, 2016,
926, 1-16, DOI: 10.1016/j.aca.2016.04.026; Zor, Ş. D., Dönmez, Ö. A., Aşçı, B., Yarkadaş, G., Curr. Pharm. Anal., 2017, 13(3), 304-313,
DOI:10.2174/1573412912666160517123419.
2Snyder, L. R., Kirkland, J. J., Glajch, J. L., Practical HPLC Method Development, 2nd edition, Wiley- Interscience Publication, Hoboken. 1997, 23.
3Validation of analytical procedures: Text and Methodology International Conference on Harmonization, ICH, Q2(R1), Geneva, 2005.
4Miller, J. C., Miller, N. J., Statistics for Analytical Chemistry, Vol.
3, Ellis Horwood, Chichester, 1993, 53.