in the population sciences published by the Max Planck Institute for Demographic Research Konrad-Zuse Str. 1, D-18057 Rostock · GERMANY www.demographic-research.org
DEMOGRAPHIC RESEARCH
VOLUME 20, ARTICLE 27, PAGES 657-692
PUBLISHED 09 JUNE 2009
http://www.demographic-research.org/Volumes/Vol20/27/ DOI: 10.4054/DemRes.2009.20.27
Research Article
The one-child family:
France in the European context
Didier Breton
France Prioux
© 2009 Breton & Prioux.
This open-access work is published under the terms of the Creative Commons Attribution NonCommercial License 2.0 Germany, which permits use, reproduction & distribution in any medium for non-commercial purposes, provided the original author(s) and source are given credit.
1 Introduction 658
2 One child or none: comparative frequencies and trends across Europe
659
2.1 Statistical sources and necessary precautions 659 2.2 Are one-child families increasing faster than childlessness? 660 2.3 What about men? 664
3 A few working hypotheses 665 3.1 Age and living in a union, the most determining factors 666 3.2 Childhood socialization 666 3.3 Specific individual characteristics 667 3.4 Characteristics of partner and couple 669
4 Data and method 670 4.1 Two complementary household surveys: EHF 1999 and GGS-
ERFI 2005
670
4.2 First approach: descriptive statistics 671 4.3 Second approach: building logistic models 672
5 Results 674
5.1 Descriptive statistics 674 5.2 Multivariate analysis 678 5.2.1 EHF survey 678 5.2.2 ERFI survey 684
6 Conclusion 687
The one-child family:
France in the European context
Didier Breton1 France Prioux2
Abstract
This paper observes the change since the 1970s in the proportion of men and women having only one child during their reproductive life, and examines their socio-demographic characteristics. The aim is to explore the significant variables of the complement of the parity progression ratio to second birth (1-A1). First, we present the theories, findings, and results relating to the single-child family model in Europe. Then, we perform a multivariate analysis, with the dependent variable of the model being the fact of not having had a second child ten years after the birth of a first child in stable unions.
1
Université de Strasbourg, CRESS – démographie/ INED – France. 2
1. Introduction
When men and women are asked about their ideal family size or the number of children they would like to have, the answer is seldom one child. There are many prejudices, based on the work of psychologists, child psychiatrists, and other specialists, concerning the difficulties parents are supposed to have in successfully bringing up a child who is “deprived” of a brother or sister.3 And yet having only one child is much more frequent than generally supposed. In France, for example, this is the case for one woman in five, a proportion that has not greatly changed over time. The false impression of rarity is due to a statistical fact: since, by definition, the number of children from large families is large, we more frequently come across people from families of three children or more than those who are only children, and the latter have almost never represented more than 10% of a cohort (Toulemon 2001).
Why then, despite these prejudices, do so many couples only have one child? Although in some cases the reason may be “the vagaries of life” (late union, separation, difficulties in conceiving, etc.), comparison with the United Kingdom, where most probably the same “vagaries” occur but where the frequency of one-child families is barely half that of France, shows that the gap between the stated desire or ideal and observed reality is due, at least in part, to deliberate behavior.
In this article we attempt to determine who are the women and men who have only one child, by identifying the most significant criteria: What is the role of the biological or physiological factors related to late childbearing? What is the role of specific union histories with early union dissolution not followed by repartnering? To what extent can these men and women be said to have made a choice? Does this happen more frequently in particular socio-occupational categories? What is the role of cultural factors and the influence of family history, such as own sibship size? These questions about the socio-cultural factors that appear to favor one-child families in France are of particular relevance at a time when this family pattern is spreading across a number of Central European countries and in Southern Europe, notably Italy and Spain. The frequency of one-child families is one reason for the current low level of fertility in these countries, along with a high proportion of childlessness. Although research into the factors associated with childlessness is abundant and relatively long-established, only recently has the demographic literature featured articles devoted specifically to the characteristics of one-child families and the factors associated with the birth of a second child (see, for example, Jefferies 2001; Olah 2003; Kreyenfeld and Zabel 2005; Torr
3
and Short 2004; Prskawetz and Zagaglia 2005; Gerster et al. 2007; Parr 2007). This recent surge in interest is clearly due to the rapid increase in the proportion of one-child families in certain countries.
In the first part of the article, we present an overview of the comparative frequency of childless women and one-child mothers in Europe, using the statistical data we have collected. We then review the various hypotheses that may explain why women and men restrict their number of children to one. Part three describes our data and methodology. Finally, we discuss our findings and present our conclusions.
2. One child or none: Comparative frequencies and trends across
Europe
2.1 Statistical sources and necessary precautions
To measure the frequency of childless women and mothers of only one child, two types of statistical sources may be used:
1) Where civil records classify births by “biological” order, i.e. the order of the birth in the mother’s life, it is possible, by calculating fertility rates by birth order and mother’s age, to observe family formation by age and birth order and, at the end of childbearing life, to obtain the distribution of women by number of children through successive subtractions. Once the fertility by birth order per 100 women is calculated, the percentage of childless women is consequently the difference between 100 and first order fertility, and the percentage of single-child women is the difference between first and second order fertility.4 It was mainly these data from civil records that Frejka and Sardon (2004 and 2007) used in their work on fertility by birth order, and whose results we use extensively here, including their projections for recent cohorts. In Germany, where births are ranked by order within marriage, the Federal Institute for Population Research (BiB) carries out reconstitutions to estimate the distribution of women by parity (BiB 2004). We have used these to illustrate trends in West Germany, although we realize that these figures must be interpreted with caution.5
2) Censuses and large sample surveys that contain questions about respondents' number of children provide information for a given date, and the two proportions are
4
First order fertility is the proportion of women who have had at least one child; second order fertility is the proportion of those who have had at least two children, etc.
5
calculated directly from the distribution of women by number of live births. We have used this sort of data for Spain (1991 census), Austria (1991 and 2001 censuses), Poland (1991 census), and France (1999 EHF/census, Toulemon 2001), supplemented where necessary by estimates based on civil records for those cohorts who had not completed their reproductive lives on the census/survey date. Similar statistical data are regularly published by some countries on the basis of their population registers (Finland and Norway).
Although the census and survey data are self-reported, they are sometimes more reliable than statistics from birth registration. This is particularly so in France, where the recording of biological birth order introduced in 1989 has produced low-quality statistics that considerably over-estimate the number of first births;6 we have consequently used the estimates in Toulemon (2001), which are based on the results of the survey carried out in conjunction with the 1999 census. This inaccuracy also affects Spain, where first order births are over-estimated in civil records.7 Even if the bias caused by these classification errors is not as visible as in France, Spanish civil records do tend to under-estimate childlessness by several percentage points (approximately 4 points, if the bias is the same now as in 1975-1990), and to over-estimate even more the percentage of single-child women (7 to 8 points) (Prioux 1997). For that reason we have not used these birth order statistics for Spain or for other countries (such as Bulgaria, Portugal, and Slovenia) where civil records clearly under-estimate childlessness, and hence probably largely over-estimate the number of one-child families.
2.2 Are one-child families increasing faster than childlessness?
Figure 1 presents the data we have collected for cohorts 1930 to 1970. The most striking feature is the diversity between countries in the frequency of one-child families, unlike a relative homogeneity in childlessness, at least until around the 1945 cohort.
6
For example, in 2006 first order births were reported as 57.5% of total births, a proportion that is totally inconsistent with the level of fertility in France. In Norway, which had a total fertility rate of 1.9 children per woman in 2006, first births were only 42.2% of the total.
7
This contrast between the two sets of values is particularly clear in Western Europe, and in Eastern Europe, where it continued until the 1960s cohorts. Although the rise in childlessness is a fairly general trend among recent cohorts in Europe, this is less true for one-child families, which in some countries are becoming less frequent.
Figure 1: (Continued)
In Western Europe, the decline in childlessness in the 1930-1945 cohorts is followed by a fairly pronounced rise, except in France, where it is much smaller and restricted to the 1960s cohorts. France consequently stands apart from other countries in the region: in Austria, the Netherlands, and England & Wales, 18%-20% of women now have no children, and in West Germany the figure appears to exceed 25%.8 Yet very different levels and trends in the proportion of single-child women accompany these similar trends in childlessness in the four countries. In the 1940 cohort, for example, the percentage of women who had one child is very low in the Netherlands (10%) and England & Wales (14%), but much higher in Austria (22%) and West Germany (24%), countries where there seems to be a longer tradition of one-child families. Subsequently, the rise in childlessness is associated with a rise or leveling off of one-child families in Austria and the Netherlands, while in Germany and England & Wales the percentage of mothers of only one child is falling. Women born in England & Wales in 1965 present both a high level of childlessness (20%) and the lowest proportion of mothers of only one child (12%-13%), evidence of a certain polarization in fertility (Ekert-Jaffé et al. 2002): although more women are choosing not to have children, almost all of those who do become mothers have two or more (Jefferies 2001). The situation is almost the opposite in France, where it appears that few women choose not to have children at all (Toulemon 1996), but where more women have only one: the proportion of one-child mothers ranges between 18% and 20%.
Among the countries of Northern Europe, Denmark is most similar to France, and Finland is more comparable to England & Wales and Germany, although the trends are less clear cut. Sweden and in particular Norway possess the specific feature of low childlessness (12%-13% for the 1965 cohort) and a moderate level of one-child mothers (14%-15%), although both indicators have risen slightly in Norway; in Sweden they have remained stable for many years.
In Italy and Spain, it is the increase in very small families that has caused the decline of completed fertility, rather than childlessness, which more recently, has risen less sharply. Once hardly seen in Spain, one-child families have increased rapidly from cohort to cohort. Slightly more frequent in Italy, where they have long been common in the north of the country (Terra Abrami and Sorvillo 1993), the frequency of one-child families has increased considerably, with the current proportion of one-child mothers probably exceeding 25%. The one-child pattern is spreading much more slowly in Greece, where childlessness appears to have rapidly increased in recent years.
In Eastern Europe, almost all women used to have children. But although the birth of a first child was almost automatic, this was not so for the second, except in Slovakia. The choice of a single child seems to have been particularly prevalent in Hungary,
8
where more than one woman in four born in 1935-1940 had only one child.9 Similarly, the Czech Republic is clearly distinguished from Slovakia by a higher frequency of only children, although this frequency initially declined, as in Hungary, until around the 1950 cohort. As in Italy and Spain, the decline in family size after the 1955 cohort first took the form of a rapid spread in one-child families (Avdeev 2003), before childlessness increased in the 1960s cohorts.10
So where childlessness is low, only children may be fairly common, as if, when social pressure to have children is strong, women stopped procreating once they had done their “duty”, or after having experienced motherhood. This was probably true for women born in Central Europe (Austria, Germany, and Hungary) in 1930-1940, and was true up to the 1960s cohorts in most of the former Soviet-bloc countries, Italy, and Spain. On the other hand, where social pressure to have children is less strong, some women may choose to have none, and the increase in childlessness may be accompanied by a falling proportion of mothers of only one child. This is currently the case in Germany, Finland and, above all, England & Wales, where only children have become rather rare. In these countries, one-child mothers probably share common characteristics with childless women.
But there is a great variety of situations across Europe and an only child is certainly not always an alternative to childlessness; if the one-child family is the result of a desire to restrict family size to give offspring greater chances of success, then the characteristics of one-child mothers will differ from those of childless women and are likely to be closer to those of two-child mothers.
2.3 What about men?
First, we observe that little is known about fertility levels among men, since almost all fertility measurements concern women. It is therefore hardly surprising that the distribution of men by number of children is rarely known.
In the three countries for which we have found statistics, Finland, France, and Norway, it is slightly less common for a man than a woman to have only one child (Table 1). Conversely, in those three countries, childlessness is more common among
9
For Hungary, the Czech Republic, and Poland, census data corroborate this contrast between the two indices, which validates the data by birth order from the vital records. However, the parity statistics in Romania and Russia may be slightly biased. In that case, the percentage of one-child families is probably over-estimated, but the increase is indisputable.
10
men and the gap with women has increased in recent cohorts, especially in Finland; this is evidence of a greater “specialization” in male fertility, between men who have children — on average more children than for mothers — and those who do not. These differences suggest that the factors favoring one-child families are not necessarily the same for men as for women.
Table 1: Comparative percentages of men and women having had no children and men and women having had only one child in Finland and France
Finland France Norway
No children
Only one
child No children Only one
child No children Only one
child Birth
Cohort
* Men Women Men Women Men Women Men Women Men Women Men Women
1930-1934 14.3 11.0 15.9 17.4
1935-1939 17.2 14.2 16.6 16.8 12.7 9.8 16.3 17.5 9.6 10.4
1940-1944 16.9 13.9 18.7 19.6 11.4 9.9 18.3 17.7 13.6 9.5 9.8 10.1
1945-1949 17.0 14.3 17.0 21.2 12.3 9.2 18.0 20.0 13.3 9.0 11.5 11.8
1950-1954 21.7 15.5 16.8 19.5 13.5 10.2 17.6 19.6 14.4 9.4 12.3 13.3
1955-1959 24.5 16.5 15.2 17.3 16.6 11.2 13.2 14.4
Note: * Norway: birth cohorts 1935, 1940, 1945, 1950, 1955
Sources: Tilastokeskus/ Statistics Finland 2007, Toulemon 2005 (France), Statistics Norway 2008
Following, in this article we will examine the characteristics of one-child families in France, looking at both men and women.
3. A few working hypotheses
3.1 Age and living in a union, the most determining factors
First, we sought to distinguish the factors that involuntarily lead men or women to have only one child, from those that appear to be the result of a choice; the first category would include factors related to age and status of the couple. A late first birth, particularly for a woman over 35, considerably reduces the possibility of having a second child. The same is true when the union in which the first child was born has been dissolved or when the first child was born outside a union, if (re)partnering does not occur or only after a long interval. In practice, age and living in a union are the most determining factors, as we shall see below (see 5.1).
However, it is hard to claim that all late first births and all union dissolutions are involuntary; it would be a mistake to suppose that these behaviors are totally independent of the attitudes of the people concerned towards the family and children. Consequently, we decided not to consider these factors as being a “non-choice” of only one child.
But since these two factors are preponderant and strongly determine the likelihood of having only one child, we attempted to circumvent the problem by also analyzing those men and women who had their first child at a sufficiently early age and within a stable union that did not reduce the chances of a second birth (see below 4.3 and 5.2).
The other factors likely to influence the frequency of only children may be listed under three headings: childhood experience, personal characteristics of the adult, and those of his/her partner and of his/her union.
3.2 Childhood socialization
We hypothesize that, as for fertility in general, childhood socialization and experience (number of siblings, religious affiliation, nationality, region of residence, social background, parental separation) influence the likelihood of having only one child:
• In France, it is known that the level of fertility of men and women is closely linked to the number of their siblings (Desplanques 1987), and the likelihood of having a third child is higher among persons who have many brothers and sisters (Breton and Prioux 2005). We tested whether the fact of being an only child predisposes people to have only one child.
• We also hypothesize that the people from the French regions where fertility has traditionally been highest (northern and western France) are less likely to have only one child than people from the southwest, a less fertile region.
• In France, the self-employed and men in intermediate occupations have more often restricted their number of children to one, which is less often the case with farmers, manual workers, and persons in higher-level occupations (Desplanques 1987 and 1994). We tested whether this tendency to limit family size has been transmitted to their children, even if they are not themselves only children.
• Since most religions support family values, the fact of having had a religious education and of attending religious services, if only occasionally, is likely to be associated with a lower frequency of only children.
• We tested whether the fact of not having spent one’s entire childhood with both parents predisposes to having only one child. One may suppose that the children of separated couples are perhaps less attached to family values, or more reluctant to have more than one child, anticipating that the union may not last.
3.3 Specific individual characteristics
Apart from age, mentioned above (see 3.1), we examined the influence of educational qualifications, occupation, and opinions expressed by men and women about aspects of family life.
effect of higher qualifications on the likelihood of a rapid second birth—which is also observed for unqualified women—but there are no conclusions as to the final frequency. Regarding the likelihood of having only one child, one nonetheless expects to find a non-linear effect of qualifications in France, just as for transition from two to three children (Breton and Prioux 2005): a negative effect for the most highly qualified women and those without qualifications, and a positive effect for women with an intermediate level of qualification who are more inclined to limit family size.
• The effect of men’s educational level on having a second child has less often been directly studied. Although in Norway, just as for women, a high educational level appears to result in the rapid birth of a second child among men (Kravdal 2007); in Sweden and Hungary, men’s qualifications do not have a significant influence (Olah 2003). It is the same as for the husbands or companions of the women observed that the effect of men’s educational qualifications is usually analyzed, and generally a positive effect is found, as, for example, in Denmark (Gerster et al. 2007), France (Köppen 2006), and Germany (Kreyenfeld and Zabel 2005); in Germany and Austria it even appears that the husband’s educational qualifications are more important than the wife’s (Kreyenfeld 2002; Köppen 2006; Prskawetz and Zagaglia 2005). In the United Kingdom, however, there is no significant effect (Kreyenfeld and Zabel 2005). Regarding French men’s likelihood of having only one child, we make the same hypothesis as for women, and postulate a non-linear relationship with educational level.
in an intermediate occupation still predispose a man to have only one child more often than being a farmer, manual worker or in a higher-level occupation?
• Attitudes and opinions about marriage or the respective roles of men and women in working and family life can also reveal a greater or lesser predisposition to restrict family size. We hypothesize that people stating the most traditional opinions are less inclined to restrict their family size to one child.
3.4 Characteristics of partner and couple
As far as possible, we also consider the personal characteristics of the partner (occupation, child[ren] from a previous union), and those of the couple (age difference, length of union, and marital status at first birth).
• Where we are unable to take into consideration the partner’s educational level, which, as we have seen, may in some cases have a determining influence, we consider socio-occupational category, making the same hypotheses as above, adapted to the gender of the partner.
• We assume that when a man or a woman has had a first child with a partner who already had one or more children from a previous relationship, they are more likely to only have one child. We also postulate that this link will be stronger for men—who are more likely to live with stepchildren—than for women.
• The age difference between the partners may reveal different degrees of egalitarianism in attitudes towards couple relations (Bozon 1991). Research has shown that the division between partners of domestic and parental tasks has an influence on the likelihood of having a second child. In Hungary and Sweden, an overly in-egalitarian division of tasks does not favor a second birth in the case of women (Olah 2003). On the other hand, in the United States, among couples where both partners work, it is those whose division of tasks is intermediate between “traditional” (women doing at least 85%) and “modern” (less than 54%) who are least likely to have a second child (Torr and Short 2004). In the absence of adequate data on the domestic arrangements of the couples under study11, we use the age difference between partners to characterize the degree of equality in their relationship, and hypothesize that the most in-egalitarian couples (where the
11
man is at least two years older than his wife), and therefore the most traditional, less frequently have only one child.
• The status of the couple at the time of the first birth is also likely to correlate with the likelihood of having a second child. We hypothesize that the fact of having a first child fairly soon after entry into union, and/or the fact of being married at the time of that birth, demonstrate a stronger attachment to family values and consequently a lesser predisposition to have only one child.
4. Data and method
4.1 Two complementary household surveys: EHF 1999 and GGS- ERFI 2005
The results presented are based on two French surveys of differing size and nature. The first is the 1999 family survey (EHF12), a life-event history survey conducted in association with the census and involving nearly 400,000 men and women. This self-administered survey does not contain a large number of variables, but the size of the sample gives it considerable authority for the study of family dynamics in France. Historically, these family surveys have been used for studies of fertility by birth order (Desplanques 2005). The second survey used is more recent and was the first wave of the French survey in the European GGS project, known as ERFI13, carried out at the end of 2005. Its size was more standard (approximately 10,000 men and women) and it was carried out face-to-face. The EHF survey, by its sample size and design, is representative at the regional level, whereas the ERFI survey is only representative of the households living in Metropolitan France at the end of 2005. We used the samples weighting coefficients14 that partly correct the under representation of particular categories such as the youngest, the least educated, the foreign-born and the unmarried. The two sources complement each other:
• EHF can be used to test most of the hypotheses concerning the characteristics of individuals and couples;
• ERFI can be used to test further hypotheses relating to the individual: family history, attitude to religion, opinions on male-female relations or the work-life
12
Etude de l’Histoire Familiale, Family History Study 13
ERFI: Etude sur les Relations Familiales et Intergénérationnelles, French version of GGS: Generations and Gender Survey.
14
balance; and other hypotheses relating to the couple: union order and age difference between partners in particular.
This study does not cover the whole of these samples but only those men and women who had a first child between 1970 and 1988 from EHF (n = 107,579) and 1980 and 1995 from ERFI (n = 2,023).
4.2 First approach: descriptive statistics
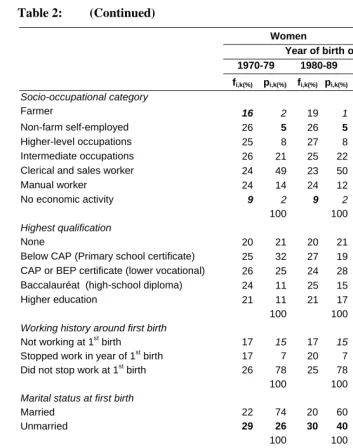
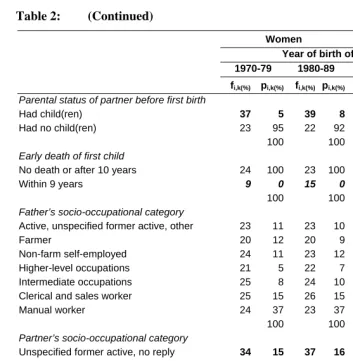
First we used descriptive statistics to answer the preliminary question in our research: who are the women and men in France who correspond to the one-child model? To that end we measured two indicators within two different “k” subpopulations (Table 2):
• Proportion of people who did not have a second child within ten years of the birth of the first, “fi,k” 15
• The weight of category “k”16 in the population of people having only one child ten years after the birth of the first, denoted “pi,k”
•
f
u
f
N
f
u
f
N
p
i k i k i i k i k i k i , , , , , . . .Prevalence= =
.
= where• ui,k: proportion of category “k” in the total population
• fi,k: proportion of the one-child model among individuals belonging to category
“k”
• fi: proportion of the one-child model in the total population • N: total population size
The subpopulations, whose risk of having only one child (fi,k) is far from the average risk, are “automatically” associated with rare profiles. The frequency of the one-child model may be very high for a given category “k” but only represent a very small number of people with only one child. The reason is that in the general population, the parents with only one child most often encountered are those whose pi,k value is high, and not necessarily those belonging to a population in which one child
15
The ten-year period was chosen for an objective reason: fewer than 3% of second order births following a first birth registered between 1970 and 1985 occurred after more than ten years This proportion is even below 2.5% for women who had a first child within a union before age 35 and whose union lasted at least ten years after the first birth (population in a position to have a second child).
16
only is frequent (fi,k). The two indicators in the table do indeed measure two different things: fi,k is a measurement close to a risk and pi,k is close to a prevalence.
4.3 Second approach: building logistic models
In order to refine our answer to the question of who are the women and men who choose or decide to have only one child, we then built a number of logistic models on the subpopulation of men and women who had had their first child:
• early enough not to come up against physiological barriers, and
• within a union that lasted at least ten years after the first order birth.17
The purpose of the models was to test the various hypotheses made above (see 3.), based largely on a review of the European literature. The dependent variable is an indicator of not having (Y=1) or having (Y=0) a second child within ten years of a first birth. The methodology used for constructing these models was forward selection, setting a significance level for the variables in the model (Instruction SAS: Selection=Forward sle=0.0518 for EHF and sle=0.15 for ERFI). This procedure classifies variables from most to least significant to explain the probability of stopping after a first child.
We chose to build logistic models rather than duration models because we were only interested here in the characteristics of those people who do not have a second child, and not those characteristics that favor the earlier or later timing of a second child.19
Almost all the explanatory variables in the models tested were described in the preceding section, except for the order of the respondent’s union in which the first child was born.
17
Here the numbers are smaller. The regression applies to 33,349 men and 50,561 women from EHF 1999 and 574 men and 834 women from ERFI 2005. This reduction in numbers is mainly due to specific union histories. In fact, less than 3% of women have had their children later than 35 and just over 20% had separated before the first child was ten years old or were not in a union at the time of the first birth. 18
Sle=0.05 means that only those variables with a first-stage probability of 5% are selected. This probability is not to be confused with those given in Tables 3 and 4, which correspond to variable modalities.
19
Composite variables were also specifically constructed both to improve the quality of interpretation and to combine variables of attitudes, religious values, and practice on the basis of answers given in ERFI.
• A variable combining highest qualification obtained and age at first birth. Very few births occur in France during the mother’s education and consequently age at first birth largely depends on educational level. In order to allow for this correlation, we constructed a variable using three levels of qualification: none or lower than CAP (vocational certificate); CAP to baccalauréat (school-leaving certificate); and higher than baccalauréat. In each group we distinguished between those who had their first child before that group’s median age and those who did so after that age.20
• A variable concerning religious affiliation and practice, which distinguishes between three categories: practicing, even occasionally (attending a religious service at least once a year other than ceremonies such as weddings, funerals and baptisms), non-practicing, and those who state no past or present religious affiliation.
• A variable reflecting a traditional attitude towards the family and conjugal relations. Respondents are classified as “traditional” if they agree with at least one of the following statements: “In a couple, it is better for the man to be older than the woman”; “If parents divorce, it is better for the child to stay with the mother than the father”; “Marriage is a life-time relationship and should never be ended”.
• A variable reflecting opinion on mothers’ labor force participation. Respondents are classified as less favorable to women’s paid work if they agree with at least one of the following statements: “A pre-school child is likely to suffer if his/her mother works”; “Looking after the home or family is just as fulfilling as working for pay”; “When employment is scarce, men should have priority over women in getting a job”.
In each case, we compared male and female models. Unfortunately none of the models test all the explanatory variables: some variables in ERFI are not available in EHF 1999, such as age gap between partners, variables of opinion and values, and religious practice.
20
5. Results
5.1 Descriptive statistics
The descriptive statistics confirm that the two subpopulations that most often have only one child are those who are oldest when the first child is born and those who at the birth of their first child were not living as a couple, or whose union was dissolved in the ten years following the birth (Table 2). The age effect is stronger for women than for men: a man who is relatively old when his first child is born may not be affected by the age factor if his partner is sufficiently young. Of the various situations and histories of couples, the frequency of a single child is highly correlated with the length of time they live together after the first birth.
In addition to the effects of age and union history, other criteria are associated with a high frequency of the one-child model: nationality21 (particularly non-EU European), having been an only child, having one’s first child with a partner who already had at least one child, and not being married at the time of the first birth. Conversely, only children are relatively rare among persons with an African nationality, persons with a large number of siblings, women who were not economically active at the time of the first birth and even more so those who had never worked, and men and women whose first child died prematurely. Region of residence is also an important factor: the one-child model is most frequent in southwest and southeast France, and least frequent in western France. The effect of qualifications is shown in an inverted U-curve, with a single child being less frequent among the unqualified and highly qualified than among those with intermediate qualifications. Finally, with respect to social background and occupation at the time of the survey, farmers still have the lowest proportion of one-child families, including those among the one-children of farmers, whereas for a woman, having a higher-level occupation or being self-employed in the non-farm sector more often correlates with a single child.
The contrast between men and women, other than in age, is quite small, except for the group of women in higher-level intellectual professions, who are much more likely to have only one child than men in that category. The fairly high proportion, also of mothers of only one child, among those who did not stop working at the time of the first birth, confirms the problem of the compatibility between a larger family and a working career, and/or the correlation between employment trajectory and the desire to have another child.
21
Table 2: Proportion of men and women who still have only one child ten years after the first birth (fi,k) and proportion of each of the subpopulations
among parents of a single child (pi,k). Men and women, 1970-1989
Women Men Year of birth of first child
1970-1979 1980-1989 1970-1979 1980-1989
fi,k(%) pi,k(%) fi,k(%) pi,k(%) fi,k(%) pi,k(%) fi,k(%) pi,k(%)
Age at first birth
Under 20 16 9 15 5 19 2 22 2
20-24 19 41 16 30 17 29 17 20
25-29 27 32 24 36 22 40 18 38
30-34 44 12 42 19 32 18 29 25
35-39 60 4 67 8 42 7 43 10
40 and above 86 2 87 2 53 4 52 5
100 100 100 100
Union status and history after first birth
No union at time of first birth 51 7 55 7 30 3 41 3
Stable union for 10 years 20 68 18 58 21 76 18 66 Union breakdown and no repartnering 41 12 43 18 39 8 45 15
Union breakdown and repartnering 28 5 25 7 29 5 29 7
Other 25 8 29 10 26 8 28 9
100 100 100 100
Nationality at birth
France 24 91 24 91 23 92 23 90
EU country 22 5 22 5 18 5 22 5
Other European country 28 1 35 1 35 1 26 1
North Africa 8 1 11 1 7 1 11 2
Other African country 14 1 12 1 6 0 12 1
Other 18 1 15 1 16 1 15 1
100 100 100 100
Sex of first child
Boy 24 52 23 51 23 52 22 50
Girl 23 48 24 49 22 48 22 50
100 100 100 100
Own sibship size
Only child 32 12 30 10 29 12 27 10
2 or 3 children 26 40 25 43 25 43 24 44
4 or 5 children 22 26 22 26 21 25 21 26
6 and more children 19 22 19 21 17 20 18 20
Table 2: (Continued)
Women Men Year of birth of first child
1970-79 1980-89 1970-79 1980-89
fi,k(%) pi,k(%) fi,k(%) pi,k(%) fi,k(%) pi,k(%) fi,k(%) pi,k(%)
Socio-occupational category
Farmer 16 2 19 1 16 3 18 3
Non-farm self-employed 26 5 26 5 25 12 22 10 Higher-level occupations 25 8 27 8 21 16 19 14 Intermediate occupations 26 21 25 22 24 24 24 24 Clerical and sales worker 24 49 23 50 24 12 24 12
Manual worker 24 14 24 12 22 33 22 37
No economic activity 9 2 9 2 18 0 19 0
100 100 100 100
Highest qualification
None 20 21 20 21 19 19 20 20
Below CAP (Primary school certificate) 25 32 27 19 25 23 27 18 CAP or BEP certificate (lower vocational) 26 25 24 28 23 33 23 36 Baccalauréat (high-school diploma) 24 11 25 15 26 11 22 11
Higher education 21 11 21 17 19 14 18 15
100 100 100 100
Working history around first birth
Not working at 1st birth 17 15 17 15 16 3 20 3
Stopped work in year of 1st birth 17 7 20 7 39 0 25 0 Did not stop work at 1st birth 26 78 25 78 23 97 22 97
100 100 100 100
Marital status at first birth
Married 22 74 20 60 22 77 20 64
Unmarried 29 26 30 40 26 23 27 36
100 100 100 100
Region of residence *
Ile de France 26 21 25 20 25 21 22 18 Center –North 22 17 21 17 21 18 22 18 Nord–Pas de Calais 21 6 21 6 18 6 20 6 East – Northeast 25 10 25 10 24 9 23 10
West 15 9 16 9 16 10 16 9
Southwest 27 12 27 12 25 11 28 13
Rhône Alpes, Auvergne 23 11 24 12 23 12 21 12
Southeast 28 14 27 14 27 13 26 14
Table 2: (Continued)
Women Men Year of birth of first child
1970-79 1980-89 1970-79 1980-89
fi,k(%) pi,k(%) fi,k(%) pi,k(%) fi,k(%) pi,k(%) fi,k(%) pi,k(%)
Parental status of partner before first birth
Had child(ren) 37 5 39 8 39 5 46 9
Had no child(ren) 23 95 22 92 22 95 21 91
100 100 100 100
Early death of first child
No death or after 10 years 24 100 23 100 23 100 22 100
Within 9 years 9 0 15 0 8 0 5 0
100 100 100 100
Father’s socio-occupational category
Active, unspecified former active, other 23 11 23 10 22 12 24 12
Farmer 20 12 20 9 17 12 18 9
Non-farm self-employed 24 11 23 12 25 12 21 11
Higher-level occupations 21 5 22 7 21 6 19 7
Intermediate occupations 25 8 24 10 24 8 22 9 Clerical and sales worker 25 15 26 15 24 15 25 17
Manual worker 24 37 23 37 23 35 23 36
100 100 100 100
Partner’s socio-occupational category
Unspecified former active, no reply 34 15 37 16 20 16 23 17
Farmer 15 2 16 2 15 1 16 1
Non-farm self-employed 23 10 26 10 29 5 28 4
Higher-level occupations 21 11 20 10 25 4 20 4
Intermediate occupations 25 20 23 18 23 18 20 17 Clerical and sales worker 24 15 23 16 23 44 22 46
Manual worker 20 27 20 28 21 12 21 11
100 100 100 100
Total 23 23 22 22
Population of reference: Women and men who had their first child between 1970 and 1989 Source : EHF 1999 survey
Interpretation : fi,k – 37% of women who had their first child between 1970 and 1989 whose partner had already had at least one
child stop at one child, compared with 39% of men. pi,k – On the other hand, of the women who did not have a second child
within ten years of the first, only 5 were women whose partner had already had at least one child.
Notes: Given in bold are the fi,k proportions furthest from the average frequency (in italics the lowest values). This is not a level of
The descriptive statistics show that the characteristics of one-child parents are close to those traditionally associated with low fertility, supporting the importance of this type of study in the European context of a generalized low-fertility model and a developing one-child model. They also show that the percentage of one-child fathers and mothers has not increased in France, despite an increase in the factors correlated with the more frequent one-child model (columns pi,t in Table 2): first births after the age of 30, union breakdown, couples unmarried at the time of the first birth, or where one partner already has a child from a previous union.
5.2 Multivariate analysis
Interpretation of the descriptive statistics is difficult because of links between variables, particularly with union breakdown and age, which are determining factors for the likelihood of having a second child. Take the example of men and women who were unmarried at the time of the birth of their first child. The proportion of those who remain one-child parents is particularly large, but this may be because of a higher frequency of separations. Multivariate analysis is used to test if the effect of marriage is always significant, all other things being equal and after controlling for separation.
In the logistic models presented here, some variables from Table 2 are not given; either because they were not significant in any of the models (such as the sex of the first child)22, or because they apparently do not depend on structural effects (early death of first child). Nor did we introduce working career, which is collinear with the occupational category: all the women who have never worked belong to the socio-occupational category “inactive”.
5.2.1 EHF survey
The risk of stopping at one child is declining in stable couples
Contrary to the empirical observation in Table 2, analysis "all other things being equal" reveals a significant cohort effect; the likelihood of having only one child fell from the 1970s to 1980s (odds Ratio=0.7), considering stable couples only. This confirms that the stability of the overall proportion is due to a compensation effect between the
22
increase in structural factors favoring a single child and the lower percentage of only children in particular subcategories (stable couples, first birth before 35).
Effect of postponing first child after completing education
In earlier models, the effects of age and educational qualifications were consistent with those in Table 2: an increasing relation between age at first birth and the risk of not having a second child, and an inverse U-shaped relation between education and that same risk. The final logistic model (Table 3) contains the variable combining age at first birth and the highest qualification obtained. For the least qualified and those with intermediate qualifications, the likelihood of having only one child is higher for those individuals who had their first child relatively late (OR∈[1.5; 1.7]). They are probably those who, by choice or otherwise, take more time in forming a stable couple or obtaining a stable first job. If it were a choice, these people would be the least “family” oriented because of their level of education or the values they hold.
For the most qualified women and men, relatively high age at first birth is not significantly linked to a high likelihood of having only one child. Conversely, having a first child while relatively young does indeed reduce the likelihood of having only one child compared with the least qualified (OR∈[0.7; 0.8]). In France therefore, among men and women, educational qualifications have the same positive effect on the birth of a second child as in most European countries (see 3.3).
Socio-occupational category: differences between the sexes
The effect of socio-occupational category and social background is measured along three dimensions: the respondent’s socio-occupational category, that of their partner (most recent or current)23, and that of their father. The three dimensions are connected by social reproduction between generations and the social endogamy of couples. Using all three reduces the effects of each variable and can be used to identify the most significant effects, particularly differences between the sexes.
The hypothesis of social reproduction of behavior is not confirmed, except for the daughters of men in higher-level occupations, who are less likely to have only one child than all the other categories (OR=0.6, versus 0.8 or 0.9). Conversely, the children of manual workers (the reference for father’s occupation) are most likely to have only one child; the same is true for men and women who are manual workers and for women
23
whose partner is a manual worker. The high fertility of manual workers in France is apparently supported, therefore, by the fertility of foreign-born manual workers, because among manual workers of French nationality (reference), the likelihood of having only one child is high, probably because an only child has greater chances of upward social mobility.
The model confirms that the situations associated with the lowest likelihood of having only one child are those of couples where the woman has always been economically inactive (OR=0.6 or 0.7), or the man is a farmer or in a higher-level occupation (OR=0.7 or 0.8). Conversely, men whose partner is self-employed in the non-farm sector have the highest likelihood of having only one child (OR=1.4). These differences between the sexes show that in France, as in other European countries, “career” and “family” are not necessarily compatible for certain occupational categories.
Geographical origin and regional features
The effect of nationality is significant and particularly high in groups from Africa, especially men from North Africa (OR=0.2). Women and men of non-EU European nationality, unlike what is observed in Table 2, are not more likely to adopt the one-child model than the French. However, in the countries concerned, this model is traditionally quite frequent (Figure 1). EU Europeans, under the conditions of the model, would appear to adopt the one-child model less often. The effect is slight (OR= 0.8 or 0.9).
The model confirms the effect of the French region of residence24. After controlling for structural effects, residents in western France stand out for their low adoption of the one-child model (OR=0.5 or 0.6), and it is in southwest France that the likelihood of having only one child is highest (OR=1.1 or 1.2).
24
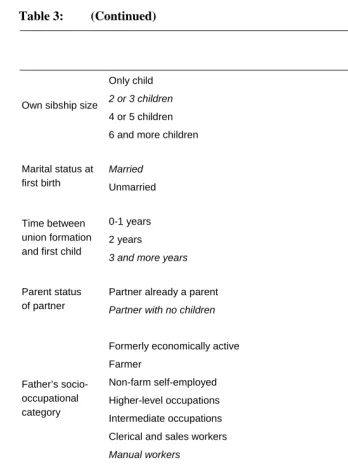
Table 3: Probability of stopping at one child, semi-log model
Men and women who had their first child between 1970 and 1989 before the age of 35 (women) / 40 (men) within a union that lasted at least 10 years after that first birth
Women Men
OR p OR p
1970-1979 ref ref
Year of birth of
first child 1980-1989 0.7 *** 0.7 ***
No or few qualifications and first child relatively early 0.9 * 1.0 -
No or few qualifications and first child relatively late 1.7 *** 1.5 ***
Intermediate qualifications and first child relatively early ref ref
Intermediate qualifications and first child relatively late 1.6 *** 1.7 ***
Higher qualifications and first child relatively early 0.7 *** 0.8 *** Education
and age
Higher qualifications and first child relatively late 0.9 - 1.1 -
French ref ref
EU national 0.9 *** 0.8 ***
Other European 1.3 * 1.2 -
North African 0.2 *** 0.2 ***
Other African 0.3 *** 0.2 ***
Nationality
Other 0.6 *** 0.5 ***
Ile de France ref ref
North-Center 0.9 *** 0.9 **
Nord-Pas de Calais 0.9 * 0.9 *
East–Northeast 1.1 ** 1.1 -
West 0.5 *** 0.6 ***
Southwest 1.2 *** 1.1 **
Rhône-Alpes 0.9 *** 0.9 *
Region of residence
Table 3: (Continued)
Women Men
OR p OR P
Only child 1.4 *** 1.2 ***
2 or 3 children ref ref
4 or 5 children 0.8 *** 0.8 ***
Own sibship size
6 and more children 0.8 *** 0.7 ***
Married ref ref
Marital status at
first birth Unmarried 1.3 *** 1.3 ***
0-1 years 0.5 *** 0.5 ***
2 years 0.5 *** 0.6 ***
Time between union formation and first child
3 and more years ref ref
Partner already a parent 2.3 *** 3.3 *** Parent status
of partner Partner with no children ref ref
Formerly economically active 0.8 *** 0.9 **
Farmer 0.8 *** 0.8 ***
Non-farm self-employed 0.8 *** 1.0 -
Higher-level occupations 0.6 *** 0.8 ***
Intermediate occupations 0.8 *** 0.9 *
Clerical and sales workers 0.9 ** 1.0 - Father’s
socio-occupational category
Manual workers ref ref
Farmer 0.9 - 0.8 **
Non-farm self-employed 1.1 ** 0.9 *
Higher-level occupations 1.1 ** 0.8 ***
Intermediate occupations 1.1 *** 0.9 **
Clerical and sales workers ref 0.9 **
Manual workers 1.2 *** ref
Respondent’s own socio-occupational category
Table 3: (Continued)
Women Men
OR p OR P
Unknown 1.1 * 0.9 **
Farmer 0.7 *** 0.8 -
Non-farm self-employed 1.0 - 1.4 ***
Higher-level occupations 0.7 *** 1 -
Intermediate occupations 1.0 - 0.9 ***
Clerical and sales workers 1.0 - ref
Manual workers ref 1.0 -
Current or last partner’s socio-occupational category
At home, students, etc. 0.9 - 0.7 ***
Population of reference: women under 35 and men under 40 at the time of first birth, whose unions lasted at least ten years after first birth: 50,561 women and 33,388 men.
Source: EHF 1999 survey
Notes: Significance levels, ***: p < 0.01; **: p between 0.01 and 0.05; *: p between 0.05 and 0.1.
Female model: -2 Log L = 44,516 / concordant pairs = 69 Male model: -2 Log L = 30,257 / concordant pairs = 69
Ranking of variables by explanatory value:
Male model: Interval between union formation and first child / parent status of partner / age education / nationality / region of residence / year of birth of first child / sibship size / partner’s socio-occupational category / marital status at time of birth / father’s socio-occupational category / respondent’s social group
Female model: Age education / interval between couple formation and first child / region of residence / nationality / parent status of partner / year of birth of first child / sibship size / partner’s socio-occupational category / father’s socio-occupational category / marital status at time of birth
Reproduction of the one-child model
The reproduction of the one-child model is significant among men and women, but the relation is higher in the female model (OR=1.2 or 1.4). Conversely, the larger one’s own sibship size, the lower the probability of having only one child (OR=0.7 or 0.8). In the long term, the increase in the number of one-child families may well contribute to the diffusion of this model. This may be seen as an illustration of the low fertility trap (Lutz, Skirbekk, and Testa 2005).
Couples family-oriented from the outset
which is associated with the highest risk of having only one child. The effect is stronger where it is the respondent’s female partner who has already had a child (OR=3.3 compared with 2.3 in the female model), which confirms our hypothesis (see 3.4).
Couples unmarried at the time of the first birth more often adopt the one-child model (OR=1.3). This difference persists among stable couples, perhaps because they are less “conservative” individuals or less family-oriented. Couples who had their first child early are extremely unlikely to have only one (OR=0.5 or 0.6). These are probably couples more oriented towards family values, for whom having more than one child is the natural thing to do. However, a longer delay may also be the consequence of difficulties in conceiving or a feeling of economic insecurity, which predisposes people to not have more children. These dimensions cannot, unfortunately, be controlled for with the EHF data.
5.2.2 ERFI survey
The ERFI survey can be used to test the effect of further variables relating to the couple (such as the age gap between partners or the union order) and socialization during childhood (whether spent with both parents), but above all to account for indicators of values and opinions: attitude to religion, views on male-female relations, and female employment. The “region” variable is not included in this model because of the non-representative nature of the survey at the regional level. The small sample sizes25, particularly among men, explain why so few variables are used in the models presented in Table 4. It is also because of too few respondents in certain categories that the model focuses solely on French nationals and those whose partner had no child from a previous union. The most significant variables are not identical for both sexes and are more numerous among women.
The positive effect of higher age at first birth for those with lowest and intermediate qualifications is confirmed, particularly for women, and, as before, the effect of higher age does not exist among the most highly qualified. The model particularly reveals the specific nature of women in higher-level occupations, who are extremely likely to have only one child (OR=3.9).
With respect to the characteristics of the couple, the age gap is only significant in the female model, and contradicts what was expected: women whose partner is
25
younger, more often have only one child. This result does not confirm the hypothesis concerning the positive effect of egalitarian gender relations on the birth of a second child (Olah 2003). The union order is significant in both models but with a different sign for men and women: having had a previous union before the first birth reduces women’s likelihood of stopping at one child, and increases men’s. One explanation may be the inverse relation between fertility and the breakdown of the previous union: for women, the breakdown of an infertile union to start a family with a new partner; for men, an infertile first union demonstrating, on the contrary, a less positive attitude to family values. These hypotheses obviously need to be tested in further research.
Table 4: Probability of stopping at one child – semi-log model
Men and women of French nationality who had their first child between 1980 and 1995 before age 35 (women) in a union that lasted at least ten years after the first birth.
Women Men
OR p OR p
No or few qualifications and first child relatively early 0.4 * 1.2 -
No or few qualifications and first child relatively late 2.2 ** 1.6 -
Intermediate qualifications and first child relatively early ref ref
Intermediate qualifications and first child relatively late 3.0 *** 2.0 *
Higher qualifications and first child relatively early 0.8 - 0.3 * Education and age
Higher qualifications and first child relatively late 0.8 - 0.9 -
Farmer, self-employed 1.4 -
Higher-level and intellectual occupations 3.9 ***
Intermediate occupations 1.4 -
Manual worker 1.7 -
Clerical and sales worker ref
Respondent’s social group
Other (inactive and other?) 0.8 -
1st birth in first union ref ref
Union order
Table 4: (Continued)
Women Men
OR p OR p
Man younger than woman 2.3 ***
Man and woman same age ref
Age difference between partners
Woman younger 1.3 -
Practicing 0.4 *** 0.5 *
Non-practicing ref ref
Religious practice
No religious affiliation 1.2 - 1.7 -
Traditional ref ref
Attitude
Not traditional 0.5 ** 0.6 *
Spent most of childhood with parents ref
Childhood family
history Spent most of childhood without parents 2.0 **
0 - 2 years 0.5 ***
Duration of union
at 1st birth 3 and more years ref
Population of reference: Men and women who had a first child between 1980 and 1995 within a union that lasted at least ten years after the first birth, where the respondent is a French national and the child is the first for both parents. Sample sizes are 721 for the female model and 489 for the male model.
Source: ERFI 2005 survey
Notes: Significance levels, ***: p < 0.01; **: p between 0.01 and 0.05; *: p between 0.05 and 0.1.
Female model: -2 Log L = 528.4 / concordant pairs = 71 Male model: -2 Log L = 366.7 / concordant pairs = 66.8
Ranking of variables by explanatory value:
Male model: Interval between union formation and first child / Union order/ Age Education / Traditional values
Female model: Age Education / Religion / Age difference between partners / Traditional values / Social group / Union order / Having spent or not spent childhood with parents.
Other model variables: Birth cohort / Opinion on male-female relations / Marital status at time of first birth / Sibship size.
breakdown of the union. The sample size in the ERFI survey is not large enough to distinguish between these cases.
Another justification for using this survey is the possibility of considering variables relating to values. Religion is an undeniable vector of values. The results show that religious practice, even occasional, is associated with a lower probability of having only one child (OR=0.4/0.5). Religion, however, covers fairly different forms of practice depending on faith and sex (Régnier-Loilier and Prioux 2008), which makes it difficult to interpret these results more closely. The small number of occasional and regular attendees is another difficulty.
Among the other constructed variables of opinions and values, the only significant one relates to a traditional concept of the family and relationships within the couple. Contrary to our hypotheses, the least traditional men and women are least likely to adopt the one-child model (OR=0.5 or 0.6), and views on female employment have no significant influence. It would appear that the one-child model corresponds to a more conservative and traditional concept of relationships within the couple and the family.26
6. Conclusion
The gradual adoption of a low fertility regime in Europe shows itself both in an increase in childlessness and in the diffusion of the one-child model. We have demonstrated the contrast between the general increase in childlessness and the great diversity in the extent and development of the one-child model, even within countries that are culturally close. In Germany and England & Wales, childlessness is gaining ground at the expense of the one-child model, whereas in Southern European countries the two are increasing together. France lies in a stable intermediate position with relatively low childlessness and a fairly high proportion of women with only one child. This relative stability is remarkable, given the expected effects of two major family demographic trends that positively affect the likelihood of having only one child: increasing age at first birth and more frequent union dissolution among couples with one child. Without the effects of these two phenomena, the proportion of men and women in France who “choose” to have only one child would have fallen. The men and women who make this choice, for whatever reason, present specific profiles. Our research reveals two groups: one more “family”-oriented, who become parents soon after forming a union. Others, probably less “family”-oriented, wait longer before having their first child, and ultimately do not
26
go on to having a second. The trade-off between the woman’s work and a larger family is in these cases a predominant factor in the decision to have a second child. A clear distinction can be seen among women – between those with high educational qualifications, associated with a fairly low probability of having only one child, and high social status (higher-level and intermediate occupations), or self-employment which is more closely associated with the one-child model. The various regressions also show the importance of the dimensions of “socialization during childhood” and “culture”. The one-child model appears to be transmitted from one generation to the next, and the effects of religion, nationality, and social origin are highly important.
References
Avdeev, A. (2003). On the way to on-child family: Are we beyond the point of no return? Some considerations concerning the fertility decrease in Russia. Population of Central an Eastern Europe: Challenge and opportunities. European population conference 2003: 139-163.
Berrington, A. (2004). Perpetual postponers? Women’s, men’s and couple’s fertility intention and subsequent fertility behaviour. Population Trends 117: 9-19. BiB (2004). Bevölkerung: Fakten, Trends, Ursachen, Erwartungen - Die wichtigsten
Fragen.
Bozon, M. (1991). Women and the age gap between spouses: An accepted domination? Population - An English selection 3: 113-148.
Breton, D. and Prioux, F. (2005). Two Children or Three? Influence of Family Policy and Sociodemographic Factors. Population-E 60(4): 415-446.
doi:10.2307/4148181.
Brousse, C. (1999). La répartition du travail domestique entre conjoints reste très largement spécialisée et inégale. France, Portrait social 1999-2000. Paris: INSEE: 135-151.
Desplanques, G. (1987). Cycle de vie et milieu social. Paris : Collections de l’INSEE, Série D, n° 117.
Desplanques, G. (1994). Taille des familles et milieu social. Insee Première 296. Desplanques, G. (2005). Pour une histoire des enquêtes familles. In Lefèvre, C. and
Filhon, A. (dir). Histoires de familles, histoires familiales. Paris : Les Cahiers de l’Ined n°156: 15-27.
Dorbritz, J. (2005). Kinderlosigkeit in Deutschland und Europa. Daten, Trends und Einstellungen. Zeitschrift für Bevölkerungswissenschaft 30(4): 359-408.
Ekert-Jaffé, O., Joshi, H., Lynch, K., Mougin, R., and Rendall, M. (2002). Fertility, timing of births and socio-economic status in France and Britain: Social policies and occupational polarization. Population-E 57(3): 475-507.
doi:10.2307/3246636.
Frejka, T. and Sardon, J.-P. (2007). Cohort birth order, parity progression ratio and parity distribution trends in developed countries. Demographic Research 16(1): 315-374. doi:10.4054/DemRes.2007.16.11.
Gerster, M., Keiding, N., Knudsen, L. B., and Strandberg-Larsen, K.(2007). Education and second birth rates in Denmark, 1981-1994. Demographic Research 17(8): 181-210. doi:10.4054/DemRes.2007.17.8.
Jefferies, J. (2001). A reluctance to Embrace the One-Child Family in Britain? EURESCO Conference “The second Demographic Transition in Europe”. Bad Herrenalb, Allemagne. 23-28 juin 2001.
Köppen, K. (2006). Second births in Western Germany and France. Demographic Research, 14(14): 295-330. doi:10.4054/DemRes.2006.14.14.
Kravdal, O. (2007). Effects of current education on second- and third-birth rates among Norwegian women and men born in 1964: Substantive interpretations and methodological issues. Demographic Research 17(9): 211-246.
doi:10.4054/DemRes.2007.17.9.
Kreyenfeld, M. (2002). Time-squeeze, partner effect or self-selection? An investigation into the positive effect of women’s education on second birth risks in West Germany. Demographic Research 7(2): 15-48. doi:10.4054/DemRes.2002.7.2. Kreyenfeld, M. and Zabel, C. (2005). Female education and the second child: Great
Britain and Western Germany compared. Schmollers Jahrbuch – Zeitschrift für Wirtschafts- und Sozialwissenschaften 125: 145-156.
Laufer, D. (1999). Enfants uniques. Des petites familles sous le regard des autres. Paris : Bayard Éditions: 181 p.
Lutz, W., Skirbekk, V., and Testa, M. R. (2005). The low fertility trap hypothesis: Forces that may lead to further postponement and fewer births in Europe. Vienna: Vienna Institute of Demography of the Austrian Academy of Science: 36p. (European demographic research papers; 2005-4).
doi:10.1553/populationyearbook2006s115.
McKibben, B. (1998). Maybe One. A Case for Smaller Families. New York: A Plume Book: 254 p.
Olah, L. Sz. (2003). Gendering fertility: Second births in Sweden and Hungary. Population Research and Policy Review 22: 171-200.
Parr, N. (2007). Which women stop at one child in Australia? Journal of Population Research 24(2): 207-225. doi:10.1007/BF03031931.
Prioux, F. (1997). Fertility in Spain and Italy: fertility by birth order, family size and birth intervals. Participation of Ined Researchers in the Conference, XXIII rd General Population Conference, Beijing, China, 11-17 October 1997. Paris: Ined (Dossiers et Recherches n°69B: 157-165).
Prskawetz, A. and Zagaglia, B. (2005). Second Births in Austria. Vienna Yearbook of Population Research 1: 143-170. doi:10.1553/populationyearbook2005s143.
Régnier-Loilier, A. and Prioux, F. (2008). Does religious practice influence family behaviours? Population and Societies 447: 1-4.
Rendall, M. and Smallwood, S. (2003). Higher qualifications, first-birth timing, and further childbearing in England and Wales. Population Trends 111: 19-26. Statistics Norway (2008). Number of children distributed, by age and cohort.
http://www.ssb.no/english/subjects/02/02/10/fodte_en/arkiv/tab-2008-04-09-08-en.html
Tarnero-Pansart, M. C. (dir). (1999). L’enfant unique. La mauvaise réputation. Autrement, Collection Mutations 186: 196 p.
Terra Abrami, V. and Sorvillo, M. P. (1993). La fécondité en Italie et dans ses régions: analyse par période et par génération. Population 48(3): 735-751.
Tilastokeskus/ Statistics Finland. (2007). Population Structure and vital statistics by municipality 2006: 211 p.
Torr, B. M. and Short, S. E. (2004). Second Births and the Second Shift: A Research Note on Gender Equity and Fertility. Population and Development Review 30(1): 109-130. doi:10.1111/j.1728-4457.2004.00005.x.
Toulemon, L. (1996). Very few couples remain voluntarily childless. Population - an English selection 8: 1-27.
Toulemon, L. (2001). Combien d’enfants, combien de frères et sœurs depuis cent ans? Population et Sociétés 374: 1-4.