25
THE EFFECT OF DIFFERENT REGRESSION-BASED ALGORITHMS ON
FREQUENCY BASED EMG FATIGUE
Maddie Ivy1, Jorge M. Zuniga2, Alex Sikora1, Erin Ino1, Gabriel Aguero1, Esther Cho1
1Department of Exercise Science and Pre-Health Professions, Creighton University, Omaha, NE, USA 2Department of Biomechanics, University of Nebraska Omaha, Omaha, NE, USA
Abstract
Purpose: The purpose of this study was to determine if there were significant differences between the
electromyographic (EMG) mean power frequency at the fatigue threshold (MPFFT) and D-max methods
when assessing neuromuscular fatigue (NMF). Methods: Twenty-two adults (17 men, 5 women; mean ± standard (SD): age = 21.1 ± 2.8 years, body weight = 78.0 ± 12.7 kg, height = 177.4 ± 9.6cm) volunteered to participate in the investigation. Each participant performed an incremental cycle ergometry test to fatigue while EMG signals were measured from the vastus lateralis (VL) muscle. Mean, SD, and range values were calculated for the power outputs determined by the MPFFT and
D-max methods. The relationships for EMG frequency and power output for each participant were examined using linear regression (SPSS software program, Chicago, IL). An alpha level of p≤0.05 was considered significant for all statistical analyses. A paired dependent t-test was used to determine if there were significant mean differences in power outputs determined by the MPFFT method (Mean ±
SD; 161.9 ± 44.9 W) and D-max method (168.9 ± 36.6 W). Results: The results of the dependent t-test indicated that there were not significant mean differences (p>0.05) between the MPFFT and D-max
values (p=0.29). The zero-order correlation for the power outputs determined by the MPFFT and D-max
methods showed that the two methods were fairly correlated (r=0.69). Conclusion: The result of the present investigation suggests that the two regression-based algorithms can be used to calculate neuromuscular fatigue.
26
Introduction
Electromyography (EMG) is a technique that uses electrodes to measure electrical activity due to a muscle contraction1. By
analyzing both amplitude and frequency, EMG can be used to determine the strength and number of motor units firing during physical activity. The amplitude is expressed in voltage over a specific period of time. The height of the EMG amplitude can give insight to changes in muscle fiber recruitment and firing rate. The EMG frequency is the rate at which the waveform fluctuates above and below baseline and is expressed in Hertz (Hz). Change in the frequency of the EMG represents changes in the conduction velocity of the motor unit action potentials. Thus, a decreased EMG frequency has been associated with slower action potentials as a result of muscle fatigue. However, muscle temperature may be inversely related to the frequency of the EMG, offsetting the fatigue-induced decreases in EMG frequency2. To ensure reliable data,
previous studies have suggested that the EMG data should be normalized as a percent of the EMG center frequency at beginning of exercise3.
Mean Power Frequency at the fatigue threshold (MPFFT) is a muscular fatigue
threshold that assesses the fatigue-induced decreases in the frequency content of the EMG signal as a function of power output over time to determine the onset of muscular fatigue4. MPF
FT is determined
using the frequency of EMG current through electrodes and a cycle ergometer test. Once the test is complete, a regression-based algorithm is applied that averages the highest power output (in a non-significant slope coefficient greater than 0.05) with the lowest power output (in a significant negative slope coefficient less than 0.05)5. Previous studies have shown
that a decrease in the frequency of EMG is proportional to muscular fatigue6.
Another well-established fatigue threshold technique is the use of the D-Max regression algorithm. The D-Max has been widely used in metabolic parameters of fatigue, such as blood lactate levels to determine the anaerobic threshold. Lactate measurements are obtained through an incremental intensity exercise that continues until the participant reaches fatigue. Once the lactate levels have been gathered, they are placed on a scatter plot with the lowest and highest lactate levels connected with a straight line. Using a third-order polynomial as a line of best fit, the maximum distance between the straight and curved line will indicate the lactate threshold. Through previous investigations the D-max method has been proven to be a valid method in determining lactate threshold in response to an incremental cycle ergometer test7. No
27
fatigue without the need of drawing blood samples. Thus, the purpose of the present study was to determine if the D-max regression-based algorithm provides an accurate method of determining fatigue using the frequency content of the EMG signal. Based on the findings of previous investigations we hypothesized that there will not be significant difference between the MPFFT and D-max methods indicating
the D-Max method using the frequency content of the EMG signal will be a better non-invasive alternative for the assessment of NMF7-8.
Methods
Participants
Twenty-two (17 men, 5 women; mean ± SD; age=21.1 + 2.8 years; body weight= 78.0 + 12.7 kg; height= 177.4 + 9.6 cm) volunteered to participate in the investigation. All participants participated in regular physical activity. The study was approved by the University Institutional Review Board for Human Participants. Before testing, all participants completed a health history questionnaire and signed an informed consent document.
Instrumentation and Procedures
Maximal Cycle Ergometer Protocol
Each participant performed an incremental test to exhaustion on a Calibrated Lode (Corival V3, Groningen, the Netherlands) electronically braked cycle ergometer at a pedal cadence of 70 revŸmin-1. Seat height
was adjusted so that participants could perform near full leg extension while
cycling. Heart rate was monitored using a Polar Heart Rate Watch system (Polar Electro Inc., Lake Success, NY). Borg’s rating of perceived exertion (RPE 6-20) scale was explained to the participant and recorded for each stage of the test. The participants began the test pedaling at 50 W, and the power output was increased by 25 W after each 2 minute stage until voluntary exhaustion. The test was terminated if the participant met at least two of the following three criteria9: a) 90% of age-predicted
heart rate (220-age), b) RPE of 18 or higher, and c) an inability to maintain the pedal cadence of 70 revŸmin-1. After the test was
finished the participants were encouraged to cool-down.
EMG Measurements
A bipolar surface EMG electrode (circular 4mm diameter, silver/silver chloride, Biopac Systems, Inc., Santa Barbara CA) arrangement was placed on the Vastus Lateralis of both legs according to recommendations from the SENIAM Project10. A reference line was drawn one
third of the distance from the anterior superior iliac crest to the lateral border of patella10. The electrodes were placed 4 to 5
cm lateral from the reference line along a 20° angle6-7,10. The pennation angle was
measured using a goniometer (Smith and Nephew Rolyan, Inc., Menomonee Falls, WI) to approximate the placement of the electrodes on the VL11. A reference
28
for the electrode placement were made using a standard measuring tape (Gulik Tape, II, Moberly, Missouri). Prior to placing the electrodes, the skin at each electrode site was shaved, abraded, and cleaned with an alcohol wipe. Interelectrode impedance was less than 2000 Ω. The EMG signal was amplified (gain: x1000) using differential amplifiers (EMG 100, Biopac Systems, Inc., Santa Barbara, CA, bandwidth= 10-500 Hz).
Signal Processing
The raw EMG signals from the VL were digitized at 1000 Hz and stored in a personal computer for subsequent analysis (Inspiron 1 520, Dell, Inc., Round Rock, TX). The signal processing was performed using a custom program written with LabVIEW programming software (version 7.1, National Instruments, Austin, TX). The EMG signals were bandpass filtered (fourth-order Butterworth) at 10-500 Hz12.
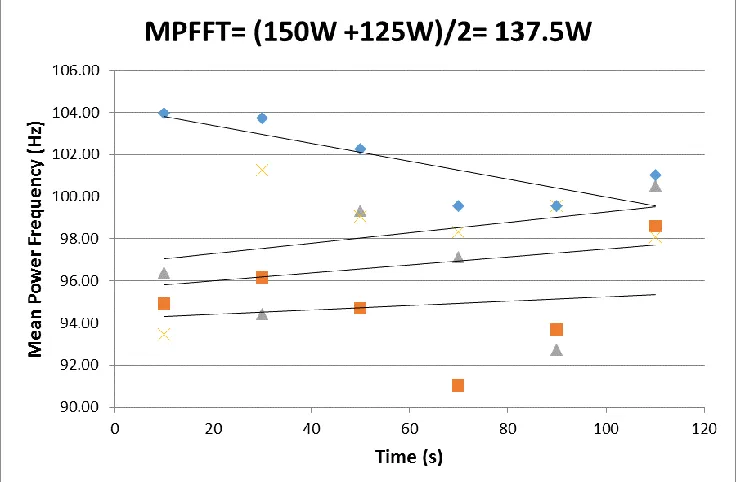
Determination of MPFFT
The MPFFT was determined by averaging the
highest power output that resulted in a non-significant (p>0.05; two-tailed t-test) slope coefficient for the EMG MPF vs. time relationship, with the lowest power output that resulted in a significant (p<0.05) negative slope coefficient (Figure 1). The MPFFT was assessed for the dominant and
nondominant legs using the same procedures.
Determination of the D-Max
A new method proposed to assess a fatigue threshold was the D-max method, which
utilized an algorithm proposed by Cheng et al.13 for assessing lactate thresholds and
ventilatory thresholds13. A third-order
curvilinear regression was fit to EMG frequency versus the power output relationship, and a straight line was drawn from the first and last data point of the curve. The point that yields the maximal perpendicular distance (D-max) from the straight line to the third-order curvilinear regression line was determined to be the D-Max fatigue threshold (Figure 2). The time to the nearest second of the D-max was then used to calculate the power output (W) for the fatigue thresholds (Figure 3).
Statistical analyses
29
Results
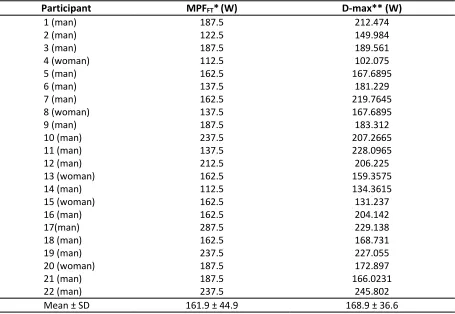
Table 1 displays mean, SD and range values for the physical characteristics of the participants. Table 2 provides the MPFFT
and D-max values that were determined for each participant based on the EMG frequency (Hz) of their dominant leg. The results of the dependent t-test indicated
that there were not significant mean differences (p>0.05) between the MPFFT
and D-max values (p=0.29). The zero-order correlation for the power outputs determined by the MPFFT and D-max
methods showed that the two methods were moderately correlated (r = 0.69).
Table 1. Physical characteristics and mean, SD, and range values for fatigue thresholds (n=22). Variable Mean ± SD (range)
Age (years) 21.1 + 2.8 (19-33)
Body Weight (kg) 78.0 + 12.7 (52.2-108.4)
Height (cm) 177.4 + 9.6 (162.6-193.0)
MPFFT* (W) 161.9 + 44.9 (112.5-287.5)
D-max** (W) 168.9 + 36.6 (102.1-229.1)
*MPFFT= EMG mean power frequency at the fatigue threshold.
**D-max = The point that yields the maximal perpendicular distance from the straight line to the third-order curvilinear regression line.
Figure 1. Example of method used for estimating the mean power frequency at the
30
Table 2. Individual, mean, and SD values for fatigue thresholds (n=22).
Participant MPFFT*(W) D-max** (W)
1 (man) 187.5 212.474
2 (man) 122.5 149.984
3 (man) 187.5 189.561
4 (woman) 112.5 102.075
5 (man) 162.5 167.6895
6 (man) 137.5 181.229
7 (man) 162.5 219.7645
8 (woman) 137.5 167.6895
9 (man) 187.5 183.312
10 (man) 237.5 207.2665
11 (man) 137.5 228.0965
12 (man) 212.5 206.225
13 (woman) 162.5 159.3575
14 (man) 112.5 134.3615
15 (woman) 162.5 131.237
16 (man) 162.5 204.142
17(man) 287.5 229.138
18 (man) 162.5 168.731
19 (man) 237.5 227.055
20 (woman) 187.5 172.897
21 (man) 187.5 166.0231
22 (man) 237.5 245.802
Mean ± SD 161.9 ± 44.9 168.9 ± 36.6
*MPFFT= EMG mean power frequency at the fatigue threshold.
**D-max = The point that yields the maximal perpendicular distance from the straight line to the third-order curvilinear regression line.
Figure 2. Example of D-max method used to determine the time to fatigue, to the nearest second, for the linear
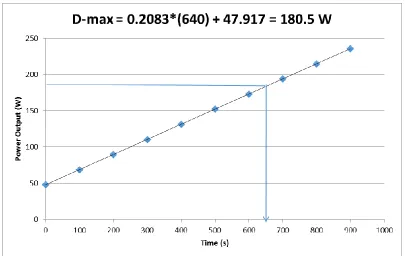
31 Figure 3. Example of method used to find the power output for the D-max. To calculate D-max thresholds a linear
regression equation was used derived from the time and power output relationship as follows: D-max Power Output (W) = 0.2083*s + 47.917. In the current example W = 0.2083*(640s) + 47.917 = 180.5 W.
Discussion
The purpose of this study was to determine whether there were significant differences between the MPFFT and D-max methods in
determining neuromuscular fatigue. MPFFT
is a known method to estimate the development of NMF, but using the D-max regression based algorithm associated with EMG frequency has been untested. Our hypothesis was that the two methods were not significantly different and thus used interchangeably. The present investigation found that the two regression-based algorithms did not produce significant mean differences (p>0.05, Tables 1 and 2). Using a zero order correlation, it was determined that the mean power output values for the MPFFT (161.87 + 44.85) and D-max methods
(168.92 + 36.62) were fairly correlated
(r=0.69). These findings were in agreement with our hypothesis that the two algorithms would produce similar results.
Previous studies have shown that EMG frequency and amplitude are accurate techniques to predict the development of NMF4. In the past, PWC
FT has been used in
determining the neuromuscular fatigue threshold delimiting the boundaries between moderate and heavy exercise domains while MPFFT marks the boundaries
between heavy and severe exercise intensity domains4.
Previous studies have examined the effects of temperature on EMG frequency based fatigue thresholds2. Temperature was found
32
of the EMG signal offsetting the fatigue induced decline in frequency2,4,9. It is
possible that by examining the EMG frequency responses of the overall test by using the D-Max method rather than individual stages using the MPFFT
methodology may be a better approach to ameliorate the effect of muscle temperature when determining the development of neuromuscular fatigue. To our knowledge no previous investigations have compared the use of MPFFT and D-max
methods for assessing neuromuscular fatigue thresholds. The implications of this study showed that D-max would be a reliable, comprehensive, and time-efficient method to assess NMF.
One of the limitations of the study was that only 22 participants were assessed. If more participants had been used there would have been less error and our statistical values would have been more accurate. Choosing the participants at random allowed for a diverse and representative sample, but also could have caused error since body composition, fitness level, sex and testing experience were not taken into account.
Based on the results of the present investigation it is recommended that future studies consider using the D-max method to assess NMF. Examining the entire test eliminates the potential for error found in the analysis of individual stages of the MPFFT due to noise or a significant value
that is not actually due to fatigue. As seen
in Figures 2 and 3, the D-max predicts the time and frequency that NMF develops in a very accurate and mathematically sound technique. Furthermore, the D-max method is easier to use and only requires the ability to construct a graph with a third order polynomial regression curve using Excel program.
Conclusions
The present investigation found that there was no significant difference between the MPFFT and D-max methods of calculating
NMF. The findings of this study show that the D-max is an accurate regression based algorithm for assessing NMF. These findings are relevant for future studies because the D-max includes the entire cycle ergometry test EMG data providing an overall analysis and comprehensive assessment with less calculation than the MPFFT method. Studies
should consider using the D-max method as a means of calculating NMF in place of the MPFFT method.
Acknowledgements
The authors would like to thank all of the participants who donated their time for the study and students in EXS 407: Basic Statistics and Research Design (Spring 2016) who helped with participant recruitment and data collection.
Address for Correspondence
33 References
1. Zuniga JM, Housh TJ, Camic CL, Hendrix CR, Schmidt RJ, Mielke M, Johnson GO. (2010). A mechanomyographic fatigue threshold test for cycling. Int J Sports Med, 31, 636-643.
2. Petrofsky JS. (1979). Frequency and amplitude analysis of the EMG during exercise on the bicycle ergometer. Eur J Appl Physiol Occup
Physiol, 41, 1-15.
3. Petrofsky J, Laymon M. (2005). The relationship between muscle temperature, MUAP
conduction velocity and the amplitude and frequency components of the surface EMG during isometric contractions. Basic Appl Myol, 15, 61-74.
4. Camic CL, Housh TJ, Johnson GO, Hendrix CR, Zuniga JM, Mielke M, Schmidt RJ. (2010). An EMG frequency-based test for estimating the neuromuscular fatigue threshold during cycle ergometry. Eur J Appl Physiol, 108, 337-345. 5. Hendrix CR, Housh TJ, Johnson GO, Mielke M,
Camic CL, Zuniga JM, Schmidt RJ. (2009). A new EMG frequency-based fatigue threshold test. J
Neurosci Methods, 181, 45-51.
6. Malek MH, Housh TJ, Coburn JW, Weir JP, Schmidt RJ, Beck TW. (2006). The effects of interelectrode distance on electromyographic amplitude and mean power frequency during incremental cycle ergometry. J Neurosci
Methods, 151, 139-147.
7. Zhou S, Weston SB. (1997). Reliability of using the D-max method to define physiological responses to incremental exercise testing.
Physiol Meas, 18, 145-154.
8. Schneider DA, Phillips SE, Stoffolano S. (1993). The simplified V-slope method of detecting the gas exchange threshold. Med Sci Sports Exerc, 25, 1180-1184.
9. Moritani T, Nagata A, deVries HA, Muro M. (1981). Critical power as a measure of physical work capacity and anaerobic threshold.
Ergonomics, 24, 339-350.
10. Hermens HJ, Freriks B, Disselhorst-Klug C, Rau G. (2000). Development of recommendations for SEMG sensors and sensor placement
procedures. J Electromyogr Kinesiol, 10, 361-374.
11. Fukunaga T, Ichinose Y, Ito M, Kawakami Y, Fukashiro S. (1997). Determination of fascicle length and pennation in a contracting human muscle in vivo. J Appl Physiol (1985), 82, 354-358.
12. Baniqued A, Zuniga JM, Strunc TC, Keenan KM, Boken AK, Anderson JJ. (2015). The effect of subcutaneous fat on a frequency-based fatigue threshold. Int J Exerc Sci, 2, 21-28.