RESEARCH ARTICLE
Persian version of attitudes towards loss of hearing
questionnaire
Parisa Heidari1, Jamileh Fatahi1*, Reza Hoseinabadi1, Nematollah Rouhbakhsh1, Sasan Dabiri Satri2, Gabrielle Helena Saunders3,4, Elham Faghihzadeh5
1- Department of Audiology, School of Rehabilitation, Tehran University of Medical Sciences, Tehran, Iran
2- Department of Otolaryngology, Head and Neck Surgery, Amir Alam Hospital, Tehran University of Medical Sciences, Tehran, Iran 3
- National Center for Rehabilitative Auditory Research, Portland VA Medical Center, Portland, Oregon, USA
4- Department of Communication Sciences, University of Connecticut, Storrs, Connecticut, USA
5- Department of Biostatistics, School of Allied Medical Sciences, Shahid Beheshti University of Medical Sciences, Tehran, Iran
Received: 2 Dec 2018, Revised: 18 Dec 2018, Accepted: 29 Dec 2018, Published: 15 Apr 2019
Abstract
Background and Aim: Investigations have shown that the patient’s attitudes toward hearing loss and hearing aids impact hearing aid benefits and its use. In this regard, Saunders and Cien-kowski (1996) developed the “attitudes towards loss of hearing questionnaire” to examine some of the psychosocial factors underlying the use of hearing aids. This study has focused on pre-paring a Persian version of this questionnaire and analyzing its validity and reliability.
Methods: The original English version of the questionnaire was translated into Persian, and its content and face validities were determined by related experts. The final questionnaire was administered to 100 hearing impaired people (52 males and 48 females) aged 30 to 65 years with the mean (SD) age of 54.54 (12.05) years. The test-retest reliability was assessed in 20 pat-ients.
Results: The results of face validity assessment revealed that our questionnaire has a high quality in translation, intelligibility, and cultural
compatibility. The mean scores of the content validity ratio and content validity index of this questionnaire was 0.71 and 0.98, respectively. The mean (SD) total score of this questionnaire was 60.46 (10.02) and the mean scores of denial of hearing loss, negative associations, negative coping strategies, manual dexterity and vision and hearing-related esteem were 15.58, 12.10, 20.40, 5.30, and 7.08, respectively. The overall Cronbach α value was 0.798. The test-retest reliability showed good results for the global score (Intraclass correlation = 0.989).
Conclusion: Based on the obtained results, the Persian version of the questionnaire possesses satisfactory validity and reliability.
Keywords: Attitudes; hearing loss;
questionnaire; hearing aid; reliability; validity
Citation: Heidari P, Fatahi J, Hoseinabadi R, Rouhbakhsh N, Dabiri Satri S, Saunders GH, Faghihzadeh E. Persian version of attitudes towards loss of hearing questionnaire. Aud Vestib Res. 2019;28(2):124-133.
Introduction
Pure tone and speech audiometry tests are not reliable tools for predicting the results of using
* Corresponding author: Department of Audiology,
hearing aids in the real world, and their results are not significantly related to the amount of hearing aid used in everyday life [1]. In recent years, researchers have also found that psycho-logical attitudes toward hearing loss and hearing aids affect the outcomes of using hearing aids. Studies have shown that the use of hearing aids is lower among those who report a negative attitude toward hearing aids [2]. In other words, non-auditory factors such as expectations before using a hearing aid, motivation, and desire to have hearing aids, stigma, and individual cha-racteristics are all related to the satisfaction of hearing aids, its usage, or benefits. For this rea-son, new questionnaires have been developed that are rapidly and effectively evaluate psycho-logical attitudes [3-6].
Attitudes towards Loss of Hearing Question-naire (ALHQ) was first published in 1996 by Saunders and Cienkowski [7]. It includes 22 questions in five subscales of denial of hearing loss, negative associations, negative coping strategies, manual dexterity and vision and hearing-related esteem. The five questions of this questionnaire differ between hearing aid users and non-hearing aid users. The question-naire was developed with two main goals: first, as a tool to clarify some of the psychological issues that lead to the rejection of hearing aids, and second, as a counseling tool before the hearing aid is set up. Unlike most questionnaires that are available to audiologists, ALHQ is neither a tool for measuring hearing loss or hearing impairment, nor a tool for examining the outcome, but a tool to clarify some of the psychological attitudes towards hearing loss and hearing aids, which may lead to not using hearing aids [3].
When the patient's ALHQ scores on a subscale show a negative attitude, the clinician can use these models to give some advice to the patient [8]. The questionnaire has also been translated into Korean [9] and Portuguese [10]. The aim of this study was to provide a Persian version of ALHQ and to evaluate its validity and reliability.
Methods
The present study had three parts of translation, evaluation of validity and reliability, and acqui-sition of the Persian version of the ALHQ.
Translation
After obtaining permission from the original author, the ALHQ was translated from English into Persian by two translators separately in acc-ordance with the international quality of life association (IQOLA) [11]. Then, the two tra-nslations were merged. In the next step, two translators were asked to translate the Persian version back to English. Again, the two back-translations were merged to produce a pre-final version of the ALHQ. The pre-final version was submitted to the original author.
Assessing the validity of the questionnaire
To evaluate face and content validity, the Persian version was presented to seven audio-logists to comment on the intelligibility and clarity of questions and for analyses of these data, we used content validity ratio (CVR) and content validity index (CVI).
Administration of the questionnaire
After considering the comments to the ALHQ, The final version (Appendix 1) was provided to 100 hearing impaired patients consisting of 50 hearing aid users and 50 non-hearing aid users. The number of cases were recruited by conve-nience sampling method. The study participants of were selected among patients referring to the Audiology Clinic of Rehabilitation School of Tehran University of Medical Sciences. The participants were divided into two groups of hearing aid users (group 1) and not using hea-ring aids (group 2). The inclusion criteria of the study included clinical diagnosis of sensory hearing loss, lack of conductive hearing loss, aged between 30 to 65 years old and lack of otologic and neurologic diseases. After that, all participants signed the consent forms. We did tympanometry and audiometry for them and asked to complete the study questionnaire.
Statistical analysis
of the variables, the Kolmogorov-Smirnov test (p < 0.05) was used and the results showed that variables were not normally distributed. There-fore we used nonparametric statistical tests. In order to confirm test-retest reliability, 20 individuals including 10 hearing aid users and 10 non-hearing aid users after one to two weeks completed the questionnaire again. The intra-class correlation coefficient (ICC) and t-test were used to analyze the results.
In order to examine the internal consistency of the Persian version of the questionnaire, we cal-culated the correlation between the subscales and the correlation of each subscale with the total score of the questionnaire with the Pearson correlation test. Also, we calculated the Cron-bach α value. The data were analyzed in SPSS 22 at a significant level of less than 0.05.
Results
The number of participants in this study was 100, including 52 males and 48 females. The mean age of the participants was 54.54 with a standard deviation of 12.55 years within the age range of 30 to 65 years. The study subjects were divided into two groups of hearing aid users (group 1) and non-hearing aid users (group 2) each of which consisted of 50 individuals. On average, people in group 1 used hearing aids for 29.52 ± 43.31 months and mean ±SD duration of usage of hearing aids during the day was 8.40 ± 5.7 hours. The mean ±SD of hearing
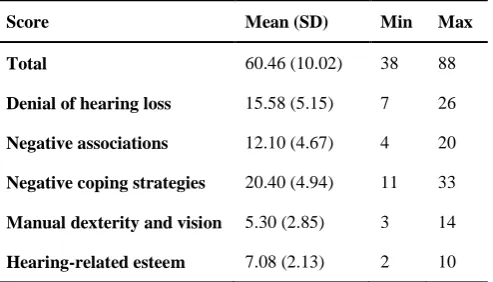
thresholds in the right ear for subjects in groups 1 and 2 was 48.58 ± 12.02 and 41.73 ± 19.40, respectively and thresholds in the left ear were 48.19 ± 10.98 and 43.20 ± 17.62, respectively. Table 1 presents the overall score of the par-ticipants’ questionnaire. As the Table shows, the mean total score of the questionnaire is 60.46 and the subscale of negative coping strategies and manual dexterity and vision obtained res-pectively the highest and lowest scores.
The mean ±SD value of CVR index was 0.76 ± 0.18 and the mean ± SD value of CVI index was 0.97 ± 0.05, which indicates that the Persian version of the questionnaire has proper content validity.
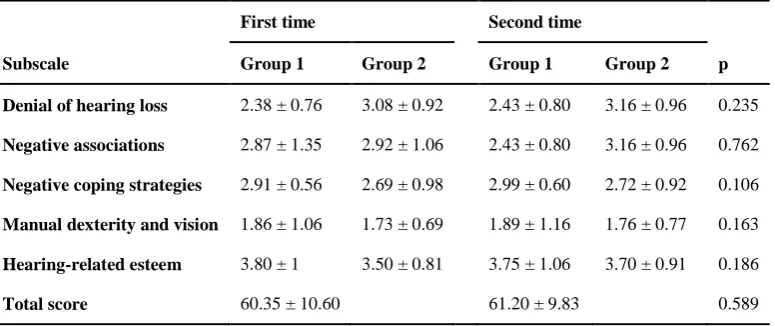
The ICC was 0.98 at a 95% confidence interval (0.97‒0.99), i.e. it has excellent reliability. Table 2 presents the scores of individuals in groups 1 and 2 in the first and second imple-mentation. According to the Table, no signifi-cant difference was observed of between the first and second performances regarding the scores of any of the subscales and the overall score of the questionnaire.
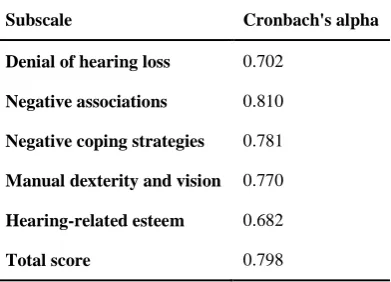
The Cronbach α value for each subscale and the overall score presents Table 3. As shown in the Table, the Cronbach α values were high in all subscales except hearing-related esteem and Cronbach α for the overall score of the ques-tionnaire was larger than 0.7%, which reflects the good internal consistency of the question-naire.
Table 1. Values for the attitudes towards loss of hearing questionnaire for all data combined (n = 100)
Score Mean (SD) Min Max
Total 60.46 (10.02) 38 88
Denial of hearing loss 15.58 (5.15) 7 26
Negative associations 12.10 (4.67) 4 20
Negative coping strategies 20.40 (4.94) 11 33
Manual dexterity and vision 5.30 (2.85) 3 14
Hearing-related esteem 7.08 (2.13) 2 10
Table 4 presents the correlation between the questions of each subscale and the general score of the questionnaire in of group 1, group 2, and as shown in Table 4 for group 1, all subscales except hearing-related esteem and for group 2, all subscales except of denial of hearing loss and manual dexterity and vision had a signifi-cant correlation with the overall score.
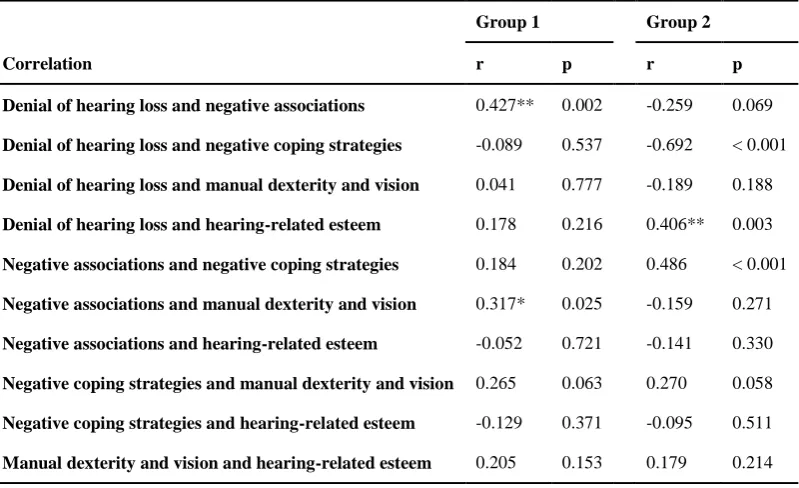
The results for the correlation between subsca-les are presented in Table 5. In group 1, there was a significant correlation between denial of hearing loss and negative associations (r =0.427, p = 0.002) and between negative association and manual dexterity and vision (r = 0.317, p = 0.025). In group 2, there was a significant cor-relation between denial of hearing loss and negative coping strategies (r = -0.692, p < 0.001), between denial of hearing loss and hear-ing-related esteem (r = 0.406, p = 0.003), and between negative associations and negative cop-ing strategies (r = 0. 486, p < 0.001) but there was no correlation between other subscales.
Discussion
The findings of this study are discussed in three parts of: validity of the Persian version of the questionnaire, its internal consistency, and sco-res of the subscales of the questionnaire.
The content and face validity of the Persian
version of the questionnaire
The results of statistical analysis showed that the Persian version of the questionnaire had a suitable face and content validity, i.e. it is clear, transparent, understandable, and compa-tible with the of Iranian society culture. Since the present studies have not changed the content of the original questionnaire, so the content validity in the Persian version is the same as in the original version of the questionnaire. In the studies conducted on the Portuguese [10] and Korean [9] versions, the CVR and CVI indi-cators were not investigated.
Internal consistency of the questionnaire
The Cronbach α values in all subscales except hearing-related esteem was high and showed that the questions of the questionnaire had a good internal consistency. In the study of Saunders et al., all subscales except hearing-related esteem had high Cronbach α values [3], which is consistent with the results of this study. The low Cronbach α value in the hearing-related esteem subscale could be due to the low number of questions (only two questions) in this sub-scale.
In the study in Brazil on the Portuguese version of this questionnaire, a significant but weak correlation was found among the subscales. There was a correlation between the subscales Table 2. Values for the attitudes towards loss of hearing questionnaire for group 1
and group 2 (n = 100)
First time Second time
Subscale Group 1 Group 2 Group 1 Group 2 p
Denial of hearing loss 2.38 ± 0.76 3.08 ± 0.92 2.43 ± 0.80 3.16 ± 0.96 0.235
Negative associations 2.87 ± 1.35 2.92 ± 1.06 2.43 ± 0.80 3.16 ± 0.96 0.762
Negative coping strategies 2.91 ± 0.56 2.69 ± 0.98 2.99 ± 0.60 2.72 ± 0.92 0.106
Manual dexterity and vision 1.86 ± 1.06 1.73 ± 0.69 1.89 ± 1.16 1.76 ± 0.77 0.163
Hearing-related esteem 3.80 ± 1 3.50 ± 0.81 3.75 ± 1.06 3.70 ± 0.91 0.186
Total score 60.35 ± 10.60 61.20 ± 9.83 0.589
of denial of hearing loss with negative coping strategies and hearing-related esteem and also between negative coping strategies with nega-tive associations and hearing-related esteem [10]. In the present study, there was a corr-elation between denial of hearing loss subscale with the negative coping strategies and hearing-related esteem and also between negative asso-ciations and negative coping strategies which is consistent with Bastos et al. study results in Brazil, but there was no correlation between the subscales of negative coping strategies and hearing-related esteem in this study, and in this aspect, there is an inconsistency with the study of Bastos et al. [10].
The results of the study by Saunders et al.
showed that with the exception of the corr-elation between the scores of negative coping strategies and denial of hearing loss which was also seen in this study, the correlation between all subscales was low [3]. In the present study, the correlation between negative coping stra-tegies and denial of hearing loss among sub-scales was observed, and in this regard, it is consistent with the study by Saunders et al. results [3].
The differences observed between various stu-dies can be due to differences in the studied populations and the characteristics of the sub-jects such as cultural differences or underlying diseases. In general, the results of this study showed that despite some minor overlap bet-ween subscales, they are independent of each other.
Subscales of ALHQ
In this research, the scores of subscales of the ALHQ were also examined and the results are as follows:
Denial of hearing loss
As shown in Table 1, the high scores in this subscale indicate that a person does not feel his hearing as a problem that needs hearing aids. Studies have shown that even when hearing loss, age, and gender are accounted, those who report fewer disabilities are less likely to use hearing aids than those who report more Table 3. Cronbach's α value for each
Persian attitudes towards loss of hearing questionnaire subscales (n = 100)
Subscale Cronbach's alpha
Denial of hearing loss 0.702
Negative associations 0.810
Negative coping strategies 0.781
Manual dexterity and vision 0.770
Hearing-related esteem 0.682
Total score 0.798
Table 4. Correlations between mean scores of each Persian attitudes towards loss of hearing questionnaire subscales and total score of the questionnaire (n = 100)
Group 1 Group 2
Subscale r p r p
Denial of hearing loss 0.404** 0.004 0.062 0.671
Negative associations 0.827** 0.001 0.520** < 0.001
Negative coping strategies 0.528** 0.001 0.543** < 0.001
Manual dexterity and vision 0.542** 0.001 0.269 0.059
disability [12]. Therefore, the high score in this subscale is likely to result in a low hearing aid or its low usage.
Negative associations
According to Table 1, the high scores in this subscale indicate that the person associates the hearing aid with aging and shameful feelings. Studies have shown that this is a common and similar feeling among young and old people [13] and it is a problem because studies have shown that negative attitudes towards hearing aids cause low usage and less satisfaction of hearing aids [2].
Negative coping strategies
The average person's scores (Table 1) in ques-tions related to this subscale is measured by the amount of person's use of undesirable behavior techniques such as leaving the community or pretending to hear to cope with hearing loss. A weak coping strategy with hearing loss is asso-ciated with negative psychological outcomes such as depression and loneliness [14,15].
Manual dexterity and vision
Results of this study showed that those with a high score in this subscale had handicap problems or vision problems. A large number of hearing aid users are the elderly adults and therefore may have problems using hearing aids due to limited manual skills [16]. It has been shown that this subscale is related to the outcomes of using hearing aids, the amount of using of hearing aids, and their satisfaction [12], which was the only factor that differed between the reasons for young people and the elderly in the dissatisfaction with hearing aids [17].
Hearing-related esteem
According to the results of this study, the high score in this subscale indicates losing the confidence in hearing. Studies have shown that self-esteem is associated with self-confidence and the belief that a person can be successful in a particular job [18]. Expecting to learn the skills needed to use hearing aids requires that you have the confidence to take the first step. Table 5. Inter item correlations for the Persian attitudes towards loss of hearing
questionnaire (n = 100)
Group 1 Group 2
Correlation r p r p
Denial of hearing loss and negative associations 0.427** 0.002 -0.259 0.069
Denial of hearing loss and negative coping strategies -0.089 0.537 -0.692 < 0.001
Denial of hearing loss and manual dexterity and vision 0.041 0.777 -0.189 0.188
Denial of hearing loss and hearing-related esteem 0.178 0.216 0.406** 0.003
Negative associations and negative coping strategies 0.184 0.202 0.486 < 0.001
Negative associations and manual dexterity and vision 0.317* 0.025 -0.159 0.271
Negative associations and hearing-related esteem -0.052 0.721 -0.141 0.330
Negative coping strategies and manual dexterity and vision 0.265 0.063 0.270 0.058
Negative coping strategies and hearing-related esteem -0.129 0.371 -0.095 0.511
Manual dexterity and vision and hearing-related esteem 0.205 0.153 0.179 0.214 *Significant correlation at the level of 0.05
The overall score of the ALHQ
The results of this study showed that the high score in the ALHQ indicates a lack of hearing aids or less use of the hearing aid. In this way, people who had a high score in the question-naire were less likely to use hearing aids. Previous studies also follow the belief that attitudes and beliefs predict hearing behaviors for hearing aids [19,20].
As noted above, the findings of the subscales scores in the Persian version of the ALHQ are consistent with the results of Saunders et al. study [3].
Study of Bastos et al. in Brazil also showed that negative attitudes toward hearing loss and hea-ring aids called for counseling [10], which is consistent with the results of the present study. A study in Korea also indicates that the trans-lated version of ALHQ is a valuable clinical tool for auditory rehabilitation and counseling [9], and the result of this review is in line with the results of this study.
In the present study, those who had a high score in the questionnaire and therefore had a negative attitude toward hearing loss and hearing aids received a consultation.
Conclusion
The results of this study showed that the Persian version of ALHQ has a high degree of the face and content validity and reliability. This ques-tionnaire explains some of the issues that may endanger the success of using hearing aids and can be used at the clinic for consulting the people who need hearing aids.
Acknowledgments
This article is extracted from P. Heidari’s MSc thesis supported by grant No. 97-03-32-40418 from Tehran University of Medical Sciences, with the Code of Ethics Committee of IR.TUMS.FNM.REC.1397.146. We would like to thank all the participants who helped us with this research.
Conflict of interest
The authors declare that they have no conflict of interest.
References
1. Mueller HG. Three pre-tests: what they do and why experts say you should use them more. Hear J. 2010;63(4):17-8,20,22-4. doi:
10.1097/01.HJ.0000370856.73730.7e
2. Wilson C, Stephens D. Reasons for referral and attitudes toward hearing aids: do they affect outcome? Clin Otolaryngol Allied Sci. 2003;28(2):81-4. doi:
10.1046/j.1365-2273.2003.00669.x
3. Saunders GH, Cienkowski KM, Forsline A, Fausti S. Normative data for the attitudes towards loss of hearing questionnaire. J Am Acad Audiol. 2005;16(9):637-52. doi: 10.3766/jaaa.16.9.2
4. Hallam RS, Brooks DN. Development of the hearing attitudes in rehabilitation questionnaire (HARQ). Br J Audiol. 1996;30(3):199-213. doi:
10.3109/03005369609079040
5. Jacobson GP, Newman CW, Fabry DA, Sandridge SA. Development of the three-clinic hearing aid selection profile (HASP). J Am Acad Audiol. 2001;12(3):128-41. 6. Dillon H. The 2006 Libby Harricks memorial oration:
hearing loss: the silent epidemic. Who, why, impact and what can we do about it. ACT: Deafness Forum Limited; 2006.
7. Saunders GH, Cienkowski KM. Refinement and psy-chometric evaluation of the attitudes toward loss of hearing questionnaire. Ear Hear. 1996;17(6):505-19. 8. English K, Rojeski T, Branham K. Acquiring counseling
skills in mid-career: outcomes of a distance education course for practicing audiologists. J Am Acad Audiol. 2000;11(2):84-90.
9. Jo BH, Shin EY, Kim JS. [A study of validity for psychometric evaluation using attitude toward loss of hearing questionnaire (ALHQ) for the hearing imp-aired]. Audiol Speech Res. 2011;7(1):19-27. Korean. doi: 10.21848/audiol.2011.7.1.19
10. Bastos BG, Amorim RB, Ferrari DV. Attitudes towards hearing aids. Rev CEFAC. 2009;11(suppl 1):116-28. doi: 10.1590/S1516-18462009005000018
11. Aaronson NK, Acquadro C, Alonso J, Apolone G, Bucquet D, Bullinger M, et al. International quality of life assessment (IQOLA) project. Qual Life Res. 1992;1(5):349-51. doi: 10.1007/BF00434949
12. Humes LE, Wilson DL, Humes AC. Examination of differences between successful and unsuccessful elderly hearing aid candidates matched for age, hearing loss and gender. Int J Audiol. 2003;42(7):432-41. doi:
10.3109/14992020309080053
13. Erler SF, Garstecki DC. Hearing loss- and hearing aid-related stigma: perceptions of women with age-normal hearing. Am J Audiol. 2002;11(2):83-91. doi:
10.1044/1059-0889(2002/020)
14. Arlinger S. Negative consequences of uncorrected hearing loss--a review. Int J Audiol. 2003;42 Suppl 2:2S17-20. doi: 10.3109/14992020309074639
15. Goorabi K, Hosseinabadi R, Share H. Hearing aid effect on elderly depression in nursing home patients. Asia Pac J Speech Lang Hear. 2008;11(2):119-23. doi:
10.1179/136132808805297296
16. Erber NP. Use of hearing aids by older people: influence of non-auditory factors (vision, manual dexterity). Int J Audiol. 2003;42 Suppl 2:2S21-5. doi:
10.3109/14992020309074640
features--special signal processing for elderly users? Int J Audiol. 2003;42 Suppl 2:2S58-62. doi:
10.3109/14992020309074640
18. Kricos PB. The influence of nonaudiological variables on audiological rehabilitation outcomes. Ear Hear. 2000;21(4):7S-14S. doi: 10.1097/00003446-200008001-00003
19. Meyer C, Hickson L. What factors influence
help-seeking for hearing impairment and hearing aid adoption in older adults? Int J Audiol. 2012;51(2):66-74. doi:
10.3109/14992027.2011.611178
20. Hickson L, Meyer C, Lovelock K, Lampert M, Khan A. Factors associated with success with hearing aids in older adults. Int J Audiol. 2014;53 Suppl 1:S18-27. doi: