in the population sciences published by the Max Planck Institute for Demographic Research Konrad-Zuse Str. 1, D-18057 Rostock · GERMANY www.demographic-research.org
DEMOGRAPHIC RESEARCH
VOLUME 15, ARTICLE 20, PAGES 537-560
PUBLISHED 13 DECEMBER 2006
http://www.demographic-research.org/Volumes/Vol15/20/ DOI: 10.4054/DemRes.2006.15.20
Descriptive Finding
Trends in marital dissolution by women’s
education in the United States
Steven P. Martin
© 2006 Martin
This open-access work is published under the terms of the Creative Commons Attribution NonCommercial License 2.0 Germany, which permits use, reproduction & distribution in any medium for non-commercial purposes, provided the original author(s) and source are given credit.
2 Research objectives 539 2.1 Objective one: Confirm an educational divergence in
marital dissolution rates
539
2.2 Objective two: Distinguish trends by education from other demographic shifts
540
2.3 Objective three: Identify the time period over which divergence has occurred
541
3 Data and methods 541
3.1 Data 541
3.2 Analytic approach 544
4 Results 545
5 Conclusion 552
5.1 Confirming an educational divergence in marital dissolution rates 552 5.2 Distinguishing trends by education from other demographic shifts 553 5.3 Identifying the time period over which divergence has occurred 553
6 Acknowledgement 554
References 555
Trends in marital dissolution by women’s education
in the United States
Steven P. Martin 1
Abstract
I use the Survey of Income and Program Participation (N = 16,756) to measure trends in marital dissolution rates for U.S. women by education level. In marriage cohorts from the mid-1970s to the 1990s, marital dissolution rates fell among women with a 4-year college degree or more, but remained high among women with less than a 4-4-year college degree. This diverging trend began in the mid-1970s and is not explained by recent increases in women’s overall educational attainment, nor by recent increases in age at marriage timing and premarital childbearing. These results suggest a growing association between socioeconomic disadvantage and family instability.
1. Introduction
Class differences in marital dissolution rates are a cause for concern in a time of rising economic inequality. White and Rogers (2000) noted that both gendered and gender-neutral theories of marital dissolution predict that as economic inequality increases, so should the class gap in marital dissolution rates. Regardless of their origin, however, growing class differences in marital dissolution rates would exacerbate some effects of socioeconomic inequality and perpetuate inequality across generations, to the extent that marital dissolutions contribute to deficits in adult outcomes as well as deficits in children’s physical and emotional health, educational attainment and performance (Amato 2000; Hetherington and Stanley-Hagan 1997; McLanahan and Bumpass 1988). Whereas a slight decline in marital dissolution rates since the late 1970s (Goldstein 1999; Schoen and Standish 2001) is good news, this good news is tempered if the overall trend reflects a sharp decline to highly educated women exclusively, rather than a broad decline among all groups of women.
Results from several recent studies suggest a divergence in marital dissolution rates by women’s educational attainment. Raley and Bumpass (2003) examined first marriage dissolution rates and union dissolution rates for women in the 1995 National Survey of Family Growth (NSFG). They found an education-by-trend interaction consistent with an educational divergence, although the interaction was statistically significant for only two of several comparisons across educational groups, at p<.10. Sweeney and Phillips (2004) found a similar pattern using the June 1985, 1990, and 1995 Current Population Surveys, as did Martin and Bumpass (1989) using earlier versions of the NSFG, but neither study tested education-by-trend interactions for statistical significance. Elwood and Jencks (2004) also found educational divergence in the prevalence of divorced or separated mothers as a percent of all mothers in the 2000 Census 1% Public Use Micro Sample (PUMS). Of course, trends in divorced or separated mothers as a percent of all mothers reflect demographic trends in marriage, remarriage, and childbearing as well as trends in marital dissolution.
paper attempts to reduce the uncertainty that still exists about trends in marital dissolution by women’s education by examining whether educational divergence is truly occurring, and if so, how much is occurring, and when the divergence began. I outline three objectives below:
2. Research objectives
2.1 Objective one: Confirm an educational divergence in marital dissolution rates
An observed trend of declining marital dissolution rates for highly educated women and stable or rising rates for less educated women could be (at least in part) a spurious result of the way education is measured. Elwood and Jencks (2004) and others have noted that shifts in marital dissolution rates at a given education level might simply reflect changes in the educational distribution rather than changes in the relationship between education and marital dissolution. One way to correct for this problem is to assign percentile ranks to education categories, and then to derive approximate quantiles for the education. An example would be to measure marital dissolution rates for the top third, middle third, and bottom third of the education distribution. However, Ellwood and Jencks also noted that each education level should be affected in the same direction, so that shifts in educational attainment should have little effect on the coefficients for differences between education categories (see Ellwood and Jencks 2004). In this paper, I focus on the increasing differences between educational categories rather than the trend for each separate category.
A final concern is that evidence for divergence in marital dissolution rates might show up in some data sets but not in others. In the appendix, I summarize trends in marital dissolution rates from other commonly used surveys.
2.2 Objective two: Distinguish trends by education from other demographic shifts
In recent decades there have been at least four shifts in demographic patterns of marriage and of educational attainment that have the potential to confound (or explain) a divergence in marital dissolution rates by women’s educational attainment. One of these is later age at marriage, which is a powerful predictor of low marital dissolution rates (Booth and Edwards 1985; Moore and Waite 1981) and has been cited as a primary reason for the overall decline in marital dissolution rates since 1980 (Heaton 2002). If highly educated women are delaying marriage more than other women, this trend might explain why highly educated women’s marital dissolution rates are declining while rates for less-educated women are not.
Another pronounced shift in marriage that affects marital dissolution rates is an increase in the incidence of premarital births. Among women with lower educational attainment, first marriages are increasingly likely to follow a nonmarital birth (Upchurch, Lillard and Panis 2001). This trend might explain why less-educated women’s marital dissolution rates remain high while rates for highly educated women are declining.
A third demographic factor correlated with educational attainment is race; Sweeney and Phillips (2004) have documented diverging racial trends in marital dissolution rates that could be conflated with educational trends in the absence of appropriate statistical controls.
2.3 Objective three: Identify the time period over which divergence has occurred
Although a causal analysis of why marital dissolution might be diverging by women’s educational attainment is beyond the scope of this paper, confirmation of educational divergence in marital dissolution rates within a specific time period would encourage future exploration of economic, cultural, and ideological factors particularly salient in that time period. For example, both marital dissolution rates and women’s labor force participation rates were rapidly increasing in the 1960s and 1970s, so interest naturally focused on gendered theories of marital dissolution. After the mid-1970s, educational differences in women’s labor force involvement changed less (c.f. Blau 1998), whereas other factors became more salient. One of these new factors is income inequality between educational groups (McCall 2000; Morris and Western 1999), but many other factors have changed as well, including social awareness of the negative consequences of divorce (Waite and Gallagher 2000), family policies (Bogensheider 2000) and a cooling of some liberal attitudes about the family (Blankenhorn 2002).
In this paper, I analyze trends in marital dissolution rates for U.S. women entering a first marriage from 1975 to 1994 and compare patterns for women of different educational attainment. To do this, I measure education by educational percentile, by educational attainment at interview, and with a time-varying measure of educational attainment during a woman’s first marriage. I use a multivariate analysis to identify any portion of an educational divergence in marital dissolution rates that might be attributed to recent changes in age at marriage, prevalence in premarital childbearing, or diverging marital dissolution rates across racial groups of women. Finally, I use supplemental information on earlier marriage cohorts to evaluate whether educational divergence started with the mid-1970s marriage cohorts or at some earlier time.
3. Data and methods
3.1 Data
fewer marital dissolutions than women, particularly at recall durations more than fifteen and fewer than three years. Finally, I limit this analysis to first marriages, due to space constraints. Analyses of trends in second marriages, for men, and for foreign-born women are available on request.
The Wave 2 Topical Modules of the SIPP contain event histories for respondents’ first, second, and most recent marriages, as well as a retrospective education history. For marital dissolutions, the SIPP marital histories identify dates of permanent separation as well as divorce (termination). The SIPP provides fewer explanatory variables than the National Survey of Family Growth (NSFG) or the Panel Study of Income Dynamics (PSID), but these alternate data sources have a much smaller effective sample size. The SIPP is the largest survey with an education history that can be matched to a marital history. The fact that this information is available in Wave 2 alleviates some concerns about sampling attrition in subsequent waves of the SIPP. For comparison, the appendix includes summary statistics on marital dissolution rates and trends from the NSFG, PSID, and the marital and fertility history supplements of the Current Population Survey (CPS).
The outcome variable in this analysis is whether a woman reports a permanent separation (including but not limited to divorce) within ten years of first marriage. Women who do not report a permanent separation within ten years of a first marriage are censored from the analysis at the ten-year point. Because a few women who report a recent but permanent separation at the time of the survey subsequently reconcile those marriages Martin and Bumpass (1989) recommend censoring marital dissolution histories 12 months before interview. I do not use this correction because it can introduce systematic bias in life table estimates for data sets (like the SIPP) that report outcomes on an annual rather than monthly basis. Censoring all marital histories at the first or second year before interview, or counting only divorce as a marital dissolution, does not alter the main findings of this study. Findings from Raley and Bumpass (2003) suggest that education*trend patterns in union dissolution (including cohabiting unions with marriages) are not dissimilar from education*trend patterns in marital dissolution, but the SIPP does not include a cohabitation history to confirm this finding.
multivariate analyses, I treat educational attainment as a fully time-varying covariate for all women, so that a woman’s yearly risk of marital dissolution is estimated based on her educational attainment in that specific year. The SIPP education history makes this time-varying specification possible. In the multivariate analysis I also control for age at first marriage, whether a first marriage was preceded by a premarital birth, and race or ethnic group.
A significant concern in this analysis is the potential for response error in the retrospective reports of the marital and education histories. Response error can be correlated with both educational attainment and duration of retrospection, the main coefficients under investigation in this study. I checked the results from the SIPP using descriptive life tables from the marital histories of all six cycles of the NSFG from 1973 to 2002; the Panel Study of Income Dynamics (PSID) from 1969 to 2001; and the June Current Population Survey (CPS) marriage and fertility supplements for June 1985, 1990, and 1995. All surveys showed trends consistent with those from the SIPP. The educational divergence since 1975 was less pronounced in the NSFG and PSID than in the SIPP, and slightly more pronounced in the CPS. I also checked for possible correlations between response duration and survey error by comparing SIPP 1996 and SIPP 2001 reports for the same marriage cohorts at different recall durations, and I found no systematic variation of marital dissolution patterns by response duration.
3.2 Analytic approach
In the descriptive analysis, I analyze trends in marital dissolutions for first marriages from 1975 to 1994 using SIPP data and employing a Kaplan-Meier life table procedure to identify the outcome of a marital dissolution within 10 years of a first marriage. I then summarize results from marriage cohorts of the SIPP dating back to 1960 to make a rough estimate of the time when marital dissolution rates began to diverge by educational attainment.
In the multivariate part of the analysis, I measure coefficients for educational attainment on the yearly hazard of a marital dissolution. The objective of the multivariate analysis is to find out whether trends in marital dissolution rates by women’s educational attainment might be parsimoniously explained by other demographic variables known to partly explain trends in marital dissolution rates. To control for the possibility that educational trends in marital dissolution rates might inappropriately reflect shifts in the proportion of women who complete their education after marriage (or even after a marital dissolution), I use the time-varying measure of educational attainment in the multivariate analysis rather than education at interview. I employ Cox proportional hazard models to control for marital duration and censor all observations after 10 years of a first marriage (For a review of event history models, see Cox and Oakes 1984).
The Cox proportional hazard models identify the coefficient for each covariate on the yearly rate or hazard of a marital dissolution. I specify the yearly hazard h(t) as a function of respondent characteristics for age and race (xi), age at marriage and
incidence of a premarital first birth (xj), year of first marriage (y), and duration since
marriage (ti) as represented below:
Model 1: Log h(t) = β0 + βixi + βy + βxiy + γ(t).
Model 2: Log h(t) = β0 + βixi + βy + βxiy + γ(t) + βjxj.
For the term y representing the year of first marriage, year 1975 is rescaled to 0, and the term xiy captures the interaction between year of marriage and each of the
The second model adds the series of dichotomous controls for age at marriage and incidence of a premarital birth. In sensitivity analyses, the year*age at marriage coefficients did not increase the model fit enough to justify inclusion in the main models (results available on request). The main findings of this analysis were robust with respect to this and other alternative model specifications.
The models shown in this paper use only a single duration dependency coefficient and only one time span – ten years. There are several possible ways that the hazard of a marital dissolution might not be proportional with respect to duration, and other studies have found some evidence for such dependency (c.f. South 2001). Some possible interactions include year of marriage*duration, age at marriage*duration, and education level*duration. Various sensitivity analyses with different controls for nonproportional hazards did not affect the substantive results. Also, alternative models with 5-year durations, 15-year durations, and open-ended durations did not affect the substantive results. In any case, the reader should be cautioned that the coefficients from these models reflect group differences that are averaged across the first ten years of marriage.
4. Results
Table 1: Women with a marital dissolution within ten years of a first marriage, as a percent of all women entering a first marriage: Cohort life table estimates by education percentile, education level, and timing of 4-year degree relative to marriage
Year of First Marriage
1975-79 1980-84 1985-89 1990-94 Trend
A B C D D – A
n = 4,255 n = 4,381 n = 4,208 n = 3,912
All First Marriages 34.8 31.9 30.1 31.2 - 3.6**
By Education Percentile
Lowest 33 1/3 % 35.6 34.7 35.2 39.9 + 4.3*
Middle 33 1/3 % 37.9 35.8 34.3 35.8 - 2.1
Top 33 1/3 % 30.9 25.1 20.9 18.1 - 12.8**
By Education Level
No High School Diploma 38.3 42.2 41.5 46.3 + 8.0
High School Diploma 34.7 32.1 33.3 37.9 + 3.2
Some College 38.9 36.8 34.4 36.0 - 2.9
4-Year College Degree 29.0 20.1 18.7 16.5 - 12.5**
Master’s or Professional Degree 25.1 20.9 17.6 14.4 - 10.7**
By Timing of 4-Year Degree
Before Marriage 18.9 15.7 15.5 14.0 - 4.9*
<10 Years After Marriage 41.3 28.0 27.4 25.3 - 16.0**
10+ Years After Marriage 39.3 39.7 37.3 - - - - - -
No 4-Year Degree 37.0 35.4 34.7 37.9 + 0.9
Notes: Source: 1996 – 2001 SIPP. Sample excludes women born outside U.S. ** p < .01, * p < .05 for t-tests comparing 1975-79
and 1990-94 life-table estimates.
Table 1 shows life table estimates for the proportions of U.S. women with a marital dissolution within ten years of first marriage for five-year marriage cohorts from 1975-79 to 1990-1994. An additional column compares the proportions experiencing a marital dissolution in the 1975-79 and 1990-1994 marriage cohorts, along with statistical significance levels from a simple t-test for the difference between the proportions.
women who finished a college degree after marriage had divorce rates similar to women with no college degree, rather than to women who received a college degree before marriage. Finally, women who complete their four-year college degree more than ten years after marriage have marital dissolution rates comparable to women with no college degree. For these women (who are most numerous in the marriage cohorts with the longest recall durations), educational attainment at interview is clearly not a good predictor of marital dissolution rates.
Table 2: Covariates used in the Cox proportional hazard analysis of the risk of a marital dissolution: Descriptive statistics (N = 16,756)
Overall Sample
1975-79 Marriage Cohort
1990-94 Marriage Cohort
M M M
Year of First Marriage 1984.4 1977.0 1992.0
Education at marriage
No High School Diploma .16 .18 .12
High School Diploma .39 .43 .35
Some College .26 .25 .28
4-Year College Degree .16 .13 .21
Master’s or Professional Degree .03 .01 .04
Education at censoring
No High School Diploma .09 .11 .08
High School Diploma .35 .42 .29
Some College .31 .27 .34
4-Year College Degree or More .18 .16 .22
Master’s or Professional Degree .06 .05 .07
Nonhispanic White .82 .84 .80
Nonhispanic Black .10 .10 .10
Hispanic .06 .04 .08
Nonhispanic, Other Race .02 .02 .02
Age at First Marriage < 19 .13 .18 .08
Age at First Marriage 19 – 21 .29 .39 .21
Age at First Marriage 22 – 24 .25 .25 .24
Age at First Marriage 25 - 27 .15 .10 .18
Age at First Marriage 28 – 30 .08 .04 .12
Age at First Marriage >30 .10 .04 .16
Premarital First Birth .16 .11 .21
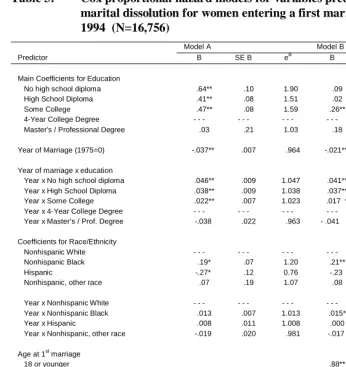
Table 3: Cox proportional hazard models for variables predicting the rate of marital dissolution for women entering a first marriage from 1975 to 1994 (N=16,756)
Model A Model B
Predictor B SE B eB B SE B eB
Main Coefficients for Education
No high school diploma .64** .10 1.90 .09 .10 1.09
High School Diploma .41** .08 1.51 .02 .09 1.02
Some College .47** .08 1.59 .26** .08 1.29
4-Year College Degree - - - - - - - - - - - - - - - - - -
Master’s / Professional Degree .03 .21 1.03 .18 .21 1.20
Year of Marriage (1975=0) -.037** .007 .964 -.021** .007 .979
Year of marriage x education
Year x No high school diploma .046** .009 1.047 .041** .009 1.045
Year x High School Diploma .038** .009 1.038 .037** .008 1.040
Year x Some College .022** .007 1.023 .017 * .007 1.017
Year x 4-Year College Degree - - - - - - - - - - - - - - - - - -
Year x Master’s / Prof. Degree -.038 .022 .963 - .041 . .021 .960
Coefficients for Race/Ethnicity
Nonhispanic White - - - - - - - - - - - - - - - - - -
Nonhispanic Black .19* .07 1.20 .21** .07 1.23
Hispanic -.27* .12 0.76 -.23 .12 0.79
Nonhispanic, other race .07 .19 1.07 .08 .19 1.08
Year x Nonhispanic White - - - - - - - - - - - - - - - - - -
Year x Nonhispanic Black .013 .007 1.013 .015* .007 1.015
Year x Hispanic .008 .011 1.008 .000 .011 1.000
Year x Nonhispanic, other race -.019 .020 .981 -.017 .020 .984
Age at 1stmarriage
18 or younger .88** .05 2.42
19 to 21 .47** .04 1.59
22 to 24 - - - - - - - - -
25 to 27 -.22** .06 0.80
28 to 30 -.24** .07 0.79
31 or older -.50** .07 0.61
Premarital 1st birth .35** .04 1.41
-LL 49531.2 46178.2
Df 15 21
Notes: Source: 1996 – 2001 SIPP. Sample excludes women born outside U.S.
Educational attainment is measured as a time-varying covariate.
eB = proportional increase in event rate associated with a 1-unit increase in x.
The reference category is Nonhispanic White women with a 4-year college degree, age 22-24 at marriage, with no premarital birth, married in 1975.
Table 3 shows results from the multivariate analysis. Model A includes covariates for educational attainment, race, year of marriage, interactions between year of marriage and educational attainment and interactions between year of marriage and race. Education was already a strong predictor of marital dissolution for first marriages as of 1975, as shown by the main coefficients for education. For example, compared to the comparison category of women with a four-year college degree, women with no high school diploma had a marital dissolution rate exp(1.67) or 1.95 times as high, controlling for race. The coefficient for year of marriage shows that for the (omitted) category of women with a four-year college degree, marital dissolution rates declined across year of marriage by a factor of exp(-.038) or .963 each year. For women with no high school diploma, the interaction term for year of marriage*no high school diploma indicates that marital dissolution rates increased across year of marriage by a factor of exp(.048) or 1.049 each year, relative to the (declining) baseline trend for women with a four-year college degree.
Model B adds covariates for age at marriage and incidence of a premarital birth. When these variables are added to the model, the main coefficients for education are no longer statistically significant, indicating that for marriages around 1975, much of the difference in marital dissolution rates across educational levels was explained by the fact that highly educated women married at older ages than less educated women. Similarly, the negative coefficient for year of marriage is smaller in Model B than in Model A, indicating that for the comparison group of women with a four-year college degree, some part of the decline in marital dissolution rates over time is explained by increasing age at marriage for college-educated women. However, the coefficients for interactions between year of marriage and educational attainment are just as pronounced in Model B as in Model A. In other words, marriage timing can partly explain differences in marital dissolution rates across education levels, as well as overall trends across marriage cohorts, but cannot explain the differences in trends that constitute the educational divergence in marital dissolution rates.
To illustrate this point, I have used the coefficients from Model B in Table 3 to predict relative marital dissolution rates for women of different education levels who entered a first marriage in 1975 and 1990, respectively. Table 4 shows the result of this computational exercise. Compared to the descriptive results in Table 1, the results in Table 4 show a shallower decline in marital dissolution rates for college graduates, but a steeper rise in marital dissolution rates for women of lower educational attainment.
Table 4: Relative rates of marital disruption during the 10 years following a first marriage, controlling for race, age at marriage, and premarital births. By women’s education
Estimate for Marriage Year 1975
Estimate for Marriage Year 1990
Education Level
No High School Diploma 1.11 1.55
High School Diploma 1.09 1.33
Some College 1.14 1.17
4-Year College Degree 1.00 .68
Master’s or Professional Degree 1.15 .47
Notes: Based on estimated parameters from Table 3, Model B, with controls for marital duration, race and ethnicity, age at marriage, and incidence of a premarital first birth.
The comparison category is women with a four-year college degree, married in 1975. Source: 1996 – 2001 SIPP. Sample excludes women born outside U.S.
Figure 1: Women with a marital dissolution within ten years of a first marriage, as a percent of all women entering a first marriage: Life table estimates by education level (N = 28,067)
Note: Source: 1996 – 2001 SIPP. Sample excludes women born outside U.S.
5. Conclusion
5.1 Confirming an educational divergence in marital dissolution rates
The results show that marital dissolution rates have indeed been diverging by women’s educational attainment. Furthermore, little or none of the trend within each educational level is explained as a result of overall increases in educational attainment.
Across marriage cohorts, women became somewhat less likely to complete their education after they married, a pattern that could explain some of the observed decline
0
10
20
30
40
50
1960-64
1965-69
1970-74
1975-79
1980-84
1985-89
1990-94
year of 1st marriage
p
e
rcen
t
no high school diploma
in marital dissolution rates for highly educated women. However, patterns indicating an educational divergence in marital dissolution rates remain robust and strongly statistically significant in event history models that use a time-varying measure of education to control for changes in the timing of education relative to marriage. Descriptive statistics show the greatest declines in marital dissolution among college graduate women whose completion of a college degree came after their first marriage. Instead of explaining away a spurious trend in marital dissolution rates, the time-varying specification of education effectively captures a real trend.
5.2 Distinguishing trends by education from other demographic shifts
Results from Tables 3 and 4 show that the increasing educational divergence in marital dissolution rates after the 1975 marriage cohort appears to be independent of changes in age at marriage, increasing incidence of premarital first births among less-educated women, or shifting racial patterns of marital dissolution. The use of statistical controls for age at marriage and premarital childbearing leads to a potentially troubling interpretation of recent trends in marital dissolution rates. For groups of women with less than a four-year college degree, observed marital dissolution rates are steady or only slightly increasing. However, net of demographic controls (chiefly for age at marriage), marital dissolution rates for less educated women are clearly rising; their marriages are becoming more unstable even as marriages become more stable for highly educated women.
5.3 Identifying the time period over which divergence has occurred
Results from Figure 1 suggest that prior to the 1975 marriage cohort, educational differences in marital dissolution rates were large but not increasing. This pattern may explain part of the discrepancy between longer-term analyses that found little or no education-by-trend interaction in marital dissolution rates (Teachman 2002; South 2001) and shorter-term analyses that found an education-by-trend interaction (Sweeney and Phillips 2004; Raley and Bumpass 2003). However, the studies differ in other respects, such as the use of statistical controls for husband characteristics, specification of age at marriage, and specification of marital duration.
education and marital dissolution is emerging; a relationship quite different from that which existed up to the mid-1970s.
6. Acknowledgement
References
Amato, P. R. 2000. The consequences of divorce for adults and children. Journal of Marriage and the Family, 62, 1269-1287.
Blankenhorn, D. 2002. The reappearing nuclear family. First Things, January 2002, 20-23.
Blau, F. D. 1998. Trends in the well-being of American women, 1970-1995. Journal of Economic Literature, 36, 112-165.
Bogenscheider, K. 2000. Has family policy come of age? A decade review of the state of U.S. family policy in the 1990s. Journal of Marriage and the Family, 62, 1136-1159.
Booth, A., & Edwards, J. 1985. Age at marriage and marital instability. Journal of Marriage and the Family, 47, 67-75.
Cox, D.R. & Oakes, D. 1984. Analysis of Survival Data. London: Chapman and Hall.
Ellwood, D. T., & Jencks, C. 2004. The uneven spread of single-parent families: What do we know? Where do we look for answers?” In K.M. Neckerman (Ed.), Social Inequality (pp. 3 – 78). New York: Russell Sage Foundation.
Goldstein, J. R. 1999. The leveling of divorce in the United States. Demography, 36, 409-414.
Heaton, T. B. 2002. Factors contributing to increasing marital stability in the United States. Journal of Family Issues, 23, 392-409.
Hetherington, E.M., & Stanley-Hagan, M. M. 1997. The effects of divorce on fathers and their children. In M.E. Lamb (Ed.), The Role of the Father in Child Development, Third Edition (pp. 191 - 211, 361 – 369). New York: Wiley.
Martin, T. C., & Bumpass, L. 1989. Recent trends in marital disruption. Demography, 26, 37 - 51.
McCall, L. 2000. Gender and the new inequality: Explaining the college/non-college wage gap. American Sociological Review, 65, 234 - 255.
McLanahan, S., & Bumpass, L. L. 1988. Intergenerational consequences of marital disruption. American Journal of Sociology, 94, 130 - 152.
Morris, M., & Western, B. 1999. Inequality in earnings at the close of the 20th Century. Annual Review of Sociology, 25, 623 - 657.
Raley, R. K., & Bumpass, L. 2003. The topography of the divorce plateau: Levels and trends in union stability in the United States after 1980. Demographic Research, 8, 245 - 259.
Rogers, S. J. 1999. Wives income and marital quality: Are there reciprocal effects?” Journal of Marriage and the Family, 61, 123 - 132.
Schoen, R., & Standish, N. 2001. The retrenchment of marriage: Results from marital status life tables for the United States, 1995. Population and Development Review, 27, 553 - 563.
Schwartz, C.R. and Mare, R.D. 2005. Trends in Educational Assortative Marriage from 1940 to2003. Demography, 42(4): 621-646.
South, S. J. 2001. Time-dependent effects of wives’ employment on marital dissolution. American Sociological Review, 66, 226-245.
Sweeney, M. M. & Phillips., J. A. 2004. Understanding racial differences in marital disruption: Recent trends and explanations. Journal of Marriage and Family, 66, 639 - 650.
Teachman, J. D. 2002. Stability across cohorts in divorce risk factors. Demography, 39, 331 - 351.
Upchurch, D. M., Lillard, L. A., & Panis, C. W. A. 2001. The impact of nonmarital childbearing on subsequent marital formation and dissolution. In L. L. Wu & B. Wolfe (Eds.), Out of wedlock: Causes and consequences of nonmarital fertility (pp. 344 – 380). New York: Russell Sage Foundation.
U.S. Census Bureau. 2001. Survey of Income and Program Participation user’s guide, Third Edition. Washington, D.C.: U.S. Census Bureau.
Waite, L., & Gallagher., M. 2000. The case for marriage. New York: Doubleday.
Appendix
Comparison of results from the SIPP with results from other data sources
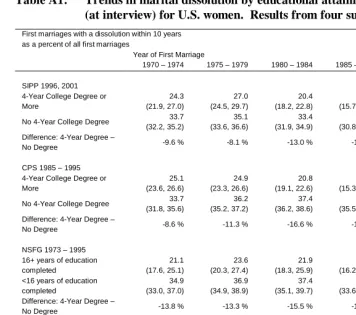
Table A1 shows that marital dissolution patterns reported in the SIPP are mostly consistent with patterns reported in other commonly used data sources, in terms of overall levels, trends, educational differences, and divergence by education level. However, the uncertainty in the estimates is quite large for each data set, and the various data sets each have their own concerns about data quality.
The NSFG has two concerns worth mentioning. One is that the sampling frame of the survey (age 15 – 44) results in an average interview age of about 30. This means that most marriages are censored by an interview before 10 years of duration, and many more marriages are excluded from the sample altogether. Hence, the results from the NSFG series should be thought of as skewed toward marriages entered at younger ages, with potentially confounding effects for both educational differences and trend estimates. The second concern is a possible problem with the administration of the 2002 NSFG that resulted in imputed data for many women who reported a first marital dissolution. I included data from the 2002 NSFG only for estimates for the 1990 – 1994 marriage cohort, and results for this cohort should be interpreted with caution.
Table A1: Trends in marital dissolution by educational attainment
(at interview) for U.S. women. Results from four survey data sets
First marriages with a dissolution within 10 years as a percent of all first marriages
Year of First Marriage
1970 – 1974 1975 – 1979 1980 – 1984 1985 – 1989 1990 – 1994
SIPP 1996, 2001 4-Year College Degree or More 24.3 (21.9, 27.0) 27.0 (24.5, 29.7) 20.4 (18.2, 22.8) 17.7 (15.7, 19.9) 16.7 (14.0, 19.8)
No 4-Year College Degree 33.7
(32.2, 35.2) 35.1 (33.6, 36.6) 33.4 (31.9, 34.9) 32.3 (30.8, 33.9) 35.7 (33.5, 38.0) Difference: 4-Year Degree –
No Degree -9.6 % -8.1 % -13.0 % -14.6 % -19.0 %
CPS 1985 – 1995 4-Year College Degree or More 25.1 (23.6, 26.6) 24.9 (23.3, 26.6) 20.8 (19.1, 22.6) 18.2 (15.3, 21.5)
No 4-Year College Degree 33.7
(31.8, 35.6) 36.2 (35.2, 37.2) 37.4 (36.2, 38.6) 37.4 (35.5, 39.4) Difference: 4-Year Degree –
No Degree -8.6 % -11.3 % -16.6 % -19.2 %
NSFG 1973 – 1995 + NSFG 2002
16+ years of education completed 21.1 (17.6, 25.1) 23.6 (20.3, 27.4) 21.9 (18.3, 25.9) 21.1 (16.2, 27.0) 19.0 (16.2, 27.0) <16 years of education
completed 34.9 (33.0, 37.0) 36.9 (34.9, 38.9) 37.4 (35.1, 39.7) 37.0 (33.6, 40.6) 36.8 (33.6, 40.6) Difference: 4-Year Degree –
No Degree -13.8 % -13.3 % -15.5 % -15.9 % -17.8 %
PSID 1969 – 2001
4-Year College Degree or More 11.5 (5.6, 17.4) 22.4 (16.9, 27.9) 24.6 (18.8, 29.4) 13.9 (8.5, 19.3) 18.5 (10.9, 26.1)
No 4-Year College Degree 31.0
(28.4, 33.6) 29.8 (27.2, 32.4) 35.6 (33.0, 38.2) 32.8 (29.4, 36.2) 34.0 (29.0, 39.0) Difference: 4-Year Degree –
No Degree -18.5 % -7.4 % -11.0 % -18.9 % -15.5 %
Sources: Survey of Income and Program Participation 1996 and 2001 combined data file.
Current Population Survey June 1985, June 1990, and June 1995 combined data file.
National Survey of Family Growth 1973, 1976, 1982, 1988, 1995 combined data file for marriages from 1970 to 1989. National Survey of Family Growth 1995, 2002 combined data file for marriages from 1990 to 1994.
Panel Study of Income Dynamics 1969 – 2001.
Notes: Results are weighted.
Cohort life table estimates control for marriages censored before 10 years.
Table A2 shows the sample size for each cohort and educational group at the time of marriage. The most recent cohorts, and all cohorts in the NSFG data, have much smaller effective sample sizes than the sample sizes shown, because of censoring at marital durations earlier than 10 years.
Table A2: Sample sizes for the data sets in table A1, by marriage cohort and education level
Year of First Marriage
1970 – 1974 1975 – 1979 1980 – 1984 1985 – 1989 1990 – 1994
SIPP 1996, 2001
4-Year College Degree or
More 1229
1093
1188 1332 1258
No 4-Year College Degree 3903 3828 3990 3738 3500
CPS 1985 – 1995
4-Year College Degree or
More 3170 2842 3212 2225
No 4-Year College Degree 11290 10573 10630 6273
NSFG 1973 – 1995 + NSFG 2002
16+ years of education
completed 829 689 636 450 266
<16 years of education
completed 4534 2885 2350 1453 734
PSID 1969 – 2001
4-Year College Degree or
More 179 206 210 217 219