--- ---
*Corresponding author (): [email protected] Received: 28 June 2015/ Revised: 12 April 2016 Accepted: 16 May 2016
Genetic variation and association analysis of some important traits related to grain
in rice (
Oryza
sativa
L.) germplasm
and
3
Akbar Ebadi
-, Ali
2
Khorramabad
-Shirzadian
, Reza
1
Mohammad Alizadeh
,
*
1
Ali Aalami
1
Heydar Azizi
Department of Agronomy and Plant Breeding, Faculty of Agricultural Sciences, University of Guilan, Rasht, Iran 1
Department of Biotechnology, Faculty of Agricultural Sciences, University of Guilan, Rasht, Iran 2
Rice Research Institute of Iran, Rasht, Iran 3
ABSTRACT
:
The identification of genomic loci involved in control of quantitative traits receives growing attention inplant molecular breeding. The present study was carried out to evaluate the genetic variability among 48 rice genotypes and determine the genomic regions associated with ten grain related important traits. A total number of 63 alleles were detected by 18 selected SSR markers from different chromosomes with an average of 3.5 alleles per marker. A model-based Bayesian approach subdivided 48 evaluated rice genotypes into three major subgroups with the consideration of the highest value of
ΔK. The mean r2 value for all loci pairs on the same chromosome was 0.053. A total of 38 significant marker-trait associations were identified (P< 0.05) that explaining more than 32% of the total variation. RM315, RM3428, RM289, RM16, RM574 and RM156 markers had highest R2 and most association with assayed traits, respectively. The findings of this study revealed association of grain properties in rice with some SSR markers that could serve as target genomic regions for further research such as MAS, fine mapping and candidate gene discovery in rice breeding programs.
KEYWORDS
:
Association analysis, Linkage disequilibrium, Rice, SSR.INTRODUCTION
Molecular plant breeding has revolutionized conventional breeding techniques in all areas within the last 20 years. Identification of tightly linked markers is necessary for the successful exploiting of DNA markers technology in different breeding programs (1). Various DNA marker systems (such as RFLP, RAPD and AFLP) with different characterizations have closely tracked developments in molecular biology (14). SSR markers, due to having relatively most of characteristics of an ideal molecular marker such as high polymorphism, random genome
analysis (5, 19, 20). Moreover, QTLs and molecular markers detected in the inbred lines and elite germplasm can be used directly in breeding programs.This approach has been used in several plant species, including maize (18), barley (17), hexaploid wheat (10), sorghum(13) and lettuce (15). Considering rice as a model species with relatively small genome size (~430 Mb), and also with high level of genetic variation due to recombination events with cultivation antecedent about 7,000 years (22, 26), therefore association mapping is a feasible and potentially very useful technique for rice germplasm. This study attempts to establish associations of SSR markers withsome of assayed grain related important traits of rice. Outcome of this study could be helpfulin identification of genes responsible for these traits, which can further be utilized in marker-assisted selection for the development of superior varieties in different rice breeding programs.
MATERIALS AND METHODS
Plant materials
Forty-eight rice varieties including 24 landraces, 15 Iranian breeding lines, and 9 introduced lines were used in this study (Table 1).The varieties originated from different regions of Iran and other parts of the world, which were kindly provided by the Rice Research Institute of Iran (RRII), Rasht, Iran and International Rice Research Institute (IRRI), and have been widely used as parents in rice breeding programs during past decades.
Field trials and phenotyping
For field studies, each rice variety was sown in the research field of Rice Research Institute of Iran (RRII) (Rasht) using a randomized block design. For all varieties, 30-days-old seedlings were transplanted into the field at a spacing of 15cm between plants within each row and 30 cm between the rows. The middle five plants in the central row of each plot were collected and bulked in order to examine the agronomic traits. Ten grain related traits including grain length and width (mm), lemma length and width (mm), palea length and width (mm), awn length (mm), hectoliter weight (test weight) (gr/cm3), percentage of grain protein (%) and percentage of grain fissure (%) were evaluated. All studied traits were obtained from three replicates and for each trait, the means of the replicates were used in data analysis.
Table 1. Name and origin of studied rice varieties
Origin Variety
No
Iran Musa Tarom
1
Hassani 2
Dom Sorkh 3
Gharibsiah Reyhani 4
Ali Kazemi 5
Sange Tarom 6
Tarom Mohali 7
Sadri 8
Binam 9
Sangjo 10
Hashemi 11
Shahpasand 12
Dom Syah 13
Dom Sefid 14
Salari 15
Gharib 16
Zireh 17
Reyhani 18
Ghashangeh 19
Abjibuji 20
Gardeh 21
Tarom Amiri 22
Anbarbu 23
Mohammadi Chaparsar 24
Iran (IL) Dorfak
25
Bejar 26
Nemat 27
Neda 28
Dasht 29
Amol 1 30
Amol 2 31
Amol 3 32
Khazar 33
Gil 1 34
Gil 3 35
Line 213 36
Sepidrud 37
Line 507 38
Line 4 39
Philippines IR28
40
IR30 41
IR36 42
IR50 43
IR58 44
IR60 45
IR60 46
Tetep 47
Fujiminuri 48
SSR genotyping
In total, 18 SSR primer pairs located on different chromosomes were selected for population structure analysis (Table2) (http://www.gramene.org/). Amplificat-ion was carried out in an Astec Bio PCR System in a total volume of 10 μl, containing 50 ng of gDNA, 1X PCR buffer, 2.4 mM MgCl2, 0.2 mM of each dNTP, 1U of Taq DNA polymerase (Cinnagen Co., Iran), and 0.4 µM primer. The PCR profile composed of an initial denaturation at 94
°C for 3 min followed by 10 cycles of 94 °C for 30s (denaturing), 65 °C for 30s (annealing), and 72 °C for 1 min (extension), with 26 subsequent cycles of 94 °C for 30s
(denaturing), 55 °C for 30s (annealing), and 72 °C for 1 min with 26 subsequent cycles of 94 °C for 30s 55 °C for 30s (annealing), and 72 °C for 1 min (extension) and a final extension of 72 °C for 5 min. The PCR products were detected using the optimized silver staining method in denaturing polyacrylamide gels (6).
Data analysis
Summary statistics for the allele diversity of 18 SSR markers in 48 varieties were calculated using the PowerMarker V3.25 program (9), these included allele number, gene diversity (Dl), and polymorphism
Table 2. Characteristics of used SSR markers.
PIC Gene diversity
Allele number Chromosome No.
Primer sequence Motif
Primer
0.46 0.51
3 3
cagaggaagcaaggagatcg ccatcgggagaaagagag (CCT)9
RM6080
0.39 0.42
5 1
gaggtacttcctccgtttcac agtcagctcactgtgcagtg (AT)4(GT)10
RM315
0.41 0.45
4 9
ccggtcagttcaagctctg acgtacggacgtgacgac (GA)7G6(GA)7
RM288
0.34 0.37
4 5
ttccatggcacacaagcc ctgtgcacgaacttccaaag G11(GA)16
RM289
0.54 0.61
4 9
ctcgtttattacctacagtacc ctacctcctttctagaccgata (CT)17
RM201
0.42 0.47
4 4
ctacttctccccttgtgtcg tgtaccatcgccaaatctcc C9(CT)8
RM261
0.33 0.34
5 2
gggaggagaggcaagcggagag atgacttgatcccgagaacg (GAA)5
RM112
0.36 0.43
2 4
ttcgctgacgtgataggttg atgacttgatcccgagaacg (CT)19
RM252
0.44 0.49
3 3
cgctagggcagcatctaaa aacacagcaggtacgcgc (TCG)5(GA)16
RM16
0.43 0.47
4 6
ctttgtctatctcaagacac ttgcagatgttcttcctgatg (CT)11
RM190
0.35 0.36
3 3
tggagactgagctgatgcc tcaggtggtcggttccttac (CTG)8
RM6283
0.49 0.54
4 3
gccgcaccctcactccctcctc tcttgccggagcgcttgaggtg (CGG)8
RM156
0.37 0.41
3 8
gacagggagtgattgaaggc gttgatttcgccaagggc (CT)21
RM256
0.31 0.36
3 5
tcccgtatgtaacgtgcca gacaagagaacatcgctagg (CT)15(CA)10
RM593
0.42 0.48
2 3
ctgtgtcgaaaggctgcac cagtcctgtgttgcagcaag (GA)15
RM282
0.39 0.44
3 11
attcatgcttcctttcagtg gattactggtttgccatttg (CT)18
RM3428
0.38 0.39
4 5
ggcgaattctttgcacttgg acggtttggtagggtgtcac (GA)11
RM574
0.32 0.34
3 12
cggtcaaatcatcacctgac caaggcttgcaagggaag (GA)11
number, gene diversity (Dl), and polymorphism information content (PIC). Gene diversity, referred to as expected heterozygosity, is defined as the probability of two randomly chosen alleles from a different population. Where f is the inbreeding coefficient and estimated from the data using the method of moments. Polymorphism information content (PICi) is estimated following the formula proposed by Botstein et al. (1980):
Population structure analysis was carried out through a Bayesian-based model using Structure 2.3.4 software (12) for assayed 48 rice varieties using a burn-in of 100,000, run length of 100,000, and a model allowing for admixture and correlated allele frequencies. At least five runs of Structure were done by setting the number of subgroups (K) from 1 to 10, and an average likelihood value L (K), was calculated for each K across all runs. The model choice criterion to detect the most probable value of K was ΔK, an ad hoc quantity related to the second-order change of the log probability of data with respect to the number of clusters inferred by Structure (3, 24). Inferred ancestry estimates of individuals (Q-matrix) were derived for the selected subpopulation (12). The calculation of kinship coefficients (K-matrix), r2, and D' values and also cluster analysis based on neighbor joining method and MLM-based association analysis (http://www.maizegenetics.net).
RESULTS
Phenotypic variation
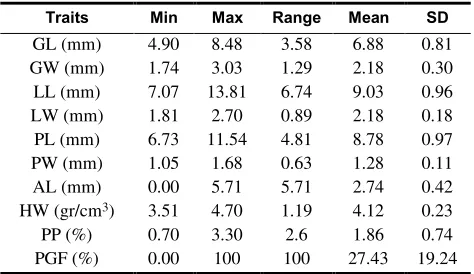
The summary statistics for ten studied traits of the 48 rice varieties are shown in Table 3. There was a reasonable level of variation in the majority of the measured quantitative traits in this rice panel, indicating that genetic gain by means of selection is likely. For example, for grain length (GL), grain width (GW) and lemma length (LL), the maximum values were approximately two times larger than the minimum values in the studied varieties.
Figure 1. Bilateral charts to determine the optimal number of K identified by Structure program
These relatively large levels of phenotypic variability were measured for all traits, indicating that this collection of varieties were appropriate to be used in association studies of agronomic traits. Also the phenotypic value for each studied trait was normally distributed, indicating that the traits are controlled by quantitative genes (25).
Allelic variation and evaluation of population structure
A total of 18 SSR primer pairs selected from different chromosomes were used to evaluate the genetic diversity of the studied genotypes. These primers were generated a total of 63 bands ranging from 2 (RM252) to 5 (RM315), with an average of 3.5 bands per primer (Table 2). The average genetic diversity over all SSR loci was 0.44 that shows the probability of two alleles varies between two individuals (1), with a mean polymorphism information content (PIC) value of 0.397 (Table 2) As a prerequisite, population structure matrix (Q) varies between two individuals (1),
Table 3. Summary statistics for grain related assayed traits. SD Mean Range
Max Min Traits
0.81 6.88
3.58 8.48
4.90 GL (mm)
0.30 2.18
1.29 3.03
1.74 GW (mm)
0.96 9.03
6.74 13.81
7.07 LL (mm)
0.18 2.18
0.89 2.70
1.81 LW (mm)
0.97 8.78
4.81 11.54 6.73
PL (mm)
0.11 1.28
0.63 1.68
1.05 PW (mm)
0.42 2.74
5.71 5.71
0.00 AL (mm)
0.23 4.12
1.19 4.70
3.51 HW (gr/cm3)
0.74 1.86
2.6 3.30 0.70 PP (%)
19.24 27.43
100 100
0.00 PGF (%)
GL: Grain length, GW: Grain width, LL: Lemma length, LW: Lemma width, PL: Palea length, PW: Palea width, AL: Awn length, HW: Hectoliter weight, PP: Percentage of grain protein, PGF: Percentage of grain fissure
0 10 20 30 40 50 60
2 3 4 5 6 7 8 9 10
D
e
lt
a
k
k
2
1
1
(1
) / (1
)
k
l lu
u
f
D
p
n
1
2 2 2
1 1 1
1
2
k k k
l lu lu lv
u u v u
PIC
p
p p
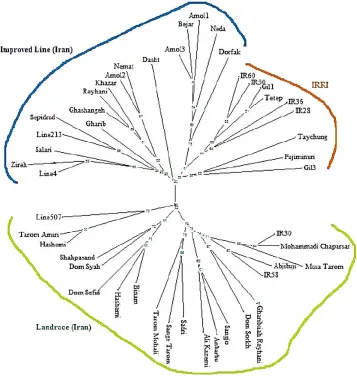
with a mean polymorphism information content (PIC) value of 0.397 (Table 2) As a prerequisite, population structure matrix (Q) should be considered to avoid false positive associations (21). The analysis of population genetic structure showed a significant population structure in these rice varieties. Since the distribution of L (K) did not show a distinct mode for the true number of K, to overcome difficulties in determining the real value of K, another measurement (ΔK) has been used (3). In our study, the collection of 48 assayed rice genotypes was partitioned into three subgroups (K=3) with the consideration of the highest value of ΔK (Figure 1). Cluster analysis based on neighbor-joining algorithm, subdivided all of the 48 genotypes into three major Subgroups (Figure 2). Therefore, we used the
respective Q matrix output of the three subgroups runs for association analysis based on population structure.
LD values determination and Association analysis In order to evaluate LD extent, the squared correlations (r2) of allele frequency and D' indices were calculated by analysis of a total of 63 loci pairs on the same chromosome obtained from the 18 selected SSR markers using the program TASSEL 3.0. The r2 and D' values for used primer pairs ranged from 0.001 to 0.331and 0.009 to 0.74, with the average value of 0.053 and 0.241, respectively. Meanwhile, for five primer pairs, r2 was more than 0.1, possibly due to convergent selection pressure between distant markers (24). Marker trait associations (P< 0.05) for all measured traits
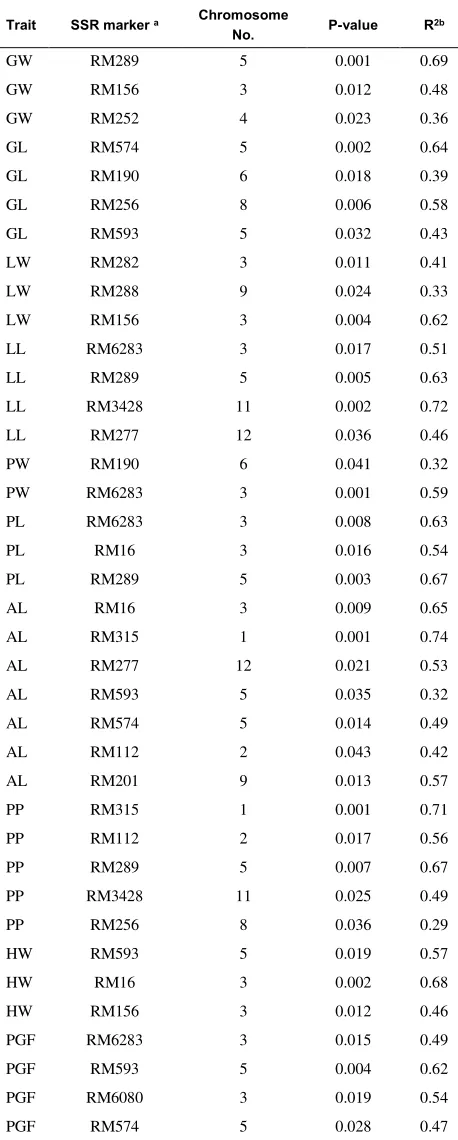
Table 4. Associations between SSR markers and ten agronomic traits (as described in Table 2) with P< 0.05.
a Only SSR markers with a significant marker-trait association are reported (P<0.05). r2b indicates the percentage of total variation explained.
were evaluated in different chromosomes using the program TASSEL 3.0. By carrying out genome scanning, a total of 38 marker-trait associations related to studied traits were identified using 18 different SSR markers and explained more than 32% of the total variation. The 38 marker-trait associations for the 10 assayed traits in studied rice varieties ranged from two to seven associations, with the average value of 3.8 for each trait: Awn length (AL) was associated with seven markers, percentage of grain protein (PP) with five markers, grain length (GL), lemma length (LL) and percentage of grain fissure (PGF) with four markers, grain width (GW), lemma width (LW), palea length (PL) and hectoliter weight (HW) were associated with three markers and palea width (PW) with two markers. The highest coefficients of determination (R2) were belong to RM315 (R2=0.74, AL), RM3428 (R2=0.72, LL), RM315 (R2=0.71, PP), RM289 (R2=0.69, GW), RM16 (R2=0.68, HW), RM289 (R2=0.67, PL), RM574 (R2=0.64, GL) and RM156 (R2=0.62, LW) markers, that showing strong association between these markers and mentioned traits. Also the results showed that some identified loci were associated with two or more traits simultaneously (Table 4). For instance, RM289 on chromosome 5 was associated with four traits (GW, LL, PL, and PP), while RM282, RM201, RM288, and RM6080 were only associated with one trait. Having knowledge of these loci could make a valuable contribution to rice breeding programs.
DISCUSSION
Since rice is completely sequenced, it is well suited to genome-wide association studies. Among the factors influencing accuracy of marker–traits association, the admixture of used population and its level of diversity are very important. Since the ΔK statistics showed a clear distribution of true K value (3), it was used in the present study to an accurate estimation and determination of true number of subgroups, K (Figure 1). The rice varieties were significantly divided into three subgroups based on results from population structure analysis. Association analysis with regard to simultaneous population structure (Q) and kinship (K) matrices, could eliminate biased results, considering the structured population and relatedness characteristics in rice germplasm (12, 21). Therefore to achieve results with high accuracy, a mixed linear model
(MLM) approach considering Q and K matrices (Q+K) was used to less possible spurious associations (24). Association analysis results showed a total of 38 associations between 18 different SSR markers and assayed traits (Table 4). Furthermore, the coefficient of determination (R2) for majority of the identified associations was more than 32%, indicating that they could be major associations (4). The results of this study showed some of marker-trait associations that had been previously reported (Gramene web site) in associated with QTLs controlling some of assayed traits in foreign rice germplasm. Thus association analysis can be used as an efficient method for validation of identified QTLs in other population. Also the obtained results revealed that association analysis technique can be considerate as an alternative method for conventional linkage mapping. Recently, successful studies were implemented using association analysis. For example, association analysis between amino acid contents and 25 SSR markers were performed in 84 rice landrace accessions by Zhao et al. (2009). In another study, in order to identify genomic regions associated with 12 agronomic traits, association analysis was carried out using 274 SSR markers in 150 rice landraces (23). Also Kumar et al. (2015) evaluated 220 rice accessions using 6,000 SNPs through association analysis to identify loci related to salinity tolerance in rice. The results of these researches suggest that association analysis could be considerate as a cost and time effective and efficient approach in unveiling genomic regions/candidate genes related to different complex traits in rice. In this study, some of markers were significantly associated with several traits simultaneously (such as association between RM289 marker on chromosome 5 with GW, LL, PL, and PP traits), that may be due to multiple pleiotropic effects and could be used in marker-aided selection to improve breeding programs efficiency. Also, the linkage between RM289 and QTLs of grain shape that was mentioned in Gramene website and results from this study confirmed it, suggesting use of this marker (RM289) for MAS in different rice breeding programs. In addition, it looks that adjacent genomic region of RM289 marker is important in control of grain shape properties. Therefore, due to the availability of complete information of rice sequence, the putative genes controlling traits related to grain shape can be predicted by in silico analysis. In conclusion, the grain related traits are effective on the
quality and quantity of rice yield, directly or indirectly. Therefore, the identification of genic regions controlling these traits is valuable to promotion of rice breeding programs. The findings of our study, demonstrated that association analysis of complex traits in rice with a relatively small number of markers is an efficient method that could provide basic information for further research such as MAS, fine mapping and candidate gene discovery in terms of grain properties and other important agronomic traits.
ACKNOWLEDGMENTS
The authors gratefully acknowledge the Faculty of Agricultural sciences, University of Guilan, Rasht, Iran, for lab facilities and Rice Research Institute of Iran (RRII), Rasht, Iran, for their practical help in field experiments.
REFERENCES
[1] Basirnia, A., Hatami Maleki, H., Darvishzadeh, R. and Ghavami, F. 2014. Mixed linear model association mapping for low chloride accumulation rate in oriental-type tobacco (Nicotianatabaccum L.) germplasm. J Plant Interact, 9 (1): 666-672.
[2] Botstein, D., White, R. L., Skolnick, M. and Davis, R. W. 1980. Construction of a genetic linkage map in man using restriction fragment length polymorphisms. Am J Hum Genet, 32: 314-331.
[3] Evanno, G., Regnaut, S. and Goudet, J. 2005. Detecting the number of clusters of individuals using the software STRUCTURE: a simulation study. Mol Ecol, 14: 2611-2620. [4] Falconer, D. S. and Mackay, T. F. C. 1996. Introduction to quantitative genetics, 4th edt. Longman Group Ltd, London, UK.
[5] Flint‐Garcia, S. A, Thuillet, A. C., Yu, J., Pressoir, G., Romero, S. M, Mitchell, S. E., Doebley, J., Kresovich, S., Goodman, M. M. and Buckler, E. S. 2005. Maize association population: a high‐resolution platform for quantitative trait locus dissection. Plant J, 44: 1054-1064.
[6] Han, Y., Teng, C., Hu, Z. and Song, Y. 2008. An optimal method of DNA silver staining in polyacrylamide gels. Electrophoresis, 29: 1355-1358.
[8] Kumar, V., Singh, A., Amitha Mithra, S. V., Krishnamurthy, S. L., Parida, S. K., Jain, S., Tiwari, K. K., Singh, N. K. and Mohapatra, T. 2015. Genome-wide association mapping of salinity tolerance in rice (Oryzasativa). DNA Res, 1-13. [9] Liu, K. and Muse, S. V. 2005. PowerMarker: An integrated
analysis environment for genetic marker analysis. Bioinformatics, 21: 2128-2129.
[10]Liu, L., Wang, L., Yao, J., Zheng, Y. and Zhao, C. 2010. Association mapping of six agronomic traits on chromosome 4A of wheat (Triticumaestivum L.). Mol Plant Breed, 1(5): 1-10.
[11]Morgante, M. and Salamini, F. 2003. From plant genomics to breeding practice. Curr Opin Biotechnol, 14: 214-219. [12]Pritchard, J. K., Stephens, M. and Donnelly, P. 2000.
Inference of population structure using multilocus genotype data. Genetics, 155: 945–959.
[13]Shehzad, T., Iwata, H. and Okuno, K. 2009. Genome-wide association mapping of quantitative traits in sorghum [Sorghum bicolor (L.) Moench] by using multiple models. Breed Sci, 59: 217-227.
[14]Shulman, A. H. 2007. Molecular markers to assess genetic diversity. Euphytica, 158: 313- 321.
[15]Simko, I., Pechenick, D. A., McHale, L. K., Truco, M. J., Ochoa, O. E., Michelmore, R. W. and Scheffler, B. E. 2009. Association mapping and marker-assisted selection of the lettuce dieback resistance gene Tvr1. BMCPlantBiol, 23: 9-135.
[16]Varshney, R. K. and Tuberosa, R. 2007. Genomics-assisted crop improvement: an overview. In: Genomics-assisted crop improvement. Springer. p. 1-12.
[17]Wang, M., Jiang, N., Jia, T., Leach, L., Cockram, J., Comadran, J., Shaw, P., Waugh, R. and Luo Z. 2012. Genome-wide association mapping of agronomic and morphologic traits in highly structured populations of barley cultivars. Theor Appl Genet, 124: 233-246.
[18]Warburton, M., Yan, J. and Crouch, J. 2011. Association mapping for enhancing maize (L.) genetic improvement. Crop Sci, 51: 433-449.
[19]Wen, W., Mei, H., Feng, F., Yu, S., Huang, Z., Wu, J., Chen, L., Xu, X. and Luo, L. 2009. Population structure and association mapping on chromosome 7 using a diverse panel of Chinese germplasm of rice (Oryzasativa L.). Theor Appl Genet, 119: 459-470.
[20]Yao, J., Wang, L., Liu, L., Zhao, C. and Zheng, Y. 2009. Association mapping of agronomic traits on chromosome 2A of wheat. Genetica, 137: 67-75.
[21]Yu, J., Pressoir, G., Briggs, W. H., Bi, I. V., Yamasaki, M. and Doebley, J. F. 2006. A unified mixed-model method for association mapping that accounts for multiple levels of relatedness. NatGenet, 38: 203- 208.
[22]YunFei, Z., GuoPing, S. and XuGao, C. 2007. Archaeological sites dating to 7000 years ago. Chin Sci Bull, 52: 1654-1660.
[23]Zhang, P., Liu, X., Tong, H., Lu, Y. and Li, J. 2014. Association mapping for important agronomic traits in core collection of rice (Oryza sativa L.) with SSR markers. PLoS ONE, 9 (10): 508-519.
[24]Zhao, W., Park, E. J., Chung, J. W., Park, Y. J., Chung, I. M., Ahn, J. K. and Kim, G. H. 2009. Association analysis of the amino acid contents in rice. J Integr Plant Biol, 51 (12): 1126- 1137.
[25]Zheng, X., Wu, J. G., Lou, X. H., Xu, H. M. and Shi, C. H. 2008. QTL analysis of maternal and endosperm genomes for histidine and arginine in rice (Oryza sativa L.) across environments. Acta Agron Sin, 34: 369- 375.
[26]Zong, Y., Chen, Z., Innes, J., Chen, C., Wang, Z. and Wang, H. 2007. Fire and flood management of coastal swamp enabled first rice paddy cultivation in east china. Nature, 449: 459-462.
مرژ رد ﻪﻧاد ﺎﺑ ﻂﺒﺗﺮﻣ ﻢﻬﻣ تﺎﻔﺻ زا ﯽﺧﺮﺑ ﯽﮑﯿﺘﻧژ عﻮﻨﺗ و ﯽﻃﺎﺒﺗرا ﻪﯾﺰﺠﺗ
) ﺞﻧﺮﺑ ﻢﺳﻼﭘ
Oryza
sativa
L.
(
ﯽﻤﻠﻋا ﯽﻠﻋ
1 *
هداﺰﯿﻠﻋ ﺪﻤﺤﻣ ،
1
مﺮﺧ نﺎﯾدازﺮﯿﺷ ﺎﺿر ،
دﺎﺑآ
2
يدﺎﺒﻋ ﺮﺒﮐا ﯽﻠﻋ ،
3
يﺰﯾﺰﻋ رﺪﯿﺣ و
1
1.
حﻼﺻا و ﺖﻋارز هوﺮﮔ
يزروﺎﺸﮐ مﻮﻠﻋ هﺪﮑﺸﻧاد تﺎﺗﺎﺒﻧ
نﻼﯿﮔ هﺎﮕﺸﻧاد
ناﺮﯾا ،ﺖﺷر ،
2
.
نﻼﯿﮔ هﺎﮕﺸﻧاد يزروﺎﺸﮐ مﻮﻠﻋ هﺪﮑﺸﻧاد
ناﺮﯾا ،ﺖﺷر ،
3.
رﻮﺸﮐ ﺞﻧﺮﺑ تﺎﻘﯿﻘﺤﺗ ﻪﺴﺳﺆﻣ
ناﺮﯾا ،ﺖﺷر ،
*
ﺴﻣ هﺪﻨﺴﯾﻮﻧ
ﻮﺌ
ل
:
[email protected]
هﺪﯿﮑﭼ
نﺎﮑﻣ ﯽﯾﺎﺳﺎﻨﺷ
نﻮﻧﺎﮐ رد زور ﻪﺑ زور نﺎﻫﺎﯿﮔ ﯽﻟﻮﮑﻟﻮﻣ حﻼﺻا رد ﯽّﻤﮐ تﺎﻔﺻ لﺮﺘﻨﮐ رد ﻞﯿﺧد ﯽﻣﻮﻧژ يﺎﻫ
ﯽﻣ راﺮﻗ يﺮﺘﺸﯿﺑ ﻪﺟﻮﺗ
ﻪﻌﻟﺎﻄﻣ .ﺪﻧﺮﯿﮔ
ﻦﯿﺑ ﯽﮑﯿﺘﻧژ عﻮﻨﺗ ﯽﺑﺎﯾزرا رﻮﻈﻨﻣ ﻪﺑ ﺮﺿﺎﺣ
48
ﺎﺑ ﻂﺒﺗﺮﻣ ﯽﻣﻮﻧژ ﻖﻃﺎﻨﻣ ﻦﯿﯿﻌﺗ و ﺞﻧﺮﺑ ﭗﯿﺗﻮﻧژ
10
ﻞﮐ رد .ﺖﻓﺮﮔ مﺎﺠﻧا ﻪﻧاد ﻪﺑ طﻮﺑﺮﻣ ﻢﻬﻣ ﺖﻔﺻ
داﺪﻌﺗ
63
زا هدﺎﻔﺘﺳا ﺎﺑ ﻞﻟآ
18
ﺮﮕﻧﺎﺸﻧ
SSRموزﻮﻣوﺮﮐ زا هﺪﺷ بﺎﺨﺘﻧا
ﻦﯿﮕﻧﺎﯿﻣ ﺎﺑ ﻒﻠﺘﺨﻣ يﺎﻫ
5/
3
ياﺮﺑ ﻞﻟآ
شور .ﺪﺷ يزﺎﺳرﺎﮑﺷآ ﺮﮕﻧﺎﺸﻧ ﺮﻫ
راﺪﻘﻣ ﺮﺜﮐاﺪﺣ ﻦﺘﻓﺮﮔ ﺮﻈﻧ رد ﺎﺑ ﻦﯾﺰﯿﺑ لﺪﻣ ﺮﺑ ﯽﻨﺘﺒﻣ
ΔK،
48
ﻢﯿﺴﻘﺗ ﯽﻠﺻا هوﺮﮔ ﺮﯾز ﻪﺳ رد ار ﯽﺑﺎﯾزرا درﻮﻣ ﭗﯿﺗﻮﻧژ
راﺪﻘﻣ ﻦﯿﮕﻧﺎﯿﻣ .دﺮﮐ يﺪﻨﺑ
2 r
نﺎﮑﻣ ﺖﻔﺟ ﻪﯿﻠﮐ ياﺮﺑ
موزﻮﻣوﺮﮐ يور يﺎﻫ
،ﻪﺑﺎﺸﻣ يﺎﻫ
053
/0
ﻞﮐ رد .دﻮﺑ
38
ﺮﮕﻧﺎﺸﻧ طﺎﺒﺗرا
-ﯽﻨﻌﻣ ﺖﻔﺻ
راد
) 0.05 P< (
ﻪﮐ ﺪﺷ ﯽﯾﺎﺳﺎﻨﺷ
زا ﺮﺘﺸﯿﺑ
32
.ﺪﻧدﻮﻤﻧ ﻪﯿﺟﻮﺗ ار تاﺮﯿﯿﻐﺗ ﻞﮐ ﺪﺻرد
يﺎﻫﺮﮕﻧﺎﺸﻧ
RM315
،
RM3428،
RM289
،
RM16،
RM574و
RM156
ياراد ﺐﯿﺗﺮﺗ ﻪﺑ
راﺪﻘﻣ ﻦﯾﺮﺘﺸﯿﺑ
2R