The influence of misregistration between CT and SPECT images on the
accuracy of CT-based attenuation correction of cardiac SPECT/CT imaging:
Phantom and clinical studies
Leila Saleki
1,2, Pardis Ghafarian
3,4, Ahmad Bitarafan-Rajabi
5,6,
Nahid Yaghoobi
5,6, Babak Fallahi
7, Mohammad Reza Ay
1,21
Research Center for Molecular and Cellular Imaging, Tehran University of Medical Sciences, Tehran, Iran
2
Department of Medical Physics and Biomedical Engineering, Tehran University of Medical Sciences, Tehran, Iran
3Chronic Respiratory Diseases Research Center, National Research Institute of Tuberculosis and Lung Diseases,
Shahid Beheshti University of Medical Sciences, Tehran, Iran
4
PET/CT and Cyclotron Center of Masih Daneshvari Hospital, Shahid Beheshti University of Medical Sciences,
Tehran, Iran
5
Cardiovascular Interventional Research Center, Department of Nuclear Medicine, Rajaei Cardiovascular, Medical,
and Research Center, Iran University of Medical Sciences, Tehran, Iran
6
Department of Nuclear Medicine, Rajaei Cardiovascular, Medical, and Research Center, Iran University of Medical
Sciences, Tehran, Iran
7
Research Center for Nuclear Medicine, Shariati Hospital, Tehran University of Medical Sciences, Tehran, Iran
(Received 2 July 2017, Revised 2 March 2019, Accepted 4 March 2019)
ABSTRACT
Introduction: Integration of single photon emission computed tomography (SPECT) and computed tomography (CT) scanners into SPECT/CT hybrid systems permit detection of coronary artery disease in myocardial perfusion imaging (MPI). Misregistration between CT and emission data can produce some errors in uptake value of SPECT images. The aim of this study was evaluate the influence of attenuation correction (AC) versus non-attenuation correction (NC) images and the effect of misregistration on all segments of SPECT images for quantitative and qualitative analysis.
Methods: 99 patients (45 males, 54 females) underwent stress/rest myocardial perfusion imaging (MPI) using 99mTc-MIBI were used in this study. We also utilized cardiac insert and lung insert in cylinder phantom. Phantom studies were performed with and without defect. The misregistration of all patient data was measured and variation in misregistration of our population was recorded. The effect of attenuation correction (AC) and non-attenuation correction (NC) images were also evaluated in both phantom and patient data. The CT images were shifted by ±1, ±2, ±3 pixels along X-, Y- and Z-axis (Left/right, dorsal/ventral, cephalic/caudal) for both phantom and patient studies. Differences between misalignment data and misregistration correction images were also measured. Results displayed with 20 segments polar map analysis and illustration in standard orientations for cardiac tomographic images.
Results:In the patient population data, 1.5% were perfectly registered, 17% and 73% misaligned under 1 pixel and more than 1 pixel, respectively. AC of SPECT images showed increased uptake value in normal phantom and false positives findings were disappeared versus to NC images. In patient data, statistically significant variation were shown for the most segments before and after AC value<=0.004) and also between AC of SPECT image and misregistration correction images (P-value<=0.048). Along X-axis, in 3 pixel shift in right direction, the percent of relative difference in lateral wall were 11.94% for mid anterolateral. Along Y-axis, the Ventral shift caused -15.9% changes in basal inferolateral and along Z-axis -8.59 % changes in apical anterolateral were also observed in caudal direction when 3 pixel shifts were used.
Conclusion: This study showed that CT-based attenuation correction of cardiac images in hybrid SPECT/CT is important to improve image quality. Misalignment in caudal, cephalad, ventral and right direction introduced significant variation even in 1 pixel shift. It is important to apply misregistration correction even in small misalignment routinely in clinical myocardial perfusion imaging.
Key words: Cardiac SPECT/CT; Attenuation correction; Misregistration artifact; Image registration; Myocardial perfusion imaging
Iran J Nucl Med 2019;27(2):63-72
Published: July, 2019 http://irjnm.tums.ac.ir
Corresponding author:Dr Pardis Ghafarian, Chronic Respiratory Diseases Research Center, National Research Institute of Tuberculosis and Lung Diseases (NRITLD), Shahid Beheshti University of Medical Sciences, Tehran, Iran.
E-mail: [email protected]
O
rigi
na
l A
rticl
Ir
an
J
N
u
cl
Me
d
20
1
9
,
V
ol
27,
No
2
(
S
er
ial
N
o
53
)
h
tt
p:
//
ir
jn
m
.tu
m
s.a
c.ir
Ju
ly
,
20
19
64
INTRODUCTION
Myocardial perfusion imaging (MPI) with single photon emission computed tomography (SPECT) is a successful imaging method for the detection of coronary artery disease (CAD) in daily clinical routine [1, 2]. However, non-uniform tissues attenuation in the thorax, specially lung, diaphragm and breast tissue can be the source of false positive result and artifacts in myocardial perfusion SPECT image [3]. Today's, attenuation map are obtained with computed tomography (CT) for SPECT emission data .Advantages of the CT scan for attenuation correction (AC) consist of lower noise, faster acquisition, higher quality, higher photon flux, no decay of transmission source and improved resolution [4, 5]. It is clear that CT imaging in hybrid system can also increase the likelihood of misregistration between CT and emission data [6], increasing the patient absorbed dose [7-9] and increasing CT artifact to emission data [10-12].
Huang et al. demonstrated that
attenuation correction in post stress MPI scan by SPECT/CT can be possibly more helpful in men than women [13]. It was shown that using attenuation correction can lead to improve quantitative accuracy [14]. Goetze et al. stated that radioactivity distribution can be significantly changed when registration correction was performed for MPI [5]. Goetze et al. revealed that registration is important to prevent misregistration artifact in cardiac perfusion imaging [15]. The purpose of this study was to assess the clinical usefulness of CT based attenuation correction in myocardial perfusion imaging and to determine the role of misregistration on cardiac images interpretation by patient and phantom study. In the first step, the difference between uptake value for NC and AC images were assessed in both phantom and
patient studies. In the next step, we evaluated the amplitude of misregistration in our patient population. Then, for consideration of misregistration influence on uptake value for all segments of cardiac SPECT, misregistrations in different directions were manually created and the importance of misregistration correction for AC images was evaluated.
METHODS Phantom study
The phantom studies were performed using a cylinder phantom (an inside diameter of 21.6cm), cardiac insert (model ECT/CAR/I; with Solid/Fillable Defect Set) and lung insert. The chest body phantom consists of lung inserted that filled with water (soft tissue equivalent material) and the cardiac phantom was placed inside the water-filled cylindrical phantom at the position of the human heart. The cardiac insert include a ventricle and myocardial chamber (Figure 1).
In this study, two strategies were applied for phantom studies. In the first, the cardiac phantom was simply filled with 8mCi of Tc-99m solution. In the second, we added two solid defects in cardiac phantom: (i) in mid anterolateral segment with 2 cm height, 5 mm wall thickness, and (ii) in basal inferoseptal segment with 2 cm height, 1 cm wall thickness.
Patient population
The study was consist of 99 patients (45 men and 54 women; mean age±SD; 56.87±10.34y, mean body mass index±SD; 28.53±5.78 kg/(m)2) who underwent stress-rest myocardial perfusion imaging that injected with 99mTc-MIBI.
Fig 1. Photographs of phantoms used in this study; a) Cardiac InsertTM, Model ECT/CAR/I, b) cylinder chest phantom with lung and cardiac
Ir
an
J
N
u
cl
Me
d
20
1
9
,
V
ol
27,
No
2
(
S
er
ial
N
o
53
)
h
tt
p:
//
ir
jn
m
.tu
m
s.a
c.ir
Ju
ly
,
20
19
65
Data acquisition and processing
Myocardial perfusion imaging was acquired using Infinia Hawkeye-4 SPECT/CT camera (dual head, GE Healthcare) equipped with low-energy, high-resolution, parallel-hole collimator and with a 37×37cm field of view and zoom factor of 1.5. Each patient underwent a two-day stress-rest 99mTc-MIBI protocol. Patients were permitted to breathe normally during both the SPECT and the CT scans, in the supine position with their arm above the head.
SPECT imaging was performed with the following specifications for both phantom and patient studies: each rectangular detector was in position 90º and rotated from the left anterior oblique to the left posterior oblique positions; 60 frames of 3º (30 steps over a 180º scan) and 20 s per projection. A 64 × 64 projection matrix of 5.9-mm² pixel size was used. For emission data, 20% energy window was set and centered at 140 keV. The CT scanner was a low dose multi-slice (4 slices) helical CT with 140-kV and 2.5-mA of current tube and pitch of 1.9:1 with slice thickness 5mm. SPECT data were reconstructed by Ordered-Subsets Expectation Maximization (OSEM) with 2 iterations and 10 subsets. Reconstructed images were smoothed by use of a Butterworth filter with a critical frequency of 0.35 and power of 10.0 and processed on a Xeleris workstation (GE Healthcare). Attenuation correction (AC) and non-attenuation correction (NC) images were displayed in 4DM-SPECT software on the standard orientations for cardiac tomographic images as short axis, horizontal long axis and vertical long axis for visual analysis and twenty-segment polar map for semi-quantitative analysis. Radiotracer uptake intensity was regionally normalized to maximum cardiac value in each segment, set for polar map display (range; 0%-100%).
Quantification and correction of misregistration
Correction of the misregistration between SPECT and CT images was done manually with the manufacturer’s software (ACQC tool; GE Healthcare). CT images shifted in X, Y and Z directions to obtain the best cardiac edges according to SPECT images. In this step, Euclidian distance of mismatched was calculated by
2 2 2
z y
x .
Maximum normalized count in 20 segments for non-corrected and attenuation-non-corrected images before and after reregistration was compared. To determine the influence of amount of misregistration, the CT images were shifted by ±1, ±2, ±3 pixels (1 pixel=5.9 mm) in the X, Y and Z-axis (left/right, dorsal/ventral, cephalic/caudal) according to SPECT images. Maximum normalized count difference was also compared between each shifted image and reregistered image.
Statistical analysis
Data were reported as mean ± SD. Paired-sample t-test was used for comparing data between the NC images and AC images, before and after misregistration correction. General Linear Model test was also used to determine the influence of any pixel shift of CT images on the SPECT images. P-value ≤ 0.05 was considered statistically significant.
RESULTS
The SPECT images of cardiac insert phantom without any defects were illustrated in Figure 2 in NC and AC images. It is obvious that the artifactual inferior defect in NC cardiac phantom image was eliminated in attenuation correction of SPECT image.
Fig 1.The influence of attenuation correction on uptake value in SPECT images of cardiac phantom without any defects. Left, iteratively reconstructed attenuation-corrected (IRAC), right, iteratively reconstructed non–attenuation-corrected (IRNC).
Figure 3 showed the effect of two defects in NC and AC on the polar maps of SPECT images. After AC the summed rest score (SRS) value varied from 14 to 5 and showed significantly improvement in real uptake value.
Ir
an
J
N
u
cl
Me
d
20
1
9
,
V
ol
27,
No
2
(
S
er
ial
N
o
53
)
h
tt
p:
//
ir
jn
m
.tu
m
s.a
c.ir
Ju
ly
,
20
19
66
In our patient population except 3 studies (1.5%) which were perfectly registered, the other studies showed misalignment. 35 studies (17%) misaligned under 1 pixel, 144 studies (73%) misaligned more than 1 pixel, included 13 studies (6.5 %) misaligned between 1-2 pixels and 3 studies (1.5%) more than 3 pixels. It should be clear that, least and most misregistration error occurred in Y- direction (-0.60 ±3.64 mm) with a range of 0-30.8 mm and in x-direction (6.41 ± 3.64 mm) with a range of 0-20.2 mm, respectively. Moreover, misregistration more than 1 pixel occurred 67%, 11% and 20%, in the X-, Y- and Z- axis, respectively. Figure 4 shows a representative example from a stress myocardial perfusion image of woman patient in which a lateral defect was created after AC that was reduced after correction for misregistration.
Fig 4. The polar map of the stress myocardial perfusion for a typical woman patient. (a), Non-attenuation correction, (b), Attenuation Correction and (c) Attenuation correction image after correction for misregistration.
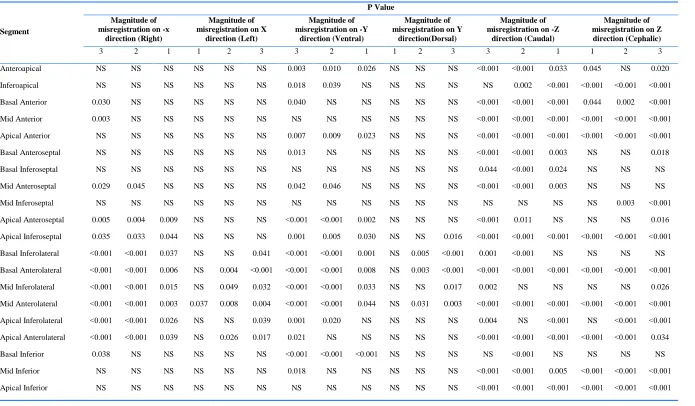
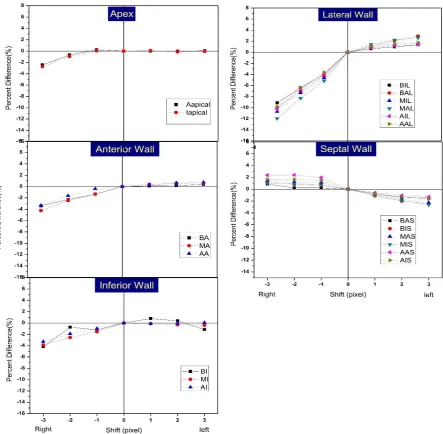
In our patient study, significant differences between ACand NC for maximum normalized percentage of all polar map segments were shown except in apical inferoseptal, basal anterolateral, and apical inferolateral segments and also between AC and misregistration correction images except anteroapical, apical anterior, basal anterolateral and mid inferior segments (Table 1). For accurate evaluation of the misalignment in various directions on regional radiotracer uptakes in SPECT images, we produced a systematic misregistration by shifting the CT image relative to SPECT image (±1, ±2, ±3 pixels along X, Y and Z axis).With regard to statistical analysis, it was obvious that in our patient study, misalignment for dorsal and left directions introduced the less variation (Table 2).The percent of relative difference in all segments of polar map between misregistration correction image and shifted images along X, Y and Z axis were illustrated in Figures 5, 6 and 7, respectively. Along X-axis, the most severe differences caused by right and left shift in segments of the lateral wall. In 3 pixel shift in right direction, the percent of relative difference in lateral wall were -9.12% for basal inferolateral,-10.00% for basal anterolateral,-10.71% for mid inferolateral, 11.94% for midanterolateral,-10.23% for apical inferolateral and -9.77% for apical anterolateral (Figure 5). Along Y-axis, the most
variation was seen in Ventral shift that caused -15.9% changes in basal inferolateral, -10.6% change in mid inferolateral, -10.8% changes in basal anterolateral and -10.2% changes in mid anterolateral segments for 3 pixel shift (Figure 6). Along Z-axis -8.59 % change in apicalanterolateral,-8.18% variation in mid anterolateral and-7.79% change in basal anterolateral were also observed in caudal direction when 3 pixel shift has occurred (Figure 7).
DISCUSSION
Ir
an
J
N
u
cl
Me
d
20
1
9
,
V
ol
27,
No
2
(
S
er
ial
N
o
53
)
h
tt
p:
//
ir
jn
m
.tu
m
s.a
c.ir
Ju
ly
,
20
19
67
Table 1: Comparison of the Maximum Normalized Percentage in 20 segments of polar map for all patients in this study for NC, AC images before and after misregistration correction.
Segment IRNC IRAC MD+ P+ IRAC-MC MD* P* MD‡ P‡
Anteroapical 84.28 ± 10.23 79.14 ± 7.99 -5.14 ˂0.001 79.29 ± 8.02 -4.99 ˂0.001 0.15 NS
Inferoapical 82.22 ± 11.01 77.62 ± 8.88 -4.61 ˂0.001 78.16 ± 8.75 -4.07 ˂0.001 0.54 0.048
Basal Anterior 72.05 ± 7.75 73.33 ± 6.87 1.28 0.002 72.30 ± 6.77 0.25 NS -1.03 ˂0.001
Mid Anterior 79.23 ± 8.84 80.35 ± 7.31 1.12 0.004 79.77 ± 7.11 0.54 NS -0.58 0.004
Apical Anterior 80.65 ± 9.73 77.05 ± 7.43 -3.60 ˂0.001 76.85 ± 7.42 -3.80 ˂0.001 -0.20 NS
Basal Anteroseptal 59.21 ± 9.65 61.17 ± 9.70 1.95 ˂0.001 59.84 ± 9.73 0.63 ˂0.001 -1.32 0.001 Basal Inferoseptal 58.25 ± 11.29 67.62 ± 11.60 9.37 ˂0.001 66.35 ± 11.51 8.10 ˂0.001 -1.27 ˂0.001
Mid-Anteroseptal 84.22 ± 7.89 88.34 ± 6.18 4.12 ˂0.001 87.19 ± 6.68 2.96 ˂0.001 -1.16 ˂0.001
Mid Inferoseptal 81.03 ± 8.45 89.34 ± 5.86 8.32 ˂0.001 88.27 ± 6.07 7.25 ˂0.001 -1.07 ˂0.001
Apical Anteroseptal 85.88 ± 8.36 84.86 ± 7.03 -1.02 0.003 84.17 ± 7.03 -1.71 ˂0.001 -0.69 ˂0.001
Apical Inferoseptal 88.75 ± 7.98 88.58 ± 5.88 -0.17 NS 87.99 ± 5.96 -0.76 NS -0.59 0.001
Basal Inferolateral 73.46 ± 9.71 80.05 ± 9.37 6.59 ˂0.001 80.95 ± 9.69 7.49 ˂0.001 0.90 0.004
Basal Anterolateral 78.25 ± 7.64 78.29 ± 7.68 0.04 NS 78.66 ± 7.57 0.40 NS 0.36 NS
Mid Inferolateral 81.40 ± 9.01 86.18 ± 8.47 4.78 ˂0.001 87.42 ± 8.11 6.02 ˂0.001 1.24 ˂0.001
Mid Anterolateral 87.95 ± 7.57 85.56 ± 8.14 -1.39 ˂0.002 87.65 ± 7.16 -0.30 NS 1.09 ˂0.001
Apical Inferolateral 79.43 ± 8.26 79.88 ± 7.39 0.45 NS 81.35 ± 7.14 1.92 ˂0.001 1.47 ˂0.001
Apical Anterolateral 83.35 ± 9.60 80.20 ± 7.82 -3.16 ˂0.001 81.26 ± 7.70 -2.09 ˂0.001 1.07 ˂0.001 Basal Inferior 63.17 ± 12.41 77.03 ± 12.75 13.86 ˂0.001 76.41 ± 12.57 13.24 ˂0.001 -0.62 ˂0.001
Mid Inferior 72.07 ± 11.66 83.48 ± 9.82 11.42 ˂0.001 83.44 ± 9.28 11.37 ˂0.001 -0.05 NS
Apical Inferior 75.30 ± 10.22 77.26 ± 7.98 1.96 ˂0.001 77.83 ± 7.66 2.54 ˂0.001 0.58 0.002
+Comparison of IRNC and IRAC
*Comparison of IRNC and IRAC-MC
‡Comparison of IRAC and IRAC-MC
IRNC = iteratively reconstructed non–attenuation-corrected IRAC = iteratively reconstructed attenuation-corrected
IRAC-MC = iteratively reconstructed attenuation-corrected study after correction for misregistration MD = mean difference
Ir
an
J
N
u
cl
Me
d
20
1
9
,
V
ol
27,
No
2
(
S
er
ial
N
o
53
)
h
tt
p:
//
ir
jn
m
.tu
m
s.a
c.ir
Ju
ly
,
20
19
68
Table 2: Statistical comparison between perfect alignment of ACimage and misalignment images with various pixel shifts.
Segment
P Value Magnitude of
misregistration on -x direction (Right)
Magnitude of misregistration on X
direction (Left)
Magnitude of misregistration on -Y
direction (Ventral)
Magnitude of misregistration on Y
direction(Dorsal)
Magnitude of misregistration on -Z
direction (Caudal)
Magnitude of misregistration on Z direction (Cephalic)
3 2 1 1 2 3 3 2 1 1 2 3 3 2 1 1 2 3
Anteroapical NS NS NS NS NS NS 0.003 0.010 0.026 NS NS NS ˂0.001 ˂0.001 0.033 0.045 NS 0.020
Inferoapical NS NS NS NS NS NS 0.018 0.039 NS NS NS NS NS 0.002 ˂0.001 ˂0.001 ˂0.001 ˂0.001
Basal Anterior 0.030 NS NS NS NS NS 0.040 NS NS NS NS NS ˂0.001 ˂0.001 ˂0.001 0.044 0.002 ˂0.001
Mid Anterior 0.003 NS NS NS NS NS NS NS NS NS NS NS ˂0.001 ˂0.001 ˂0.001 ˂0.001 ˂0.001 ˂0.001
Apical Anterior NS NS NS NS NS NS 0.007 0.009 0.023 NS NS NS ˂0.001 ˂0.001 ˂0.001 ˂0.001 ˂0.001 ˂0.001
Basal Anteroseptal NS NS NS NS NS NS 0.013 NS NS NS NS NS ˂0.001 ˂0.001 0.003 NS NS 0.018
Basal Inferoseptal NS NS NS NS NS NS NS NS NS NS NS NS 0.044 ˂0.001 0.024 NS NS NS
Mid Anteroseptal 0.029 0.045 NS NS NS NS 0.042 0.046 NS NS NS NS ˂0.001 ˂0.001 0.003 NS NS NS
Mid Inferoseptal NS NS NS NS NS NS NS NS NS NS NS NS NS NS NS NS 0.003 ˂0.001
Apical Anteroseptal 0.005 0.004 0.009 NS NS NS ˂0.001 ˂0.001 0.002 NS NS NS ˂0.001 0.011 NS NS NS 0.016
Apical Inferoseptal 0.035 0.033 0.044 NS NS NS 0.001 0.005 0.030 NS NS 0.016 ˂0.001 ˂0.001 ˂0.001 ˂0.001 ˂0.001 ˂0.001
Basal Inferolateral ˂0.001 ˂0.001 0.037 NS NS 0.041 ˂0.001 ˂0.001 0.001 NS 0.005 ˂0.001 0.001 ˂0.001 NS NS NS NS
Basal Anterolateral ˂0.001 ˂0.001 0.006 NS 0.004 ˂0.001 ˂0.001 ˂0.001 0.008 NS 0.003 ˂0.001 ˂0.001 ˂0.001 ˂0.001 ˂0.001 ˂0.001 ˂0.001
Mid Inferolateral ˂0.001 ˂0.001 0.015 NS 0.049 0.032 ˂0.001 ˂0.001 0.033 NS NS 0.017 0.002 NS NS NS NS 0.026
Mid Anterolateral ˂0.001 ˂0.001 0.003 0.037 0.008 0.004 ˂0.001 ˂0.001 0.044 NS 0.031 0.003 ˂0.001 ˂0.001 ˂0.001 ˂0.001 ˂0.001 ˂0.001
Apical Inferolateral ˂0.001 ˂0.001 0.026 NS NS 0.039 0.001 0.020 NS NS NS NS 0.004 NS ˂0.001 NS ˂0.001 ˂0.001
Apical Anterolateral ˂0.001 ˂0.001 0.039 NS 0.026 0.017 0.021 NS NS NS NS NS ˂0.001 ˂0.001 ˂0.001 ˂0.001 ˂0.001 0.034
Basal Inferior 0.038 NS NS NS NS NS ˂0.001 ˂0.001 ˂0.001 NS NS NS NS ˂0.001 NS NS NS NS
Mid Inferior NS NS NS NS NS NS 0.018 NS NS NS NS NS ˂0.001 ˂0.001 0.005 ˂0.001 ˂0.001 ˂0.001
Ir
an
J
N
u
cl
Me
d
20
1
9
,
V
ol
27,
No
2
(
S
er
ial
N
o
53
)
h
tt
p:
//
ir
jn
m
.tu
m
s.a
c.ir
Ju
ly
,
20
19
69
Fig 5. Percent of relative difference in polar map segment between misregistration correction of SPECT image and shifted imaged by ±1, ±2,
±3 pixels in X-direction.
Phantom image without any defects illustrated the observed error of uptake value was increased with increasing of pixel shifts (score 3, 2, 1 for 3 pixel shift versus to score 2,1for 2pixel shift although score 0 was correct value) in left and right direction (data are not shown), that were in agreement with previous study [17]. For our patient data, misregistration in X-axis demonstrated serious effect in lateral wall (right and left direction), anterior and inferior wall for right direction. It was obvious that significant variation was seen in right compared with left direction. Polycarpou et al. revealed that artifact in MPI of SPECT/CT can be decreased when using both respiratory motion correction and attenuation correction [24]. It seems interesting that inferior and anterior segment of left ventricle in myocardial walls showed the most
Ir
an
J
N
u
cl
Me
d
20
1
9
,
V
ol
27,
No
2
(
S
er
ial
N
o
53
)
h
tt
p:
//
ir
jn
m
.tu
m
s.a
c.ir
Ju
ly
,
20
19
70
Fig 6. Percent of relative difference in polar map segment between misregistration correction of SPECT image and shifted imaged by ±1, ±2,
±3 pixels in Y-direction.
Fig 7. Percent of relative difference in polar map segment between misregistration correction of SPECT image and shifted imaged by ±1, ±2,
Ir an J N u cl Me d 20 1 9 , V ol 27, No 2 ( S er ial N o 53 ) h tt p: // ir jn m .tu m s.a c.ir Ju ly , 20 19 71
Although diaphragm and muscles can generate higher uptake value compared with aligned image.it should be noted that, Patchett et al. demonstrated that visual evaluation of coronary artery calcium in CTAC can be useful when MPI of SPECT/CT was done for improvement of diagnostic information [25]. The effect of misregistration in various segments of cardiac images in our data had some variation compared with Kennedy et al. [26] likely due to different in polar map application (5-segment versus to 20- segment). Our investigation had some limitation; 1) manual shifting of the CT images for misregistration correction by physician which was time consuming, 2) the results were not classified according to patient’s weight and gender.
CONCLUSION
Although CT-based attenuation correction of cardiac images in hybrid SPECT/CT imaging introduced some benefit in image quality but misregistration error can also produce some error in interpretation. Misregistration correction is vital for accurate quantification even in the presence of small misalignment. Misalignment in caudal, cephalad, ventral and right direction introduced significant variation even in 1 pixel shift with less variation being observed in left and dorsal direction. In general misregisteration can produce both underestimation and overestimation of uptake value however the impact of this behavior depends on the direction and degree of misalignment.
Acknowledgments
This work was supported by Tehran University of Medical Sciences under grant number 30849.
REFERENCES
1. Hachamovitch R. Prognostic characterization of patients
with mild coronary artery disease with myocardial perfusion single photon emission computed tomography: validation of an outcomes-based strategy. J Nucl Cardiol. 1998 Jan-Feb;5(1):90-5.
2. Russell RR 3rd, Zaret BL. Nuclear cardiology: present and
future. Curr Probl Cardiol. 2006 Sep;31(9):557-629.
3. Zaidi H, Hasegawa BH. Attenuation correction strategies in
emission tomography. quantitative analysis in nuclear medicine imaging. Springer; 2006. p. 167-204.
4. Bybel B, Brunken RC, DiFilippo FP, Neumann DR, Wu G,
Cerqueira MD. SPECT/CT imaging: clinical utility of an
emerging technology. Radiographics. 2008
Jul-Aug;28(4):1097-113.
5. Goetze S, Brown TL, Lavely WC, Zhang Z, Bengel FM.
Attenuation correction in myocardial perfusion SPECT/CT: effects of misregistration and value of reregistration. J Nucl Med. 2007 Jul;48(7):1090-5.
6. Geramifar P, Zafarghandi MS, Ghafarian P, Rahmim A, Ay
MR. Respiratory-induced errors in tumor quantification and delineation in CT attenuation-corrected PET images: effects of tumor size, tumor location, and respiratory trace: a simulation study using the 4D XCAT phantom. Mol Imaging Biol. 2013 Dec;15(6):655-65.
7. Ay M, Shahriari M, Sarkar S, Ghafarian P. Measurement of
organ dose in abdomen-pelvis CT exam as a function of mA, KV and scanner type by Monte Carlo method. Int J Radiat Res. 2004;1(4):187-194
8. Ay MR, Mehranian A, Maleki A, Ghadiri H, Ghafarian P,
Zaidi H. Experimental assessment of the influence of beam hardening filters on image quality and patient dose in volumetric 64-slice X-ray CT scanners. Phys Med. 2013 May;29(3):249-60.
9. Ghafarian P, Aghamiri SM, Ay MR, Fallahi B, Rahmim A,
Schindler TH, Ratib O, Zaidi H. Coronary calcium score scan-based attenuation correction in cardiovascular PET imaging. Nucl Med Commun. 2010 Sep;31(9):780-7.
10. Ay MR, Mehranian A, Abdoli M, Ghafarian P, Zaidi H.
Qualitative and quantitative assessment of metal artifacts arising from implantable cardiac pacing devices in oncological PET/CT studies: a phantom study. Mol Imaging Biol. 2011 Dec;13(6):1077-87.
11. Etemadi Z, Ghafarian P, Bitarafan-Rajabi A, Malek H,
Rahmim A, Ay MR. Is correction for metallic artefacts mandatory in cardiac SPECT/CT imaging in the presence of pacemaker and implantable cardioverter defibrillator leads? Iran J Nucl Med. 2018;26(1):35-46.
12. Ghafarian P, Aghamiri SM, Ay MR, Rahmim A, Schindler
TH, Ratib O, Zaidi H. Is metal artefact reduction mandatory in cardiac PET/CT imaging in the presence of pacemaker and implantable cardioverter defibrillator leads? Eur J Nucl Med Mol Imaging. 2011 Feb;38(2):252-62.
13. Huang R, Li F, Zhao Z, Liu B, Ou X, Tian R, Li L. Hybrid
SPECT/CT for attenuation correction of stress myocardial perfusion imaging. Clin Nucl Med. 2011 May;36(5):344-9.
14. Gerdekoohi SK, Vosoughi N, Tanha K, Assadi M,
Ghafarian P, Rahmim A, Ay MR. Implementation of absolute quantification in small-animal SPECT imaging: Phantom and animal studies. J Appl Clin Med Phys. 2017 Jul;18(4):215-223.
15. Goetze S, Wahl RL. Prevalence of misregistration between
SPECT and CT for attenuation-corrected myocardial perfusion SPECT. J Nucl Cardiol. 2007 Apr;14(2):200-6.
16. Ghafarian P, Ay M. The influence of PET and CT
misalignment due to respiratory motion on the cardiac PET/CT imaging: a simulation study. Front Biomed Technol. 2015;1(4).
17. Ghafarian P, Ay MR, Fard-Esfahani A, Rahmim A, Zaidi
H. Quantification of PET and CT misalignment errors due to bulk motion in cardiac PET/CT imaging: phantom and clinical and studies. Front Biomed Technol. 2014;1(3).
18. Fricke E, Fricke H, Weise R, Kammeier A, Hagedorn R,
Lotz N, Lindner O, Tschoepe D, Burchert W. Attenuation correction of myocardial SPECT perfusion images with low-dose CT: evaluation of the method by comparison with perfusion PET. J Nucl Med. 2005 May;46(5):736-44.
19. Heller GV, Bateman TM, Johnson LL, Cullom SJ, Case JA,
Ir
an
J
N
u
cl
Me
d
20
1
9
,
V
ol
27,
No
2
(
S
er
ial
N
o
53
)
h
tt
p:
//
ir
jn
m
.tu
m
s.a
c.ir
Ju
ly
,
20
19
72
SPECT imaging. J Nucl Cardiol. 2004 May-Jun;11(3):273-81.
20. Patton JA, Turkington TG. SPECT/CT physical principles
and attenuation correction. J Nucl Med Technol. 2008 Mar;36(1):1-10.
21. Pazhenkottil AP, Ghadri JR, Nkoulou RN, Wolfrum M,
Buechel RR, Küest SM, Husmann L, Herzog BA, Gaemperli O, Kaufmann PA. Improved outcome prediction by SPECT myocardial perfusion imaging after CT attenuation correction. J Nucl Med. 2011 Feb;52(2):196-200.
22. Apostolopoulos DJ, Gąsowska M, Savvopoulos CA,
Skouras T, Spyridonidis T, Andrejczuk A, Vassilakos PJ. The impact of transmission-emission misregistration on the interpretation of SPET/CT myocardial perfusion studies and the value of misregistration correction. Hell J Nucl Med. 2015 May-Aug;18(2):114-21.
23. Huang JY, Yen RF, Lee WC, Huang CK, Hsu PY, Cheng
MF, Lu CC, Lin YH, Chien KL, Wu YW. Improved diagnostic accuracy of thallium-201 myocardial perfusion single-photon emission computed tomography with CT attenuation correction. J Nucl Cardiol. 2018 Feb 26. doi: 10.1007/s12350-018-1230-y.
24. Polycarpou I, Chrysanthou-Baustert I, Demetriadou O,
Parpottas Y, Panagidis C, Marsden PK, Livieratos L. Impact of respiratory motion correction on SPECT myocardial perfusion imaging using a mechanically moving phantom assembly with variable cardiac defects. J Nucl Cardiol. 2017 Aug;24(4):1216-1225.
25. Patchett ND, Pawar S, Miller EJ. Visual identification of
coronary calcifications on attenuation correction CT improves diagnostic accuracy of SPECT/CT myocardial perfusion imaging. J Nucl Cardiol. 2017;24(2):711-20.
26. Kennedy JA, Israel O, Frenkel A. Directions and