EEG Classification in Brain Computer Interface (BCI):
A Pragmatic Appraisal
Bamidele Osalusi1, Amole Abraham2,*, David Aborisade3
1Neurology Unit, Department of Medicine, Olabisi Onabanjo University Teaching Hospital, Sagamu, Nigeria 2Department Electrical, Electronic and Computer Engineering, Bells University of Technology, Ota, Nigeria 3Department of Electronic and Electrical Engineering, Ladoke Akintola University of Technology, Ogbomoso, Nigeria
Abstract
Brain computer interface (BCI) is one of the technologies growing at an exponential rate with its applications extended to medical and non-medical fields. EEG is widely used in BCI for detection and analysis of abnormalities of the brain. EEG is characterized by inherently high temporal resolution and precision, low spatial resolution and specificity plus contains artifacts and redundant or noise information both from the subject and equipment interferences. Thus, feature extraction is a critical issue in translation algorithm development for BCI. Above all, BCI still faces a lot challenges that results in performance variation across and even within subjects. Thus, this work provides a concise but all encompassing review of methods that have been adopted in the recent time for development of an EEG classification in BCI.Keywords
EEG, BCI, Classifiers, Feature extraction1. Introduction
The brain computer interface (BCI) is one of the currently evolving technologies that have attracted significant attention over recent decades and have witnessed remarkable improvement both in speed and accuracy [1]. By definition, BCI is simply a hardware and software communications system that enables humans to interact with their surroundings by directly acquiring and analyzing neural signals between the brain and the computer. Unlike the conventional systems which are controlled by computer, the BCI is controlled by human brain signal [2]. Basically, BCIs are of active types which are controlled by means of endogenous tasks such as motor imagery and mental arithmetic operations, and reactive types that are controlled using external stimulation like auditory, visual and haptic [3].
BCI have been reported to have facilitated restoration of the movement ability for physically challenged or locked-in users and replacing lost motor functionality. At present, BCI have been proposed as a tool for diagnosing, treating and following up many other neurophysiological and neuropsychological disorders [4]. The recent research trends have applied BCI to non-medical applications for instance, normal subjects explores BCIs as a novel input device and
* Corresponding author:
[email protected] (Amole Abraham) Published online at http://journal.sapub.org/ajbe
Copyright©2018The Author(s).PublishedbyScientific&AcademicPublishing This work is licensed under the Creative Commons Attribution International License (CC BY). http://creativecommons.org/licenses/by/4.0/
investigation of the generation of hands-free applications. Also, BCI permits re-integration of the sensory–motor loop [5].
Irrespective of its type, a BCI is basically made up of the signal acquisition module, translation algorithm module, control interface module and device controller module. Of all the modules, the translation algorithm is an important tool for detecting brain activities and abnormalities thus; the current research focuses on the problem of EEG signal pattern, control signal transfer algorithm and system application [7]. The control applications of BCI have been an object of intensive research by researchers resulting in improvement in product developments [8, 10]. For instance, in 1999, a patient could type 0.5 characters per minute through slow cortical potential (SCP) BCI [6] while in 2007, a commercial speller controlled by visual attention averaged 7.5 characters per minute [13].
EEG is one of the mostly used non-invasive modalities for probing the human brain functions however; none of these modalities is effective in providing necessary information to understand the spatio-temporal aspects of information processing in the human brain [19, 9]. While [21, 20] defined EEG as a representation of post-synaptic potentials that are generated at cortical level by synchronous activity of about 105 (10 rates to 5) neurons or the electrical activity recorded from the human scalp [9]. EEG is widely used in BCI for detection and analysis of abnormalities of the brain [23].
methods to improve the spatial resolution of EEG likewise [25] spatial filter approach for evaluation of the surface Laplacian of the EEG and MEG. Also, [27] employed the lead field theory approach to address the problem of spatial resolution in EEG. Apart from the fact that EEG contains artifacts produced by eye movements and/or blinks [20, 29] it also has redundant or noise information both from the subject and equipment interferences [30, 21].
The feature extraction is a critical issue in translation algorithm development as it considers the extraction of the most discriminative features so as to arrive at a system with high performance. Above all, BCI still faces a lot challenges that results in performance variation across and even within subjects [13]. Thus, this work provides a concise but all compassing review of methods that have been adopted in the recent time for development of an EEG classification in BCI.
2. Electroencephalography (EEG)
The electrical activity of neurons is response for the formation of EEG. The first human EEG signal was recorded by Hans Berger in 1924 by placing two electrodes on a patient’s skull to detect a very weak current using a galvanometer. The EEG is a noninvasive procedure for registering the brain activity through digital recordings thus, EEG has provided promising ways for computer-based signal processing to aid in epilepsy diagnosis [20, 9]. The EEG signal is the resulting waveform representing the overall electrical activity of the brain arising from many neuronal activities. Nowadays, clinical EEG machines can be found in many clinics for routine brain electrical activity monitoring and assisting the physicians in decision-making processes [16]. The EEG has emerged as a fundamental tool in the diagnosis and research of several brain disorders, including those related to epilepsy. A clear understanding of the basics of EEG signal generation and recording is necessary as in Figure 1 in order to effectively model and analyze EEG.
Figure 1. EEG Signals of Emanating from Lobes of the Brain (Source: Richard and Michael, 1974)
The EEG signal from the scalp is typically characterized by amplitude of approximately 100 μV and time duration of
0.01–2 s [32, 33]. EEG signals are basically affected by moods such as drowsiness, excitement, and relaxation. In clinical tests, recording electrodes are placed on the scalp using international standards EEG geometrical sites, such as the 10–20 system [28]. Clean contact between the electrode and the skin is necessary for good EEG recording; the conductive gel is usually applied to reduce the impedance between the electrode and the scalp. Each electrode is input to a differential amplifier commonly set between 1,000 and 100,000 amplification.
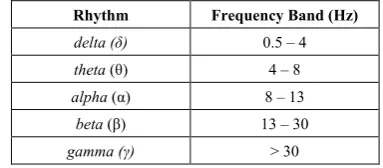
The temporal resolution of EEG is about 1msec which mean that events of short duration, such as epileptic spikes that which lasts for about 1msec can be reliably recorded. Although normal EEG fluctuations have amplitudes of 75µV or more, the magnitude of useful brain signals buried in these fluctuations is often considerably smaller [20, 9]. The electrical activity of the brain recorded in an EEG is normally distributed in a few frequency ranges, corresponding to different brain states. Rhythmic sinusoidal activities can be recognized within the EEG signal; the frequency compositions of the EEG signals commonly used for analysis and are categorized into main five frequency bands as shown in Table 1.
EEG has been widely used by neuroscientists to study brain function. The mathematical modeling and analysis of EEG has advanced the development of computer interface tools that assisted the identification of salient patterns embedded within the EEG to improve recognition. Aside from the fact that BCI can facilitate the communication of physically handicapped individuals with the help of a computer by using EEG signal characteristics, BCI has been recently employed in the restoration of the disable people’s day-to-day activities and in the diagnosis and monitoring of Alzheimer disease (AD), Epilepsy, Huntington’s disease (HD) and Sleep disorders. Other applications of EEG are in evoked potentials or evoked responses that are useful for evaluating a number of neurological conditions.
Table 1. Brain Rythms and Respective Frequency Band
Rhythm Frequency Band (Hz)
delta (δ) 0.5 – 4
theta (θ) 4 – 8
alpha (α) 8 – 13
beta (β) 13 – 30
gamma (γ) > 30
3. Review of Methods
This section presents review of some of the methods that have been employed by researchers in BCI and EGG classification researches in the recent times.
3.1. Principal Component Analysis (PCA)
space to low dimensional space and it has found application in fields such as image recognition and compression [65, 66]. PCA is a powerful method in image formation and data patterns used for feature extraction in which similarities and differences between them are identified efficiently [67, 68]. It has the advantage of reduced dimension by avoiding redundant information without much loss [69]. It achieves this by defining new co-ordinate axes in directions that are rich in information content. The transform variables with the largest value can be assumed to have the greatest discriminatory power [75]. The Eigen vectors of the covariance matrix determine low dimensional space. If x(0), x(1), ….. x(n-1) is a set of input sample and x is the N x 1 corresponding vector
xT= [x(0), …., x(n-1)] (1) Also
0
1
H
H N
a H
a
J A x x
−
= ≡
(2)
Where H = denotes Hermittan operation, y = is the transformed vector of x and A = unitary matrix N x N.
From the definition of unitary matrix the above equation become
1
0 ( )
N
i
x Ay − y i ai
=
=
∑
(3)A, ai, i = 0, 1,…N-1 columns are called the basis vector of the transform. By PCA definition;
2 N 1 T N 1i i i i
i m i m
x x
−a a
λ
−λ
= =
∈
−
=
=
∑
∑
(4)Where λi are the eigenvalues and is the largest eigenvalue of the correlation matrix.
2 ( ) 2( )
i y i y i
λ = σ ≡∈
(5)
This equation 5 generates features that are mutually uncorrelated.
3.2. Independent Component Analysis (ICA)
Independent component analysis (ICA) is a computation method for separating multi-source signals into subcomponents, with the assumption that the signals are mutually statistically independent [70]. This analysis is a type of blind source separation that determines the independent components by maximizing the statistical independence of the estimated components [50]. The ICA theory goes beyond PCA in that it try to achieve much more than simple decorrelation of the data. Given the input samples x,the invertible matrix Wof N x Ndimensions with the following observations y(i), i = 0, 1, . . . , N - 1, of the transformed vector are mutually independent given as
y = Wx (6)
The goal of statistical independence is a stronger condition than the uncorrelatedness required by PCA. ICA has the capability of revealing information from the higher order statistics of the data [71]. Assuming that the input random data vector xis indeed generated by a linear combination of statistically independent and stationary components such that
x = Ay (7) then A is the mixing matrix and 𝑊 is the de-mixing matrix. 3.3. Fast Fourier Transform
The development of the fast Fourier transform (FFT) led to extreme popularity of the Fourier transform. The FFT reduces the computation effort from N2 for the conventional discrete Fourier transform to N log2N in one dimension for the FFT which translates to efficiency gain. For instance, assume that a two-dimensional fast Fourier transform of a 1024 × 1024 pixel image takes 5 seconds on a computer; the conventional discrete Fourier transform would take 14 hours for the same image. The operation of FFT can be represented as in the following equations
( )
1( )
2 / 0N
j kn N n
X n −x n e− π
=
=
∑
(8)Equation 8 can be re-written as in 9
( )
1( )
0
N
nk N n
X n −x n W
=
=
∑
(9)According to [35], the summation can be split into odd and even parts as in:
( )
1( )
1( )
0 0
N N
nk nk
N N
n n
even n odd n
X n
−x n W
−x n W
= =
=
∑
+
∑
(10)
This equation reveal that the N-point DFT reduces to two
N/2-point DFTs. The symmetry of the phase shifts comes into play when the number of summations is reduced from N
to N/2.
3.4. Self-Organizing Maps (SOM)
k i ki i
net
=
∑
φ
w
(11)If the most activated unit is denoted by y*, the weight to this unit and its immediate neighbourhood are updated by
(
1)
( )
( )
(
*)
ki ki i
w t+ =w t +n t Λ y y− φ (12)
Where n(t) is the learning rate that depends on t, t is the iteration number, |𝑦 − 𝑦∗| is the window function which
ensures that neigbouring points in the target have weights that are similar and its value is 1.0 for y = y*.
3.5. Wavelets
Wavelet transform is a multi-resolution technique that offers the advantage of time-frequency representation of the image [65]. Its approach is such that it breaks up a signal (image) into shifted and scaled versions of the “mother” wavelet. Wavelet analysis is done by convolving the signal wavelet kernels to obtain wavelet coefficients representing the contributions of wavelets in the signal at different scales and orientation [84]. The wavelet transform is very popular since it allows for localization in time and frequency [74, 80, 85]. These basis functions include Haar (haar), Daubchies (db), Symlets (sym), Coiflets (coif), and biorthogonal (bior). They have compact support but differ in properties thus, the selection of the basis function is a key issue in a wavelet transform based analysis. Consider a signal x(t), its discrete wavelet transform DWT can be represented as follows:
𝑥(𝑡) =∑𝑘∈𝑍𝑢𝑗0𝑘∅𝑗0𝑘(𝑡) +∑𝑗=−∞𝑗0 ∑𝑘∈𝑍𝑤𝑗,𝑘𝜓𝑗,𝑘(𝑡) (13)
Where 𝑢𝑗,𝑘 are the scaling coefficients, ∅𝑗,𝑘 is a scaling
function, 𝑤𝑗,𝑘 are the wavelet coefficients and 𝜓𝑗,𝑘 is the
wavelet function. The scaling and wavelet function can further be express a family of functions as follows
∅𝑗,𝑘(𝑡) = 2−𝑗/2∅�2−𝑗/2𝑡 − 𝑘� (14)
𝜓𝑗,𝑘(𝑡) = 2−𝑗/2𝜓�2−𝑗/2𝑡 − 𝑘� (15)
The basis function listed above can be used to decompose data into different resolutions from which approximation and detail coefficients can be computed.
3.6. Distance Classifier
The distance classifier is a method of classification in which the classes are similar in distribution and are linearly separable with the underlying observation model for each sample described by a reflectivity. The approximated probability density function (PDFs) generated using this reflectivity parameter can be compared with the other PDFs in the database. The decision rule according to [81];
1
2
2 2 1
1 2
2
2 ln
w
w
P
X M X M
P
− − − ≥ (16)
Where w1is the class 1, w2is the class 2, X is the sample,
M1 is the mean of class 1, M2 is the mean of the class 2, P1 is
the probability of the class 1 and P1 is the probability of the
class. Hence the decision lines are allocated half way
between the centers of clusters of different classes i.e. P1 =
P2 = 0.5. The distance classifier can be computed using the
following algorithm:
1. Group the data set into supervised number of classes to be considered clusters according to their labels. 2. Estimate the sample means for each class by averaging
the parameter set of the class.
3. Classify test sample by assigning it to the class which has the nearest means vector.
4. Estimate error rate by the percentage of misclassified samples.
3.7. k-Nearest Neighbor (kNN) Classifier
The k-Nearest neighbors (kNN) classifier is a nonparametric method that classifies a test sample to the class of the majority of its k-neighbors [65, 81]. It is a nonlinear classifier and assuming the number of voting neigbours to be k= k1 + k2 …kN, where ki is the number of
samples from i in the k– sample neighborhood of the test samples. The test sample is assigned to class e if
𝐾2=𝑚𝑎𝑥(𝑘𝑖;𝑖= 1,2,3 … … … .𝑁) (17)
Based on the following algorithm voting kNN classifier can be computed as follows:
1. Get the distances between the test sample and the samples in the design set and store it.
2. Arrange the obtained distances values in ascending order.
3. Take the subset of the first k distance in the sorted array; i.e. kNN.
4. Estimate error rate by comparing the classification result with actual class membership.
The computation complexity of the kNN algorithm both in space and time has received a great deal of attention. However, the greatest use of kNN techniques is for problems with many features thus, attention is given to the general
d-dimensional case [12]. The prestructuring, computing partial distances and editing the stored prototypes are the general algorithmic techniques for reducing the computation burden in k-nearest-neighbor searches.
3.8. Support Vector Machine (SVM) Classifier
SVM clustering is a state-of-the-art learning machine that utilizes statistical learning theory [83], which was originally proposed for classification of data. It aims at defining an optimal hyperplane, that separates the training data so that the minimum expected risk is achieved [73]. Unlike the conventional neural networks the SVM is flexible in that it has many parameters that can be adjusted to achieve better classification rate [77, 78]. Different from other classifiers, SVM is less affected by the so-called “curse of dimensionality” [79]. According to [81], linearly separable classes can be described by a hyperplane:
0
( )
Tx0
This implies that the support vectors lie on either of the two hyperplanes and they form the critical elements of the training set.
3.9. The Neural Networks
The artificial neural network is capable of receiving stimulus from other neurons and can send a reaction to a number of neurons [76, 82]. It has a powerful capability to create hyperbolic surfaces in addition to the original straight lines as decision boundaries [86]. They have been proven themselves to be proficient classifiers and are well suited for tumour classification [87, 88]. Based on [86], the bipolar neural activation function is taken to be of the form
[
]
2
( ) 1
1 exp
f net
net
λ
= −
− (19)
Where net = sum of all inputs neuron multiplied by their weight, λ = activation constant usually one for all architecture. Back propagated neural networks is one of the most well known and oldest learning techniques in which back propagation algorithm is used for training the neural network [89, 11]. The advantage of the back propagation algorithm is that it has a number of parameters that can be varied in order to optimize performance of the classifier. These parameters include the momentum and the learning rate.
4. Brain Computer Interface (BCI)
Brain computer interface (BCI) is one of the currently evolving technologies that have attracted significant attention over recent decades and have witnessed remarkable improvement both in speed and accuracy [1]. BCI is simply a hardware and software communications system that enables humans to interact with their surroundings by directly acquiring and analyzing neural signals between the brain and the computer. BCIs are basically devices that translate changes of the neurophysiological activity of the brain into control commands for an application [15]. Unlike the conventional systems which are controlled by computer, the BCI is controlled by human brain signal [2]. The central element of a BCI is the translation algorithm that converts electrophysiological input from the user into output that controls external devices.Basically, BCIs are of active types which are controlled by means of endogenous tasks such as motor imagery and mental arithmetic operations, and reactive types that are controlled using external stimulation like auditory, visual and haptic [3]. According to [35], a BCI can generally be divided into three classes namely; the sensory interfaces, the cognitive interfaces and motor interfaces.
The communication channel of BCI is potentially useful in emerging researches that ranges from psychology and computational neuroscience to engineering such as bioengineering, human subject monitoring, neuroscience research, man – machine interaction and so on [1, 23]. For instance, BCI creates a new non-muscular channel for
relaying a person’s intentions to external devices such as computers, speech synthesizers, assistive appliances, and neural prostheses. Also, BCI permits to re-integration of the sensory–motor loop [5]. At present, BCI have been proposed as a tool for diagnosing, treating and following up many other neurophysiological and neuropsychological disorders [4]. BCI represents a new frontier as an interdisciplinary research direction [7, 36] since it works with neuroimaging techniques that plays critical role in neuroscience research and management of neurological and mental disorders [34].
In [51], a BCI based on electrocorticographic (ECoG) was worked upon to enable users control a one-dimensional computer cursor rapidly and accurately and finally suggested that an ECoG-based BCI could provide a non-muscular communication and control for subjects with severe motor disabilities. Meanwhile, [57] worked on common spatial pattern (CSP) to decorrelate EEG signals obtained from different electrodes and classification results indicate WCSP outperforms CSP for the true asynchronous BCI system with an average Kappa increase of 0.4. In the work of [52], BCI System bit rate for controlling a virtual telephone keypad was developed by a simulated virtual telephone keypad based on Steady State Visual Evoked Potential (SSVEP) using dynamic programming technique with a conclusion that that user reached requirement faster with little number of selections and thus increased transfer rate. In [56], a non-invasive BCI for the decoding of intended arm reaching movement in prosthetic limb control was designed and create a signal decoding strategy that allows more command over potential prosthetic devices thereby improving the classification accuracy from 60.11% to 93.91% in the binary class.
In [54], a work on the control of BCIs by users with cerebral palsy was conducted with 14 individuals with CP attempting to control two standard online BCIs based upon sensorimotor rhythm modulations and based upon steady state visual evoked potentials. According to [55], a novel hybrid BCI system that combines motor imagery (MI)-based bio-signals and steady-state visual evoked potentials (SSVEPs) to control the speed and direction of a real wheelchair synchronously was poposed and the results validated the efficiency of the developed system with an accuracy rate of more than 85% for all subjects.
enhancing the performance of the speller by preventing typing errors.
A telematics and informatics BCI system that consists of discriminative area selection, feature extraction and classification was proposed by [60] and the average classification accuracies of the three datasets used are 85.6, 83.1, and 81.3%, respectively. According to [63], a novel hybrid BCI system that uses near infrared spectroscopy (NIRS) and EEG was presented. The results of an online experiment demonstrated that the proposed system had a true positive rate of about 88%, a false positive rate of 7% with an average response time of 10.36 s. In [63], a prototype to test real time data collection and navigation through interface by detection and classification of event-related potentials (ERPs) was presented. The time segment (TS) in combination with LDA produces the best results for all subjects giving an average of 85% accuracy.
In the work of [61], a shift invariant ERP detection strategies on data from ten subjects obtained in a P300 speller experiment was proposed. The results support the conclusion that ERP detection can be achieved without a precise knowledge of the stimulus onsets. For [45], an online three-class transcranial doppler ultrasound BCI in which vision-independent right-lateralized tasks were investigated. It was concluded that the results demonstrated the potential of a three-class online TCD BCI that does not require visual task.
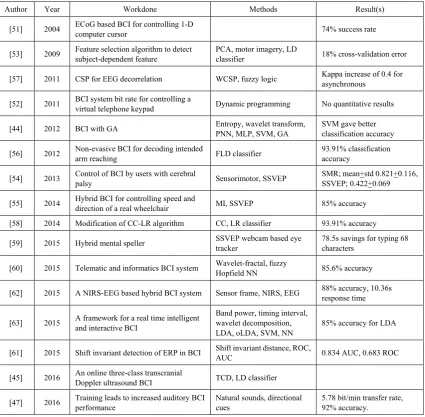
Table 2 presents a summary of the review of related works on EEG based BCI. The works presented in the Table were between 2004 and 2016; with 31.25% of the works done in 2015. It was also reflected from the work that 37.5% of the works in the table focused on control. The highest classification accuracy of 93.91% was reported in the table while 74% is the lowest reported.
Table 2. Summary of Review of Related Works on BCI
Author Year Workdone Methods Result(s) [51] 2004 ECoG based BCI for controlling 1-D computer cursor 74% success rate [53] 2009 Feature selection algorithm to detect subject-dependent feature PCA, motor imagery, LD classifier 18% cross-validation error [57] 2011 CSP for EEG decorrelation WCSP, fuzzy logic Kappa increase of 0.4 for asynchronous [52] 2011 BCI system bit rate for controlling a virtual telephone keypad Dynamic programming No quantitative results [44] 2012 BCI with GA Entropy, wavelet transform, PNN, MLP, SVM, GA SVM gave better classification accuracy [56] 2012 Non-evasive BCI for decoding intended arm reaching FLD classifier 93.91% classification accuracy [54] 2013 Control of BCI by users with cerebral palsy Sensorimotor, SSVEP SMR; mean+std 0.821+0.116, SSVEP; 0.422+0.069 [55] 2014 Hybrid BCI for controlling speed and direction of a real wheelchair MI, SSVEP 85% accuracy
[58] 2014 Modification of CC-LR algorithm CC, LR classifier 93.91% accuracy [59] 2015 Hybrid mental speller SSVEP webcam based eye tracker 78.5s savings for typing 68 characters [60] 2015 Telematic and informatics BCI system Wavelet-fractal, fuzzy Hopfield NN 85.6% accuracy
[62] 2015 A NIRS-EEG based hybrid BCI system Sensor frame, NIRS, EEG 88% accuracy, 10.36s response time
[63] 2015 A framework for a real time intelligent and interactive BCI Band power, timing interval, wavelet decomposition,
LDA, oLDA, SVM, NN 85% accuracy for LDA [61] 2015 Shift invariant detection of ERP in BCI Shift invariant distance, ROC, AUC 0.834 AUC, 0.683 ROC [45] 2016 An online three-class transcranial Doppler ultrasound BCI TCD, LD classifier
4.1. Feature Extraction
The accuracy or efficiency of a classification system depends largely on the feature(s) of the samples to be classified that is supplied to it [12] hence; feature extraction is an important stage in BCI. Feature extraction is the process of deriving new features from the original features in order to reduce the cost of feature measurement, increase classifier efficiency and allow higher classification accuracy [14, 37]. According to Deserno 2011, there are different levels of feature extraction namely; data level, pixel level, edge level, texture level [11] and region level. In attempt to correctly extract features for pattern recognition system, a number of transforms have been applied successfully. It has been discovered that different transform suits different application. However, most medical CAD systems are based on texture features which are extracted from biomedical images [38]. Most of the commonly used transforms for feature extraction include Wavelets, FFT, LDA, PCA, EMD and SOM.
As presented in Table 2, [53] worked on a feature selection algorithm to detect subject-dependent feature and channel relevance for mental task discrimination. In [48], the potential of Sample Entropy (SampEn) as a feature extraction method for automatic epilepsy detection and classification of normal, interictal, ictal and epileptic seizures EEG signals was investigated with a reported classification accuracy of 95.67%. In [44], a BCI with genetic algorithm was developed based on entropy and wavelet transform for feature extraction and two neural networks, including probabilistic neural network (PNN), Multilayered Perceptron (MLP) and support vector machine (SVM) were employed and their results were compared. A work on automatic EEG seizure detection using dual-tree complex wavelet-Fourier features was reported by [46] to achieve perfect classification rates (100%) for the EEG database from the University of Bonn. It was therefore concluded from the work that the conventional FFT could be replaced by sparse FFT so that the proposed method could be even faster. In [42], an epileptic seizure detection system that analyzes EEG signals using different transformation techniques and decompositions was presented to achieve an average sensitivity of 91.36%. In the same manner [43], presented epileptic seizure prediction system based relative spectral power features to improve sensitivity and specificity of prediction methods. The best results demonstrated a sensitivity of 75.8% and a false prediction rate of 0.1per hour.
4.2. Classification of EEG Signal
The central element in each BCI is the classification module which is also referred to as translation algorithm. It simply converts electrophysiological input from the user into output that controls external devices. The translation algorithm is an important stage in the signal processing module of the BCI system and it is responsible for translating
the extracted signal features into device commands that performs the user’s intent. Whatever the nature is, a translation algorithm changes signal features into device control commands. The first part of signal processing simply extracts specific signal features. The extracted signal features may be classified on both frequency and shape features based on linear methods or nonlinear methods like the neural networks [17].
BCI operations have been said to depend mainly on effective interaction between two adaptive controllers the user who encodes his or her commands in the electrophysiological input provided to the BCI, and the computer which recognizes the command [7]. The development of translation algorithms solely relies on the classifiers like kNN, LDA, Neural Network and SVM.
In [39], a neural network classification of EEG signals using AR with MLE preprocessing for epileptic seizure detection was presented with better specificity of 96.2% of the patients as epileptic seizure patients. The development of an EEG preprocessing technique that significantly improved the sensitivity and specificity of EEG based of detection of Alzheimer's disease (AD) was addressed in [40]. While [41] proposed a multiclass support vector machines (SVM) for EEG-signals classification with the error-correcting output codes to achieve 93.630%, [30] worked on detection of brain tumor in EEG signals with SVM as classifier that enables effective and early detection and classification of brain tumors thus initiating quicker clinical responses.
The work of [49] simply aimed at distinguishing the normal and abnormal hearing subjects using acoustically stimulated EEG signals to achieve a classification accuracy of 96.75% was obtained. In [64], a drowsiness detection mechanism was developed based on an EEG collected from the driver with an off-the-shelf mobile sensor and a success rate close to 80% was achieved based on the EEG data. Artifacts removal and selection of useful brain sources were done based on the ICA drivers EEG while a SOM was employed to recognize all distracted and concentrated EEG epochs in [50]. It was concluded from the work that the proposed BCI system reached a maximum accuracy of approximately 90% for the recognition of EEG epochs. The work of [48] was centered on the development of an automated classification of EEG signals for the detection of epileptic with overall classification accuracy of 99%.
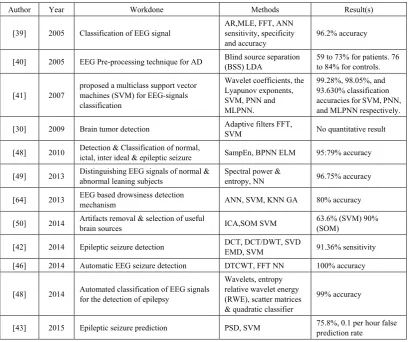
Table 3. Summary of Review of Related Works on EEG Based Neural Abnormalities Detection, Prediction and Classification Author Year Workdone Methods Result(s)
[39] 2005 Classification of EEG signal AR,MLE, FFT, ANN sensitivity, specificity
and accuracy 96.2% accuracy [40] 2005 EEG Pre-processing technique for AD Blind source separation (BSS) LDA 59 to 73% for patients. 76 to 84% for controls.
[41] 2007 proposed a multiclass support vector machines (SVM) for EEG-signals classification
Wavelet coefficients, the Lyapunov exponents, SVM, PNN and MLPNN.
99.28%, 98.05%, and 93.630% classification accuracies for SVM, PNN, and MLPNN respectively. [30] 2009 Brain tumor detection Adaptive filters FFT, SVM No quantitative result [48] 2010 Detection & Classification of normal, ictal, inter ideal & epileptic seizure SampEn, BPNN ELM 95:79% accuracy [49] 2013 Distinguishing EEG signals of normal & abnormal leaning subjects Spectral power & entropy, NN 96.75% accuracy [64] 2013 EEG based drowsiness detection mechanism ANN, SVM, KNN GA 80% accuracy [50] 2014 Artifacts removal & selection of useful brain sources ICA,SOM SVM 63.6% (SVM) 90% (SOM) [42] 2014 Epileptic seizure detection DCT, DCT/DWT, SVD EMD, SVM 91.36% sensitivity [46] 2014 Automatic EEG seizure detection DTCWT, FFT NN 100% accuracy
[48] 2014 Automated classification of EEG signals for the detection of epilepsy
Wavelets, entropy relative wavelet energy (RWE), scatter matrices & quadratic classifier
99% accuracy
[43] 2015 Epileptic seizure prediction PSD, SVM 75.8%, 0.1 per hour false prediction rate
Though the existing works reviewed in this paper achieved good classification accuracies, none of the works considered the use of hybridized classifier. Future researches should consider the use hybridized classifier for classifying EEG data.
5. Conclusions
This work is successful in providing a concise but all compassing review of methods that have been adopted in the recent time for development of an EEG classification in BCI. The work established that SVM and FFT are the mostly adopted classifier and feature extraction method for the development of EEG classification system. It is evident from this review of literature that there are rooms for improvement which may be achievable through classifier hybridization and improved feature extraction methods.
REFERENCES
[1] Luis F. N. and Jaime G. (2012), “Brain Computer Interfaces, a Review”, Sensors, 12, Pp: 1211 1279;
doi:10.3390/s120201211, ISSN 1424-8220, www.mdpi.com/journal/sensors.
[2] Wolpaw J R, Birbaumer N, Heetderkd W J, McFarland D J, Peckham P H, Schalk G, Donchin E, Quatrono L A, Robinson C J, Vaughan T M. (2000), “Brain Computer Interface Technology: a Review of the First International Meeting”,
IEEE Transactions on Rehabilitation Engineering, Vol. 8, No 2, Pp: 164−173.
[3] Tan, D.S. and Nijholt, A., (2010), “Brain Computer Interfaces: Applying our Minds to Human Computer Interaction”, 1st ed Springer-Verlag, London.
[4] Alonso-valerdi, L. M., Salido-ruiz, R. A. and Ramirez-mendoza, R. A. (2015), "Motor Imagery Based Brain Computer Interfaces: An Emerging Technology to Rehabilitate Motor Deficits”. Neuropsychologia, 79, Pp: 354–363.
[5] Bi L, Fan X-A, Liu Y. (2013), “EEG-Based Brain-Controlled Mobile Robots: a Survey”, Human-Machine Syst, IEEE Trans, Vol. 43, No. 2, Pp: 161–76.
[6] Birbaumer N., Ghanayim N, Hinterberger T, Iversen I, Kotchoubey B, Kübler A (1999), “A Spelling Device for the Paralysed”, Nature; 398, Pp: 297–8.
[7] Xing-Yu WANG, Jing JIN, Yu ZHANG and Bei WANG (2013), “Brain Control: Human-Computer Integration Control Based on Brain-computer Interface Approach”,
Acta Automatica Sinica, Vol. 39, No. 3, 208–221. http://doi.org/10.1016/S1874-1029(13)60023-3.
Interfaces: Current Trends and Applications”, Springer International Publishing, Switzerland.
[9] Lopes da Silva F. H., Gonçalves S. I. and De Munck J. C. (2009), “Electroencephalography (EEG)”, Encyclopedia of neuroscience, Academic Press, pp. 849–855.
[10] Lotte, F., Bougrain, L. and Clerc, M. (2015), “Electroencephalography (EEG)-Based Brain Computer Interfaces”, Wiley Encyclopedia of Electrical and Electronics Engineering, Pp. 44.
[11] Aborisade, D.O, Ojo, J.A., and Amole, A.O. (2014a), “Application of Fuzzy-MLP Model to Ultrasonic Liver Image Classification”, European Scientific Journal April 2014 edition vol.10, No.12 ISSN: 1857 – 7881 (Print) e - ISSN 1857- 7431.
[12] Aborisade, D.O., Ojo, J. A., Amole, A.O, Durodola A.O. (2014b), “Comparative Analysis of Textural Features Derived from GLCM for Ultrasound Liver Image Classification”, International Journal of Computer Trends and Technology (IJCTT) – volume 11 number 6, ISSN: 2231-5381, http://www.ijcttjournal.org.
[13] Ahn, M., and Chan, S. (2015), “Performance Variation in Motor Imagery Brain Computer Interface: A Brief Review”,
Journal of Neuroscience Methods, 243, Pp: 103–110. http://doi.org/10.1016/j.jneumeth.2015.01.033.
[14] Analoui M. and Fadava A. M. (2006), “Feature Reduction of Nearest Neighbor Classifiers Using Genetic Algorithm”,
World Academy of Science, Engineering and Technology, 17.
[15] Andrea K., Donatella M., Rüdiger R. and Michael T. (2013), “Facing the Challenge: Bringing Brain Computer Interfaces to End-Users”, Artificial Intelligence in Medicine 59, 55– www.elsevier.com/locate/aiim Guest Editorial.
[16] Niedermeyer, E., and Lopes da Silva, F. H. (2004), ‘‘Electroencephalography: Basic principles, Clinical Applications and Related Fields’’, 5th Ed. Lippincott Williams & Wilkins, Philadelphia.
[17] Noshadi S. and Es’haghi S. (2013), “Basic Information about BCI Systems”, Research Journal of Applied Sciences, Engineering and Technology, Vol. 5, No. 11, Pp: 3144-3151, ISSN: 2040-7459; e-ISSN: 2040-7467.
[18] Nunez P. L. and Srinivasan R. (2005), “Electrical Fields of the Brain: The Neurophysics of EEG”, New York: Oxford Univ. Press, 2005.
[19] Menon V. and Crottaz-Herbette S. (2005), “Combined EEG and fMRI Studies of Human Brain Function” International Review of Neurobiology, Vol. 66, 2005, Elsevier Inc. DOI: 10.1016/s0074-7742(05)66010-2 0074-7742/05. [20] Sanei S. and Chambers J.A (2008), “EEG Signal Processing”,
John Wiley & Sons.
[21] Sharanreddy M and Kulkarni P.K. (2011), “Review of Significant Research on EEG based Automated Detection of Epilepsy Seizures and Brain Tumor”, International Journal of Scientific & Engineering Research, Vol. 2, Issue 8, ISSN 2229-5518, http://www .ijser.org.
[22] Rajendra A.U., Vinitha S.S., Swapna G, Roshan J. M. and Jasjit S.S. (2013), “Automated EEG Analysis of Epilepsy: A Review”, Knowledge-Based Systems, Elsevier, 45, Pp:
147–165.
[23] Ramadan, R. A., Refat, S., Elshahed, M. A., and Ali, R. A. (2015), “Basics of Brain Computer Interface”, Intelligent Systems Reference Library 74, Springer International Publishing Switzerland, Pp: 31–51,
DOI 10.1007/978-3-319-10978-7_231.
[24] Ramesh S., (1999), “Methods to Improve the Spatial Resolution of EEG”, International Journal of Bioelectromagnetism, Vol. 1, No. 1, Pp: 102-111, www.tut.fi/ijbem/.
[25] Bradshaw L. A. and Wikswo J. P. (2001), “Spatial Filter Approach for Evaluation of the Surface Laplacian of the Electroencephalogram and Magnetoencephalogram”, Annals of Biomedical Engineering, Vol. 29, Pp. 202–213, USA. [26] Tandonnet C., Burle B., Hasbroucq T. and Vidal F. (2005),
“Spatial Enhancement of EEG Traces by Surface Laplacian Estimation: Comparison between Local and Global Methods”,
Clinical Neurophysiology 116, Pp: 18–24, www.elsevier.com/locate/clinph.
[27] Ferree T. C., Clay M. T. and Tucker D. M. (2001), “The Spatial Resolution of Scalp EEG”, Neurocomputing. [28] Freeman, W. J., Holmes, M. D., Burke, B. C., and Vanhatalo,
S. (2003), “Spatial Spectra of Scalp EEG and EMG from Awake Humans”, Clin. Neurophysiol. 114, 1053–1068. [29] Indu S. S., Guru K. K. and Santosh K. M. (2012), “Desired
EEG Signals For Detecting Brain Tumor Using LMS Algorithm And Feedforward Network” International Journal of Engineering Trends and Technology, Vol. 3 Issue 6, ISSN: 2231-5381, Page 718.
[30] Murugesan M. and Sukanesh R. (2009), “Towards Detection of Brain Tumor in Electroencephalogram Signals using Support Vector Machines”, International Journal of Computer Theory and Engineering, Vol. 1, No. 5, Pp: 1793-8201.
[31] Richard F.T. and Michael M.P. (1974), “Bioelectric Recording Techniques Part Â: Electroencephalography and Human Brain Potentials”, Academic Press, New York and London.
[32] Geva, A. B., and Kerem, D. H. (1998), “Forecasting Generalized Epileptic Seizures from the EEG Signal by Wavelet Analysis and Dynamic Unsupervised Fuzzy Clustering”, IEEE Trans Biomed Eng, Vol. 45, No. 10, Pp: 1205-1216.
[33] Lehmann D (1990), “Brain Electric Microstates and Cognition: The Atoms of Thought”, In: John ER, Vol. Machinery of the Mind, Birkhuser, Boston, pp 209-224. [34] He B. and Liu Z. (2008), “Multimodal Functional
Neuroimaging: Integrating Functional MRI and EEG/MEG”
IEEE Reviews in Biomedical Engineering, Vol. 1, 23. [35] Justin C. S. and José C. P. (2007), “Brain–Machine Interface
Engineering”, Morgan & Claypool Publishers series, ISSN 1930-0336 electronic,
DOI: 10.2200/S00053ED1V01Y200710BME017.
[36] Wang X Y. (2002), “Automatic Control: Virtuality vs. Reality”, Acta Automatica Sinica, 28 (Suppl): Pp: 77−84.
Processing”, Biological and Medical Physics, Biomedical Engineering, DOI: 10.1007/978-3-642-15816-2
1,c_Springer-Verlag Berlin Heidelberg 2011.
[38] Wu Qui, Feng Xiao, Xin Yang, Xuming Zhang, Ming Yuchi and Mingyue Ding (2011), “Research on Fuzzy Enhancement in the Diagnosis of Liver Tumor from B-mode Ultrasound Images”, I.J. Image, Graphics and Signal Processing, 3, Pp 10 – 16.
[39] Abdulhamit S., Kemal K.M., Ahmet A. and Etem K. (2005), “Neural Network Classification of EEG Signals by using AR With MLE Preprocessing for Epileptic Seizure Detection”,
Mathematical and Computational Applications, Vol. 10, No. 1, pp. 57-70.
[40] Cichocki, A., Shishkin, S. L., Musha, T. and Leonowicz, Z. (2005), “EEG Filtering Based on Blind Source Separation (BSS) for Early Detection of Alzheimer’s Disease”, Clinical Neurophysiology, 116, 729–737.
http://doi.org/10.1016/j.clinph.2004.09.017.
[41] Inan Gu¨ler and Elif Derya U¨ beyli (2007), “Multiclass Support Vector Machines for EEG-Signals Classification”,
IEEE Transactions on Information Technology in Biomedicine, Vol. 11, No. 2.
[42] Mohammad Z.P. and Manoranjan P. (2014), “Epileptic Seizure Detection by Analyzing EEG Signals using Different Transformation Techniques”, Neurocomputing, Elsevier, 145, Pp: 190–200.
[43] Mojtaba B., César A. T., Jalil R. and António D. (2015), “Epileptic Seizure Prediction using Relative Spectral Power Features” Clinical Neurophysiology, Elsevier, 126, 237–248, [44] Ghanbari, A. A., Broumandnia, A., Navidi, H., and Ahmadi,
A. (2012), “Brain Computer Interface with Genetic Algorithm”, International Journal of Information and Communication Technology Research, Vol. 2 No. 1, Pp: 79–86.
[45] Goyal, A., Samadani, A., Guerguerian, A. and Chau, T. (2016), “An Online Three-Class Transcranial Doppler Ultrasound Brain Computer Interface”, Neuroscience Research. http://doi.org/10.1016/j.neures.2015.12.013. [46] Guangyi C. (2014), “Automatic EEG Seizure Detection using
Dual-Tree Complex Wavelet-Fourier features”, Expert Systems with Applications, Elsevier, 41, Pp: 2391–2394. [47] Halder, S., Käthner, I. and Kübler, A. (2016), “Training Leads
to Increased auditory Brain Computer Interface Performance of End-users with Motor Impairments”, Clinical Neurophysiology, 127(2), 1288–1296.
http://doi.org/10.1016/j.clinph.2015.08.007.
[48] Song, Y. (2010). A new approach for epileptic seizure detection: sample entropy based feature extraction and extreme learning machine. Journal of Biomedical Science and Engineering, 03(June), 556–567.
http://doi.org/10.4236/jbise.2010.36078.
Gajic D, Djurovic Z., Di Gennaro S. and Fredrik G. (2014), “Classification of EEG signals for detection of epileptic seizures based on wavelets and statistical pattern recognition”, Biomedical Engineering: Applications, Basis and Communications, (26), 2, 1450021.
http://dx.doi.org/10.4015/S1016237214500215.
[49] Paulraj M.P., Subramaniam, K., Yaccob, S., Hamid, A., and
Hema C. R. (2013), “EEG Based Detection of Conductive and Sensorineural Hearing Loss using Artificial Neural Networks”, Journal of Next Generation Information Technology, Vol. 4, No. 3, Pp: 204–212.
http://doi.org/10.4156/jnit.vol4.issue3.24.
[50] Wang, Y.K., Chen S.A and. Lin C.T. (2014), “An EEG-Based Brain Computer Interface for Dual Task Driving Detection”,
Neurocomputing129 Pp: 85–93.
[51] Leuthardt, E. C., Schalk, G., Wolpaw, J. R., Ojemann, J. G., and Moran, D. W. (2004), “A Brain Computer Interface using Electrocorticographic Signals in Humans”, Journal of Neural Engineering1, 63–71.
http://doi.org/10.1088/1741-2560/1/2/001.
[52] Ashari, R. B., Al-bidewi, I. A. and Kamel, M. I. (2011), “Design and Simulation of Virtual Telephone Keypad Control Based on Brain Computer Interface ( BCI ) with Very High Transfer Rates”, Alexandria Engineering Journal, Vol.
50, No. 1, Pp: 49–56.
http://doi.org/10.1016/j.aej.2011.01.008.
[53] Dias, N. S., Mendes, P. M., and Correia, J. H. (2009), “Feature Selection for Brain-Computer Interface”, IFMBE Proceedings 22, pp. 318–321, www.springerlink.com © Springer-Verlag Berlin Heidelberg.
[54] Daly, I., Billinger, M., Laparra-hernández, J., Aloise, F., Lloria, M., Faller, J. Scherer R. and Müller-putz, G. (2013), “On the Control of Brain Computer Interfaces by Users with Cerebral Palsy”, Clinical Neurophysiology, Vol. 124, No. 9, Pp: 1787–1797.
[55] Cao, L., Li, J., Ji, H., and Jiang, C. (2014), “A Hybrid Brain Computer Interface System Based on the Neurophysiological Protocol and Brain-Actuated Switch for Wheelchair Control”,
Journal of Neuroscience Methods, 229, Pp: 33–43. [56] Kuo, C., Knight, J. L., Dressel, C. A., Chiu, A. W. L.,. (2012),
“Non-Invasive BCI for the Decoding of Intended Arm Reaching Movement in Prosthetic Limb Control”, American Journal of Biomedical Engineering, Vol. 2, No. 4, Pp: 155–162.
[57] Mousavi, E. A., Maller, J. J., Fitzgerald, P. B., and Lithgow, B. J. (2011), “Biomedical Signal Processing and Control Wavelet Common Spatial Pattern in Asynchronous Offline Brain Computer Interfaces”, Biomedical Signal Processing and Control, Vol. 6 No. 2, Pp: 121–128.
http://doi.org/10.1016/j.bspc.2010.08.003.
[58] Li, Y., and Wen, P. P. (2014), “Modified CC-LR Algorithm with Three Diverse Feature Sets for Motor Imagery Tasks Classification in EEG Based Brain Computer Interface”,
Computer Methods and Programs in Biomedicine, Vol. 113, No 3, Pp: 767–780.
[59] Lim, J., Lee, J., Hwang, H., Hwan, D., and Im, C. (2015), “Biomedical Signal Processing and Control Development of a Hybrid Mental Spelling System Combining SSVEP-Based Brain Computer Interface and Webcam-Based Eye Tracking”,
Biomedical Signal Processing and Control, 21, Pp: 99–104. http://doi.org/10.1016/j.bspc.2015.05.012.
[60] Hsu, W. (2015), “Telematics and Informatics Brain Computer Interface: The Next Frontier of Telemedicine in Human Computer Interaction”, Telematics and Informatics, 32(1), 180–192. http://doi.org/10.1016/j.tele.2014.07.001.
Event-Related Potentials in Non-Invasive Brain Computer Interface”, Pattern Recognition Letters, 66, Pp: 127–134. http://doi.org/10.1016/j.patrec.2015.01.015.
[62] Koo B., Leec H, Nama Y., Kang H., Kohd C., Shind H. and Choi S. (2015), “A Hybrid NIRS-EEG System for Self-paced Brain Computer Interface with Online Motor Imagery”,
Journal of Neuroscience Methods, 244, Pp: 26–32.
[63] Kumar, S., and Sahin, F. (2015), “A Framework for a Real Time Intelligent and Interactive Brain Computer Interface”,
Computers and Electrical Engineering, 43, Pp: 193–214. http://doi.org/10.1016/j.compeleceng.
[64] Liu, N. H., Chiang, C. Y., & Hsu, H. M. (2013), “Improving driver alertness through music selection using a mobile EEG to detect brainwaves”, Sensors (Basel, Switzerland), 13(7), 8199–8221. http://doi.org/10.3390/s130708199.
[65] Farid A. M, Reda A. E. and Mahmoud E.S. (2016), “A Novel Brain Computer Interface Based on Principle Component Analysis” Procedia Computer Science 82, Pp 49 – 56 www.sciencedirect.com.
[66] Suganthy, M. and Ramamoorthy P. (2012), “Principal Component Analysis Based Feature Extraction, Morphological Edge Detection and Localization for Fast Iris Recognition” Journal of Computer Science Vol. 8 No. 9, Pp: 1428-1433, ISSN 1549-3636.
[67] Matthew T. and Alex P. (1991), “Eigenfaces for Recognition”,
Journal of Cognitive Neuroscience, Vol.3, No. 1, Pp: 71-86. [68] Karhunen J. and Joutsensalo. J. (1995), “Generalization of
Principal Component Analysis, Optimization Problems and Neural Networks”, Neural Networks, Vol. 8, No. 4.
[69] Daugman, J.G., (1993), “High Confidence Visual Recognition of Persons by a Test of Statistical Independence”, IEEE Trans. Patt. Anal. Mach. Intell., 15: 1148-1161. [70] Jutten C., and Herault J., (1991), “Blind Separation of
Sources, Part I: an Adaptive Algorithm Based on Neuromimetic Architecture”, Signal Process. 24 Pp: 1–10. [71] Hyvarinen A. and Oja E. (2000), “Independent Component
Analysis: Algorithms and Applications”, Neural Networks Off. J. Int.Neural Network Soc.13, Pp: 411–430.
[72] Kohonen, T. and Somervuo, P (1998), “Self-Organizing Maps of Symbol Strings”, Neurocomputing 21, Pp: 19–30. [73] Konstantina S.N., Spyretta G., Ioannis A., John S.S.,
Ioannis V. and Nikolaos N.T. (2011), “Comparison of Multiresolution Features for Texture Classification of Carotid Atherosclerosis from B-mode Ultrasound”, IEEE Transactions on Information Technology in Biomedicine, Vol. 15, No. 1, Pp 130 – 137.
[74] Mark S. N. and Alberto S. A. (2002), “Feature Extraction and Image Processing”, Butterworth-Heinemann, Oxford, ISBN: 0 7506 5078 8.
[75] Menser B. and Muller F. (1999), “Face Detection in Color Images using Principal Component Analysis”, IEE Conference Publication, Vol.2, No. 465, Pp: 620-624.
[76] Mitchell, M., Holland, J.H. and Forrest, S. (1994), “When will a Genetic Algorithm Outperform Hill Climbing”, in Cowan, J.D., Tesauro, G., and Alspector, J. (editors)
Advances in Neural Information Processing Systems, Vol.: 6, 1994, Morgan Kaufmann Publishers, ISBN 1558603603, Pp. 51-58.
[77] Rezaei S., Tavakolian K, Nasrabadi A. M., and Setarehdan S. K. (2006), “Different Classification Techniques Considering Brain Computer Interface Applications”, Journal of Neural Engineering, 3:139-144.
[78] Tavakolian K., Vasefi F., Naziripour K. and Rezaei S. (2006), “Mental Task Classification for Brain Computer Interface Applications”, In Proceedings of the Canadian Student Conference on Biomedical Computing, 2006. [79] Shutao L., Kwok J.T., Zhu H. and Wang Y. (2003), “Texture
Classification using Support Vector Machine”, Pattern Recognition, Vol. 36, No. 12, Pp 2883 – 2893.
[80] Laine, A. and Fan, J., (1993), “Texture Classification via Wavelet Pattern Signatures” IEEE Transaction on PAMI, 15 (11) Pp. 1788-1191.
[81] Fukunaga K. (1990), “Introduction to Statistical Pattern Recognition”, Second Edition, Academic Press, USA. [82] Amit K. (2000), “Artificial intelligence and soft computing:
behavioral and cognitive modeling of the human brain”, CRC Press LLC, ISBN 0-8493-1385-6, New York.
[83] Bernhard S.K., Chris J.C., Burges F.G., Partha N., Tomaso Poggio and Vladimir Vapnik (1997) “Comparing Support Vector Machines with Gaussian Kernels to Radial Basis Function Classifiers” IEEE Transaction. Signal Processing. Vol. 45 No. 11. Pp 2758-2765.
[84] Daubechies I. (1988), “Orthonormal Bases of Compactly Support Wavelets”, Communication Pure and Applied MathematicsXLI, Vol. 41, Pp 909-996.
[85] Lu C.S., Chung. P. C. and Chen C. F. (1997), “Unsupervised Texture Segmentation via Wavelet Transform”, Pattern Recognition, Vol. 30, No. 5, Pp 729-742.
[86] Yasser M. Kadah, Aly A. Farag, Jacek M. Zurada, Ahmed M. Badawi and Abou-Bark M. Youssef (1996), “Classification Algorithms for Quantitative Tissue Characterization of Diffuse Liver Disease from Ultrasound Images”, IEEE Transaction on Medical Imaging, Vol. 15, No. 4.
[87] Sujana H., Swarnamani S. and Suresh S. (1996), “Application of Artificial Neural Networks for the Classification of Liver Lesions by Image Texture Parameters”, Ultrasound in Medicine and Biology, Vol. 22. No. 9, Pp. 1177-1181.
[88] Kumar S.S and Moni R.S. (2010), “Diagnosis of Liver Tumor from CT Images Using Fast Discrete Curvelet Transform”. IJCA Special Issue on “Computer Aided Soft Computing Techniques for Imaging and Biomedical Application.” Pp 1-6.