Materials Science and Engineering Publications
Materials Science and Engineering
5-8-2007
Modeling of Thermodynamic Properties and Phase
Equilibria for the Cu-Mg Binary System
Shihuai Zhou
Iowa State University, [email protected]
Yi Wang
Pennsylvania State University
Frank G. Shi
University of California - Irvine
Ferdinand Sommer
Max-Planck-InstituteLong-Qing Chen
Pennsylvania State UniversitySee next page for additional authors
Follow this and additional works at:
http://lib.dr.iastate.edu/mse_pubs
Part of the
Metallurgy Commons
The complete bibliographic information for this item can be found at
http://lib.dr.iastate.edu/
mse_pubs/165
. For information on how to cite this item, please visit
http://lib.dr.iastate.edu/
howtocite.html
.
Modeling of Thermodynamic Properties and Phase Equilibria for the
Cu-Mg Binary System
Abstract
The phase equilibria associated with the binary Cu-Mg system are analyzed by applying results from
first-principles calculations to a general solution thermodynamics treatment. Differing from previously reported
models, we employ a four-species association model for the liquid, while the terminal and intermediate solid
phases are modeled as substitutional solutions with one or two sublattices, respectively. The zero-
Kelvin
enthalpies of formation for the intermediate compounds, Cu
2Mg-C15 (
cF24
) and CuMg
2-C
b(
oF48
) are
computed using the Vienna Ab-initio Simulation Package (
VASP
). The Gibbs free energy functions for the
individual phases are evaluated, and the resulting binary phase diagram is presented over the full composition
range. While the phase diagram we propose exhibits only modest deviation from previously reported models
of phase equilibria, our treatment provides better agreement with experimental reports of heat capacity and
enthalpy of mixing, indicating a more self-consistent thermodynamic description of this binary system.
Keywords
Ames Laboratory, Materials and Engineering Physics
Disciplines
Metallurgy
Comments
This article is from
Journal of Phase Equilibria and Diffusion
28 (2007): 158,
doi:10.1007/s11669-007-9022-0
.
Posted with permission.
Rights
Copyright 2007 ASM International. This paper was published in Journal of Phase Equilibria and
Dristribution, Vol. 28, Issue 2, pp. 158-166 and is made available as an electronic reprint with the permission
of ASM International. One print or electronic copy may be made for personal use only. Systematic or multiple
reproduction, distribution to multiple locations via electronic or other means, duplications of any material in
this paper for a fee or for commercial purposes, or modification of the content of this paper are prohibited.
Authors
Shihuai Zhou, Yi Wang, Frank G. Shi, Ferdinand Sommer, Long-Qing Chen, Zi-Kui Li, and Ralph E.
Napolitano
Modeling of Thermodynamic Properties and Phase
Equilibria for the Cu-Mg Binary System
Shihuai Zhou, Yi Wang, Frank G. Shi, Ferdinand Sommer, Long-Qing Chen, Zi-Kui Liu and Ralph E. Napolitano
(Submitted November 2, 2006)
The phase equilibria associated with the binary Cu-Mg system are analyzed by applying results from first-principles calculations to a general solution thermodynamics treatment. Differing from previously reported models, we employ a four-species association model for the liquid, while the terminal and intermediate solid phases are modeled as substitutional solutions with one or two sublattices, respectively. The zero-Kelvin enthalpies of formation for the intermediate compounds, Cu2Mg-C15 (cF24) and CuMg2-Cb(oF48) are computed using the Vienna Ab-initio
Simulation Package (VASP). The Gibbs free energy functions for the individual phases are evaluated, and the resulting binary phase diagram is presented over the full composition range. While the phase diagram we propose exhibits only modest deviation from previously reported models of phase equilibria, our treatment provides better agreement with experimental reports of heat capacity and enthalpy of mixing, indicating a more self-consistent thermodynamic description of this binary system.
Keywords thermodynamics, phase diagram, phase equilibria
1. Introduction
Given the promising mechanical, chemical, and magnetic properties of various metallic glasses and the potential widespread use of the so-called ‘‘bulk metallic glasses’’,[1-4] much recent attention has been given to the development of our general understanding of the thermodynamics and kinetics for glass formation and glass forming ability.[5] While alloys exhibiting promising glass formation tendency are frequently ternary, quaternary, or higher order sys-tems,[1-4]several binary glass-forming metallic alloys have been identified. Of these, the Al-based alloys have been investigated most thoroughly.[6]In addition, glass formation has been identified in several other binary systems,[7-12] most notably including Cu-Mg,[7] Pd-Si,[8,9] and Cu-Zr.[8] By virtue of their simplicity compared with their many-component counterparts, these binary alloys present us with an opportunity to investigate the detailed relationship between the thermodynamic descriptions of relevant phase
equilibria and observed glass-forming behavior. It is in this vein that the present thermodynamic analysis of the Cu-Mg binary system is motivated. In a subsequent paper, we will model the thermodynamic properties of the undercooled liquid and examine more closely the implications regarding glass formation tendency, with respect to the competing crystalline phases.
Thermodynamic models for the binary Cu-Mg system have been offered by Coughanowr et al.[13]and by Zou and Chang.[14] While these treatments are well posed and have resulted in phase diagrams that agree well with experimental reports, there are three specific features of the modeling approaches that limit their potential applicability to more general phase stability problems. First, in each of these treatments, the liquid phase is modeled as a regular solution, a model that cannot describe the chemical ordering observed in this system. For example, X-ray diffraction experiments reported by Lukens and Wagner[15]indicate the existence of chemical short range order in the liquid phase with Cu2Mg
and CuMg2 stoichiometries. This discrepancy is clearly
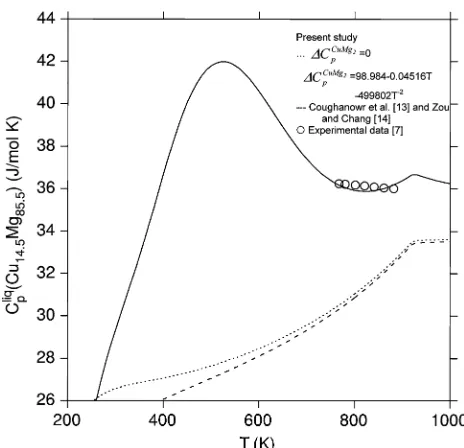
observed in the inability of these models to accurately describe the heat capacity of the undercooled liquid, as shown in Fig. 1. Second, these previous models treat the Mg2Cu-Cb as a stoichiometric compound, precluding any
description of nonequilibrium compositions for these phases. Finally, the models constrain the temperature dependence of the Gibbs free energy of this phase to be linear, implying that there is no contribution to the heat capacity from chemical mixing. Consequently, while the equilibrium phase diagram produced from these models may be useful, more fundamental thermodynamic quantities associated with these models, such as the heat capacity, do not agree well with experimental measurements, such as those reported by Feufel and Sommer.[16]
In the work presented here, we address each of these limitations within the framework of a general
CAL-Shihuai Zhou, Yi Wang, Long-Qing Chen, and Zi-Kui Liu,
Department of Materials Science and Engineering, The Pennsylvania State University, University Park, PA 16802, USA; Frank G. Shi,
Department of Chemical Engineering and Materials Science, Uni-versity of California, Irvine, CA 92697, USA;Ferdinand Sommer,
Max-Planck-Institute for Metals Research, Heisenbergstraße 3, D-70569 Stuttgart, Germany;Shihuai ZhouandRalph E. Napolitano,
Materials & Engineering Physics Program, Ames Laboratory, USDOE, Ames, IA, USA; Ralph E. Napolitano, Department of Materials Science and Engineering, Iowa State University, 116 Wilhelm Hall, Ames, IA, USA. Contact e-mail: [email protected]
PHAD[17,18] formulation by (i) employing an association model capable of describing the nonlinear temperature dependence of chemical short range order in the liquid phase and (ii) treating the intermetallic phases as substitu-tional solid solutions on two sublattices, permitting quan-tification of the Gibbs free energies of the intermetallic phases at non-stoichiometric compositions. In addition, we incorporate first-principles calculations to compute the zero-Kelvin energies of end-member phases in unstable struc-tures, since experimental data are not available for these phases. Remaining model parameters, describing the Gibbs free energies associated with the formation of compounds or solution phases, are determined through a systematic semi-empirical optimization, employing available experimental data from calorimetry, X-ray diffraction, electron-probe microchemical analysis, and optical micrography.[7,16,19-40] The resulting thermodynamic properties and the associated equilibrium phase diagram are compared with the prior thermodynamic modeling reported by Coughanowr et al.[13] and by Zou and Chang.[14]
2. Thermodynamic Models
We describe the phase equilibria in the Cu-Mg binary system by modeling the Gibbs free energy for each relevant phase over the appropriate range of composition at constant pressure (1 atm). In any case where a temperature depen-dent parameter (P) is required, we use the general form, PðTÞ ¼aþbTþcT ln TþdT2þeT1þfT3þgT7þhT9
ðEq 1Þ
The thermodynamic properties of pure Cu and Mg in various structures are computed using the parameters from the SGTE database.[41]The liquid phase is described with an association model.[42,43] The terminal fcc and hcp solid solutions are treated with a single lattice while intermediate phases are described using a two-sublattice model,[44]where each sublattice is treated as a regular solution. In the following sections, the thermodynamic treatment of each phase is described in detail.
2.1 The Liquid Phase
We employ a four-species association model,[42,43]where Cu2Mg and CuMg2are chosen as the relevant intermediate
chemical associates.[15] Thus, the Gibbs free energy of the liquid phase is given by
Gliqm ¼X
i
xiGliqi þRT
X
i
xiln xiþ
X
i
X
j > i
xixjLliqi;j;
ði;j¼Cu;Cu2Mg;CuMg2;MgÞ ðEq 2Þ
wherexiandGliqi denote the mole fraction and molar Gibbs free energy for the ith species in the liquid phase, respectively, and where we have considered only pair-wise interaction between species. The Gibbs free energy of the intermediate associates, CumMgn, are given as
Gliq
CumMgn¼m
Gliq Cuþn
Gliq MgþDG
liq
CumMgn; ðEq 3Þ
where DGliqCumMg
n represents the Gibbs free energy of formation. Substituting Eq 3 into Eq 2, the Gibbs free energy of the liquid phase is written as
Gliqm¼ðxCuþ2xCu2MgþxCuMg2Þ Gliq
Cu
þðxMgþxCu2Mgþ2xCuMg2Þ Gliq
Mg
þxCu2MgDG
liq
Cu2MgþxCuMg2DG
liq CuMg2
þRTðxCulnxCuþxCu2MglnxCu2MgþxCuMg2lnxCuMg2
þxMglnxMgÞþxCuxCu2Mg Lliq
Cu;Cu2MgþxCuxCuMg2 Lliq
Cu;CuMg2
þxCuxMgLliqCu;MgþxCuMg2xCu2Mg Lliq
CuMg2;Cu2Mg
þxMgxCu2Mg Lliq
Cu2Mg;MgþxMgxCuMg2 Lliq
CuMg2;Mg ðEq 4Þ
The interaction energies ðLliqi;jÞ are described here as constants, while the Gibbs free energies of formation
ðDGliqCumMg
n) are described as functions of temperature, using the form given in Eq 1. Where sufficient heat capacity data are available, the parameters a)e are used. Otherwise, we employ only parametersa and b. This will be discussed in further detail in a subsequent section.
2.2 Terminal fcc and hcp Phases
The fcc and hcp phases are treated as simple binary substitutional solutions with Gibbs free energies expressed as
GUm¼
X
i¼Cu;Mg
xiG
U
i þRT
X
i¼Cu;Mg
xi ln xiþxsGUm ðEq 5Þ
Fig. 1 The heat capacity of the liquid Cu14.5Mg85.5alloy
calcu-lated using the parameters in Tables 2-4
Basic and Applied Research: Section I
[image:4.594.49.281.56.280.2]where xi denotes mole fraction of element i, and
GU
iði¼Cu, MgÞdenotes the molar Gibbs free energy of the pure element i with the structure UðU¼fcc or hcpÞ. The excess Gibbs free energyxsGUm is expressed as,
xsGU
m¼xCuxMg
Xn
j¼0
jLU
Cu;MgðxCuxMgÞj ðEq 6Þ
where the jLU
Cu;Mg coefficients are left as interaction parameters to be evaluated with experimental data. Here, we consider only thej= 0 term and assume thatLU
Cu;Mg is constant (i.e., a regular solution).
2.3 Intermediate Cu2Mg-C15 and Mg2Cu-CbPhases
Using a two-sublattice model, we describe each inter-mediate compound as a solid solution of the form (Cu,Mg)2(Cu,Mg)1. The Gibbs free energy is given as
Ghm¼ X
i¼Cu;Mg
yIi X
j¼Cu;Mg
yIIjGhi:jþRT X
i¼Cu;Mg
ð2yIi ln yIiþyIIi ln yIIiÞ þxsGh
m ðEq 7Þ
where the colon separates the components on different sublattices, andyIand yIIare the sublattice site occupancy fractions. The superscript, h, represents the Cu2Mg-C15 or
Mg2Cu-Cbstructure.
With the sublattice description we have adopted, each of the two structures (C15 and Cb) can assume four different
stoichiometries (Cu2Cu, Mg2Cu, Cu2Mg, and Mg2Mg),
with only one being that of the stable compound. These are Cu2Mg-C15 and Mg2Cu-Cb, and, for these compounds, we
expressGC15Cu:Mg andGCb
Mg:Cuusing the form given in Eq 1 and evaluate the related coefficients using available enthalpy of formation, melting temperature, and heat capacity data, as discussed in a subsequent section. For the unstable compounds (i.e., Cu2Cu-C15, Mg2Cu-C15, Mg2Mg-C15,
Cu2Cu-Cb, Cu2Mg-Cb, and Mg2Mg-Cb), there are no
available heat capacity data with which to evaluate the coefficients c-g. Therefore, we express the Gibbs free energy as
Gh
i:j¼2G
ref
i þG
ref
j þDG
h
i:j; ði;j¼Cu;MgÞ ðEq 8Þ
where Gref
i and Grefj are the molar Gibbs free energy of either fcc-Cu or hcp-Mg, andDGh
i:jis the Gibbs free energy of formation for the compound (i)2(j)1 from the 2(i) + (j)
mixture, which we treat as a constant. The excess Gibbs free energy term in Eq 7 is modeled as,
xsGh
m¼yICuyIMg
X
i¼Cu;Mg
yII i
X
k¼0
kLh
Cu;Mg:iðyICuyIMgÞ
k
þyIICuiyIIMg X
i¼Cu;Mg
yIiX
k¼0
kLh
i:Cu;Mgðy
II
Cuy
II
MgÞ
k
ðEq 9Þ
Once again, we consider only thek= 0 term in each inner sum, and assume thatLhis a constant.
2.4 Calculation of Zero-Kelvin Enthalpies from First Principles
To facilitate the determination of the Gibbs free energy of formation for the intermediate compound phases, we compute the enthalpy of formation for the end-members at zero Kelvin. For these calculations, we employ the VASP[45] implementation of the plane wave method using the Vanderbilt ultrasoft pseudopotential[46] with a generalized gradient approximation (GGA).[47] The Monkhost 15·15·15kpoints are employed for high precision calcu-lations. The 3s3p and 3d4s4p shells are treated as valence states with core radii of 2.88 a.u. and 2.48 a.u. for the hcp-Mg and fcc-Cu, respectively. To ensure that the unit cell corresponds to a stable structure, we fully relax the cell shape and the internal atomic coordinates of the stable end-members of the compounds and relax only the cell volumes of those end-members which are unstable.
The enthalpy of formation, DHf/, of a compound u is calculated as the difference between the energy of the compound and the linear combination of the energies of the pure elements in their reference states,
DHf/¼E/x/CuECufccx
/
MgE hcp
Mg; ðEq 10Þ
where x/i is the mole fraction of component i in the /
structure. The values ofE/;Efcc Cu; andE
hcp
Mg are the computed zero-Kelvin energies of the indicated phases, each consid-ered here to be stoichiometric. The calculated results are listed in Table 1 and compared with experimental data. Again, we note here that for the stable phases (Cu2Mg-C15
and Mg2Cu-Cb), both experimental and first-principles data
are considered in our evaluation of thermodynamic param-eters. For the unstable intermetallic phases (D Hf> 0),
however, experimental data are not attainable and the zero-Kelvin energies become essential in assessing the relative stability of these compounds. The determination of model parameters is discussed in the next section.
3. Determination of the Thermodynamic Model
Parameters
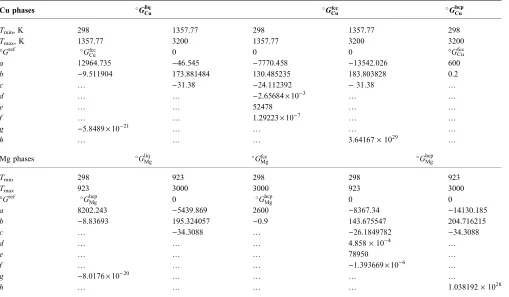
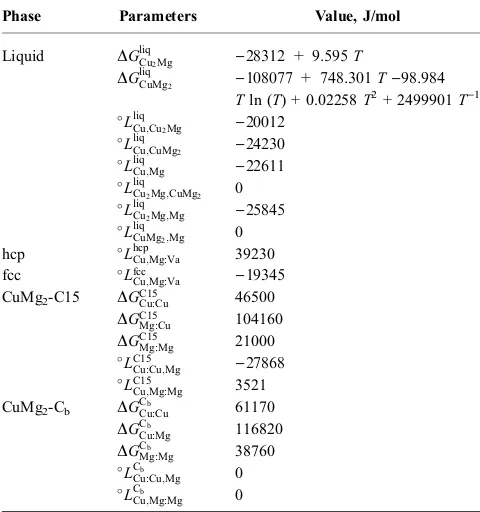
Expressions for the standard Gibbs free energyðG/
iÞof each pure component in the relevant phases are taken from the SGTE database[41] as listed in Table 2. In addition, based on the models described in the preceding sections, we compute a standard Gibbs free energy for each of the two intermediate compounds and evaluate the parameters, as listed in Table 3. For the relevant excess Gibbs free energies, we employ a total of eight Gibbs free energy of formation terms and 12 interaction parameters (four of which we assume to be equal to zero). These are listed in Table 4, along with the results from our parameter evalu-ation. In the present section, the methodology used for determination of the parameters listed in Tables 3 and 4 is discussed.
For the liquid phase, we evaluate the parameters
DGliqCumMg
n and
Lliq
i;j, from Eq 2-3, using reported values of activity,[33] chemical potential,[30-35] and enthalpy of mixing.[29,30] Initially we model DGliqCumMg
n using only the first two terms in Eq 1 (i.e.,aþbT). This treatment, shown in Fig. 1, yields a heat capacity for Cu15.5Mg84.5liquid that
is slightly higher than the models of Coughanowr et al.[13] and Zou and Chang,[14] but one that remains much lower than the reported experimental data.[7] We assert that this
[image:6.594.44.556.75.250.2]apparent excess heat capacity may be due to chemical (and perhaps structural) ordering in the liquid phase over this range of temperatures. Accordingly, we describe the asso-ciated nonlinear temperature dependence by fitting the parameters c-e in Eq 1 for DGliqCuMg2. The evaluated results are listed in Table 4 and the corresponding heat capacity is also plotted in Fig. 1, where a maximum in theCp(T) curve is exhibited. We note that such maxima inCpliq(T) have been observed in a number of systems (e.g., toluene, Au-Si, Table 1 A summary of the results from the first-principles calculations
Phase Formula
DH, kJ/mol of atoms
First principles Modeling Experiment
0 K 298 K
Cu-fcc Cu 0 … …
Mg-hcp Mg 0 … …
Cu2Mg-C15 Cu2Cu 15.5 15.5 …
Cu2Mg )15.72 )11.4 )11.3
[36]
)8.04[37]
CuMg2 34.72 34.72 …
Mg2Mg 7.00 7.00 …
CuMg2-Cb Cu2Cu 20.39 20.39 …
Cu2Mg 38.94 38.94 …
CuMg2 )13.20 )9.6 )9.55
[36]
Mg2Mg 12.92 12.92 …
Table 2 The thermodynamic parameters for pure Cu and Mg[41]
Cu phases Gliq
Cu G
fcc
Cu G
hcp Cu
Tmin, K 298 1357.77 298 1357.77 298
Tmax, K 1357.77 3200 1357.77 3200 3200
Gref Gfcc
Cu 0 0 0 GCu
fcc
a 12964.735 )46.545 )7770.458 )13542.026 600
b )9.511904 173.881484 130.485235 183.803828 0.2
c … )31.38 )24.112392 )31.38 …
d … … )2.65684·10)3
… …
e … … 52478 … …
f … … 1.29223·10)7
… …
g )5.8489·10)21 … … … …
h … … … 3.64167·1029
…
Mg phases GliqMg GfccMg
Ghcp Mg
Tmin 298 923 298 298 923
Tmax 923 3000 3000 923 3000
Gref GhcpMg 0 GhcpMg 0 0
a 8202.243 )5439.869 2600 )8367.34 )14130.185
b )8.83693 195.324057 )0.9 143.675547 204.716215
c … )34.3088 … )26.1849782 )34.3088
d … … … 4.858·10)4
…
e … … … 78950 …
f … … … )1.393669·10)6
…
g )8.0176·10)20 … … … …
h … … … … 1.038192·1028
Note:Gh
i ¼GrefþaþbTþcT ln TþdT2þeT1þfT3þgT7þhT9(J/mol)
Basic and Applied Research: Section I
[image:6.594.47.556.284.581.2]As2Se3,[48] La20Mg50Ni30, Al30La50Ni20, Al7.5Cu
17.5-Ni10Zr65,[49] Al7.5Cu27.5Zr65,[50]) again suggesting some
type of clustering/ordering reaction in the liquid phase. The interaction parameter for each of the terminal solid solution phases is determined from experimental estimates of the respective solidus and solvus boundaries, where the solubility of Cu in the hcp-Mg phase has been reported to be 0.15, 0.23, and 0.23 at.% by Hansen,[25] Stepanov and Kornilov,[26] and Yue and Pierre,[27] respectively. The resulting interaction parameter for the hcp solution phase is high and positive, as listed in Table 4. For the fcc solid solution, the interaction parameter listed in Table 4 is determined from the fcc phase boundary data reported by Jones[22]and Rogelberg.[23]
Regarding the intermediate compounds and the evalua-tion of coefficients in the expressions for GC15
Cu:Mg and
GCb
Mg:Cu, as in Eq 1 and 7, we require experimental or theoretical values for heat capacity, enthalpy of formation, and melting temperature. The parameters that contribute to the heat capacity (i.e., coefficients c-f in Eq 1 are evaluated using the experimental results of Feufel and Sommer,[16] recognizing that, above their melting temperatures, the heat capacities of the Cu2Mg-C15 and Mg2Cu-Cbphases should
approach that of the liquid phase, as given by the SGTE model.[41]The available enthalpy of formation data include only the stable Cu2Mg-C15 and Mg2Cu-Cbphases. They are
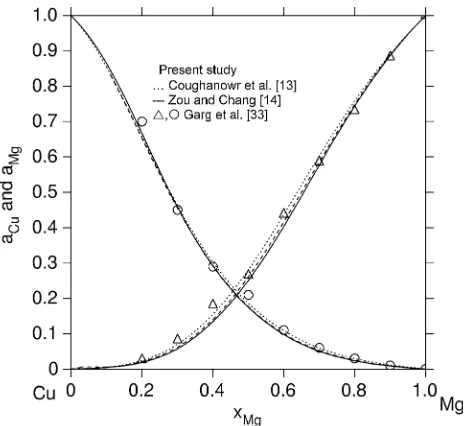
listed in Table 1 along with our first principles calculations, which include these phases as well as the unstable compounds for which experimental data are not available. In addition, we consider the electromotive force (EMF) measurements of activity and chemical potential, reported by Arita et al.[38] and Eremenko et al.[39] for the Cu-Mg binary system. These are shown in Fig. 2 and compared with the values of chemical potential associated with our first principles calculations and with experimental measure-ments of DHf.[36,37] In this figure, the fcc/Cu2Mg-C15
coexistence curve suggests that the experimental values reported by King and Kleppa[36]may be the most accurate, since they exhibit excellent agreement with the EMF data of Eremenko et al.[39] Based on this selection and the heat capacity considerations discussed above, the coefficients listed in Table 3 forGC15
Cu:Mgand
GCb
Mg:Cuare evaluated with the corresponding experimental data.[16,21,22,24,36,38,39] Finally, the two interaction parameters for the Cu2Mg-C15
phase ðLC15
[image:7.594.46.286.96.245.2]Cu:Cu;Mg and LC15Cu;Mg:MgÞ are evaluated using available phase equilibrium data.[20-24] The Gibbs free Table 3 Ground state standard Gibbs free energy
parameters for the intermetallic phases Cu2Mg-C15
and Mg2Cu-Cb
Gih:j GCu:MgC15 , J/mol
GCb
Mg:Cu, J/mol
Tmin, K 298 1070 298 850
Tmax, K 1070 … 850 …
Gref 0 0 0 0
a )58201 )64662.18 )53491 )58610.6334
b 409.642 490.7029614 425.428 481.9243846
c )76.1 )87.17102875 )77.9913484 )85.33353573
d )9.9·10)4 … 2.31·10)3 …
e 183906 … 190378 …
f )1.35·10)6 … )2.72115·10)6 …
g … … … …
[image:7.594.45.285.288.544.2]h … … … …
Table 4 Excess Gibbs free energy parameters (all temperatures)
Phase Parameters Value, J/mol
Liquid DGliqCu2Mg )28312 + 9.595T
DGliqCuMg2 )108077 + 748.301T)98.984 Tln (T) + 0.02258T2+ 2499901T)1 Lliq
Cu;Cu2Mg )20012
Lliq
Cu;CuMg2 )24230
Lliq
Cu;Mg )22611
Lliq
Cu2Mg;CuMg2 0
Lliq
Cu2Mg;Mg )25845
Lliq
CuMg2;Mg 0
hcp LhcpCu;Mg:Va 39230 fcc Lfcc
Cu;Mg:Va )19345 CuMg2-C15 DGC15Cu:Cu 46500
DGC15
Mg:Cu 104160
DGC15
Mg:Mg 21000
LC15
Cu:Cu;Mg )27868 LC15
Cu;Mg:Mg 3521 CuMg2-Cb DGCCu:Cub 61170
DGCb
Cu:Mg 116820
DGCb
Mg:Mg 38760
LCb
Cu:Cu;Mg 0 LCb
Cu;Mg:Mg 0
Fig. 2 The chemical potential of Mg associated with the indi-cated two-phase equilibrium, plotted over the relevant tempera-ture range for the Cu-Mg system. The solid curves are computed and compared with prior modeling and experiment. The refer-ence states are fcc-Cu and hcp-Mg
[image:7.594.311.547.426.652.2]energy of formation,DGh
i:j, for each unstable end-member in Eq 8, is treated as a constant and determined using the first-principles data in Table 1. The parameter assessment
practice is iterative and culminates with an optimized fit involving all selected data and calculation results. The final parameters from the overall optimization are listed in Tables 3 and 4.
4. Phase Equilibrium Results
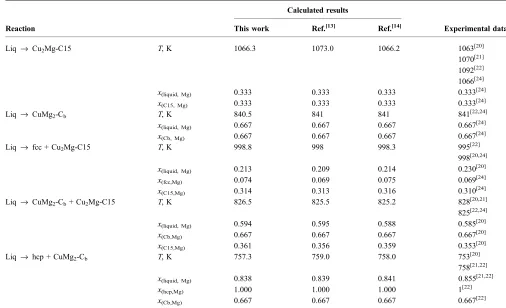
[image:8.594.41.547.406.714.2]The phase diagram yielded by our modeling effort is shown in Fig. 3 along with previously proposed phase diagrams and relevant experimental data. In Table 5, the invariant reactions are compared with experimental re-ports[20-22]and with the models of Coughanowr[13]and Zou and Chang.[14] We note that the equilibrium phase bound-aries produced by our model do not differ significantly from prior reports, except that our results may exhibit slightly better agreement with experimental liquidus and solidus data for the terminal solution phases. However, there are several important features of our thermodynamic description of this binary system that do differ substantially from previously reported models but are not dramatically evident in the equilibrium phase diagram itself. These differences primarily arise from (i) the use of chemical associates in our treatment of the liquid, (ii) our two-sublattice solution description of the intermediate phases, and (iii) inclusion of non-linear temperature dependent free energies of forma-tion, all of which offer improvements over prior treatments
Table 5 Invariant reactions in the Cu-Mg system
Reaction
Calculated results
Experimental data This work Ref.[13] Ref.[14]
Liq fi Cu2Mg-C15 T, K 1066.3 1073.0 1066.2 1063[20]
1070[21] 1092[22]
1066[24]
x(liquid, Mg) 0.333 0.333 0.333 0.333[24]
x(C15, Mg) 0.333 0.333 0.333 0.333[24]
Liq fi CuMg2-Cb T, K 840.5 841 841 841
[22,24]
x(liquid, Mg) 0.667 0.667 0.667 0.667[24]
x(Cb, Mg) 0.667 0.667 0.667 0.667
[24]
Liq fi fcc + Cu2Mg-C15 T, K 998.8 998 998.3 995[22]
998[20,24]
x(liquid, Mg) 0.213 0.209 0.214 0.230[20]
x(fcc,Mg) 0.074 0.069 0.075 0.069[24]
x(C15,Mg) 0.314 0.313 0.316 0.310[24]
Liq fi CuMg2-Cb+ Cu2Mg-C15 T, K 826.5 825.5 825.2 828[20,21]
825[22,24]
x(liquid, Mg) 0.594 0.595 0.588 0.585[20]
x(Cb,Mg) 0.667 0.667 0.667 0.667
[20]
x(C15,Mg) 0.361 0.356 0.359 0.353[20]
Liq fi hcp + CuMg2-Cb T, K 757.3 759.0 758.0 753
[20]
758[21,22]
x(liquid, Mg) 0.838 0.839 0.841 0.855[21,22]
x(hcp,Mg) 1.000 1.000 1.000 1[22]
x(Cb,Mg) 0.667 0.667 0.667 0.667[22]
Fig. 3 The Cu-Mg phase diagram calculated using the parame-ters listed in Tables 2-4, shown with the relevant experimental data
Basic and Applied Research: Section I
and permit the quantitative description of thermodynamic parameters for both undercooled liquids and nonequilibrium compositions of the intermetallic phases.
Figures 4 and 5 show that there is little difference between prior models and ours with regard to quantification of chemical potential of the liquid phase over the full range of composition at 1100 K and 1200 K. However, Fig. 6 shows that our model provides much better agreement with
the experimental measurements of enthalpy of mixing for the liquid phase, as reported by Sommer et al.[29] This feature is essential if driving forces for various phase transitions involving both equilibrium and nonequilibrium compositions of the relevant phases are to be computed accurately and compared. In addition, we employ the temperature-dependent description given in Eq 1 for the Gibbs free energy of Cu2Mg-C15 and Mg2Cu-Cbrather than
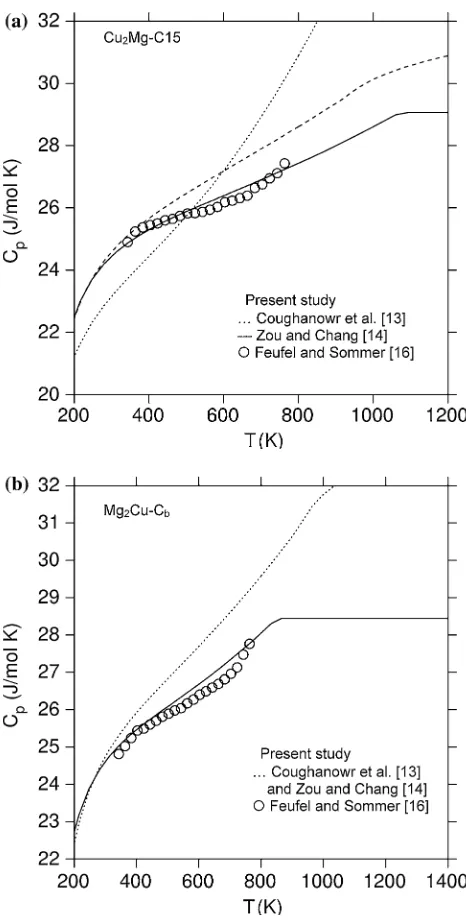
the simpler description used in earlier reports.[13,14] As a result, it is clear from Fig. 7 that our description reproduces the experimental heat capacity data[16] far better than previously reported models.[13,14] In addition, the modeled melting enthalpies for Cu2Mg-C15 and Mg2Cu-Cbare listed
in Table 6, where our results show better agreement with the experimental data for these phases[16]than those reported by Coughanowr et al.[13] and Zou and Chang.[14] Finally, for the purpose of further direct comparison, we include in Fig. 1 our modeling results for the heat capacity of the Cu14.5Mg85.5liquid, showing the dramatic improvement in
[image:9.594.309.545.57.271.2]low-temperature heat capacity compared to the models by Coughanowr et al.[13] and Zou and Chang.[14]
Table 6 The melting enthalpies of the compounds Cu2Mg-C15 and Mg2Cu-Cb
Compound
Calculated results, kJ/mol
Experimental data, kJ/mol[16] This work Ref.[13] Ref.[14]
Cu2Mg-C15 14.1 12.4 13.5 15.2 ± 1.5
Mg2Cu-Cb 12.3 11.5 11.4 13.7 ± 1.5 Fig. 4 The chemical potential of Mg as a function of
composi-tion for the Cu-Mg liquid phase calculated for 1,100 K and com-pared with prior modeling and experiment. The reference states are liq-Cu and liq-Mg
Fig. 5 The activity of Cu and Mg calculated for 1,200 K and compared with prior modeling and experiment. The reference states are liq-Cu and liq-Mg
Fig. 6 The enthalpy of mixing of the liquid phase calculated for 1,120 K and compared with prior modeling and experiment. The reference states are liq-Cu and liq-Mg
[image:9.594.48.282.57.270.2] [image:9.594.50.282.342.555.2] [image:9.594.308.548.385.452.2]5. Summary and Conclusions
Employing a solution thermodynamics approach, the Gibbs free energy vs. composition curves for all relevant phases in the Cu-Mg binary system were estimated, and the associated binary phase diagram is reported here. While the resulting equilibrium phase diagram exhibits only modest deviation from previously reported diagrams, the current thermodynamic description exhibits several key differences from earlier thermodynamic models. These differences arise from (i) the two-sublattice solution treatment of the Mg2
Cu-Cbphase, (ii) the use of first principles calculations to obtain
the zero-Kelvin energies for the unstable compounds, and (iii) the use of an association model for the liquid phase. As a result, the current model provides a more realistic quantification of heat capacity for the relevant phases and a better description of the composition-dependent enthalpy of mixing for the liquid.
Acknowledgments
Work at the Ames Laboratory was supported by the U.S. Department of Energy, Basic Energy Sciences, under Contract No. DE-AC02-07CH11358.
References
1. A. Inoue and A. Takeuchi, Recent Progress in Bulk Glassy Alloys,Mater. Trans., JIM,, 2002,43, p 1892-1906
2. A. Inoue, H. Kimura, and A. Takeuchi, in Thermec-2003, TRANS TECH PUBLICATIONS LTD, Zurich-Uetikon, 2003, vol. 426-4, p 3-10
3. J.F. Loffler, Bulk Metallic Glasses, Intermetallics, 2003, 11, p 529-540
4. A. Inoue and A. Takeuchi, Recent Progress in Bulk Glassy, Nanoquasicrystalline and Nanocrystalline Alloys,Mater. Sci. Eng., A, 2004,375-377, p 16-30
5. S.H. Zhou and R.E. Napolitano, Phase Equilibria and Thermodynamic Limits for Partitionless Crystallization in the Al-La Binary System,Acta Mater., 2006,54, p 831-840 6. A. Inoue, Amorphous, Nanoquasicrystalline and
Nanocrystal-line Alloys in Albased Systems,Prog. Mater. Sci., 1998,43, p 365-520
7. F. Sommer, G. Bucher, and B. Predel, Thermodynamic Investigations of Mg-Cu and Mg-Ni Metallic Glasses,J. Phys. Colloq., 1980,C8, p 563-566
8. T. Masumoto and R. Maddin, Structural Stability and Mechanical Properties of Amorphous Metals, Mater. Sci. Eng., 1975,19, p 1-24
9. T. Masumoto and R. Maddin, Mechanical Properties of Pd-20 At. Percent Si Alloy Quenched from the Liquid State, Acta Met., 1971,19, p 725-741
10. W.L. Johnson, In: H. Beck, H.J. Guntherodt, Eds., Glassy Metals, Springer-Verlag, Berlin, 1983
11. F.P. Messel, S. Frota-Pessoa, J. Wood, J. Tyler, and J.E. Keem, Electronic Density of States in Amorphous Zirconium Alloys,
Phys. Rev. B, 1983,27, p 1596-1604
12. M. Tenhover and W.L. Johnson, Superconductivity and the Electronic Structure of Zr- and Hf-based Metallic Glasses,
Phys. Rev. B, 1983,27, p 1610-1618
13. C.A. Coughanowr, I. Ansara, R. Luoma, M. Hamalainen, and H.L. Lukas, Assessment of the Cu-Mg System,Z. Metallkd., 1991,82, p 574-581
14. Y. Zou and Y.A. Chang, Thermodynamic Calculation of the Mg-Cu Phase Diagram,Z. Metallkd., 1993,84, p 662-667 15. W.E. Lukens and C.N.J. Wagner, The Structure of Liquid
Cu-Mg Alloys,Z. Naturforsch., 1973,28, p 297-304
16. H. Feufel and F. Sommer, Thermodynamic Investigations of Binary-Liquid and Solid Cu-Mg and Mg-Ni Alloys and Ternary Liquid Cu-Mg-Ni Alloys, J. Alloy. Compd., 1995,
224, p 42-54
17. L. Kaufman and H. Bernstein,Computer Calculation of Phase Diagrams. Vol. 4, Academic Press Inc., New York, 1970 Fig. 7 The heat capacity (a) Cu2Mg-C15 and (b) Mg2Cu-Cb
computed using our model parameters in Tables 1-3 and com-pared with previously reported models and data
Basic and Applied Research: Section I
[image:10.594.48.281.55.515.2]18. N. Saunders and A.P. Miodownik,CALPHAD (Calculation of Phase Diagrams): A Comprehensive Guide, Pergamon, Oxford, New York, 1998
19. G. Grime and W. Morris-Jones, An X-ray Investigation of the Copper-Magnesium Alloys,Phil. Mag., 1929,7, p 1113-1134
20. G.G. Urazova, Experimental Measurements for Cu-Mg Sys-tem,Zh. Russ. Fiz-Khim. Obschestva, 1907,39, p 1556-1581 21. R. Sahmen, Metallographic Announcements from the Institute for Inorganic Chemistry of the University of Gottingen LVIII Concerning the Alloys of Copper with Cobalt, Iron, Manga-nese and Magnesium, Z. Anorg. Chem., 1908,57, p 1-33 22. W.R.D. Jones, The copper-magnesium Alloys. Part IV. The
Equilibrium Diagram,J. Inst. Met., 1931,46, p 395-419 23. I.L. Rogelberg, Cu-Mg Phase Diagram,Tr. Gos. Nauchn. -Issled.,
1957,16, p 82-89
24. P. Bagnoud and P. Feschotte, Binary Systems Cu and Mg-Ni, Particularly the Non-Stoichiometry of the MgCu2 and MgNi2 Laves Phases,Z. Metallkd., 1978,69, p 114-120 25. M. Hansen, Note on the Magnesium-Rich Magnesium-Copper
Alloys,J. Inst. Met., 1927,37, p 93-100
26. N.I. Stepanov and I.I. Kornilov, Solubility of copper in magnesium in the solid state, Izvestiya Instituta Fiziko-Khimicheskogo Analiza, 1935,7, p 89-98
27. A.S. Yue and R.S. Pierre, Ed.,Metall. Soc. Conf., New York, Interscience Publishers, Inc., 1961, p 613-615
28. J.W. Jenkin,J. Inst. Met., 1927,37, p 100-101
29. F. Sommer, J.J. Lee, and B. Predel, Calorimetric Investigations of Liquid Alkaline Earth Metal Alloys,Ber. Bunsenges. Phys. Chem., 1983,87, p 792-797
30. G.I. Batalin, V.S. Sudavtsova, and M.V. Mikhailovskaya, Thermodynamic Properties of Liquid Alloys of the Cu–Mg Systems,Izv. V.U.Z. Tsvetn. Metall., 1987,2, p 29-31 31. N.G. Schmahl and P. Sieben, NPL Symposium 9 on Phys.
Chem. of Metallic Solutions and Intermetallic Compounds, London, HMSO, 1958, p 1-16
32. J.M. Juneja, G.N.K. Iyengar, and K.P. Abraham, Thermody-namic Properties of Liquid (Magnesium + Copper) Alloys By Vapor-Pressure Measurements Made By a Boiling-Tempera-ture Method,J. Chem. Thermodyn., 1986,18, p 1025-1035 33. S.P. Garg, Y.J. Bhatt, and C.V. Sundaram, Thermodynamic
Study of Liquid Cu-Mg Alloys by Vapour Pressure Measure-ments,Metall. Trans., 1973,4, p 283-289
34. P. Sieben and N.G. Schmahl,Giesserei, 1966,18, p 197-201
35. A.V. Kilibus, A.A. Gorshkov, and B.M. Lepinskii,Trans. Inst. Met. Severdlosk., 1969,18, p 55-62
36. R.C. King and O.J. Kleppa, A thermochemical Study of Some Selected Laves Phases,Acta Metall., 1964,12, p 87-97 37. B. Predel and H. Ruge, Beitrag zur Frage nach den
Bindungsverhaltnissen in Laves-Phsen, Mater. Sci. Eng., 1972,9, p 333-339, (in German)
38. M. Arita, Y. Ichinose, and M. Someno, Thermodynamic Properties of the Ti-Cu, Ti-Ni and Mg-Cu Systems by Metal-Hydrogen Equilibration, Metall. Soc. AIME, Warrendale, PA, 1981, p 153-158
39. V.N. Eremenko, G.M. Lukashenko, and R.I. Polotskaya, Thermodynamic Properties of Magnesium-Copper Com-pounds,Russ. Met., 1968,1, p 126-129
40. A.T.W. Kempen, H. Nitsche, F. Sommer, and E.J. Mittemeijer, Crystallization Kinetics of Amorphous Magnesium-Rich Mag-nesium-Copper and Magnesium-Nickel Alloys,Metall. Mater. Trans. A, 2002,33, p 1041-1050
41. A.T. Dinsdale, SGTE Data for Pure Elements, CALPHAD, 1991,15, p 317-425
42. F. Sommer, Association Model for the Description of the Thermodynamic Functions of Liquid Alloys—Basic Concepts,
Z. Metallkd., 1982,73, p 72-86
43. H.G. Krull, R.N. Singh, and F. Sommer, Generalised Associ-ation Model,Z. Metallkd., 2000,91, p 356-365
44. B. Sundman and J. Agren, A Regular Solution Model for Phases with Several Components and Sublattices, Suitable for Com-puter Applications,J. Phy. Chem Solids, 1981,42, p 297-301 45. G. Kresse, T. Demuth, and F. Mittendorfer, VAMP/VASP,
http://www.cms.mpi.univie.ac.at/vasp/, 2003
46. D. Vanderbilt, Soft Self-Consistent Pseudopotentials in a Generalized Eigenvalue Formalism, Phys. Rev. B, 1990,41, p 7892-7895
47. G. Kresse and D. Joubert, From Ultrasoft Pseudopotentials to the Projector Augmented-wave Method, Phys. Rev. B, 1999,
59, p 1758-1775
48. C.A. Angell, Formation of Glasses from Liquids and Biopoly-mers,Science, 1995,267, p 1924-1935
49. F. Sommer, Thermodynamics of Liquid Alloys, Mater. Sci. Eng. A, 1997,226, p 757-762
50. S.H. Zhou, J. Schmid, and F. Sommer, Thermodynamic Properties of Liquid, Undercooled Liquid and Amorphous Al-Cu-Zr and Al-Cu-Ni-Zr Alloys,Thermochim. Acta, 1999,