Ames Laboratory Accepted Manuscripts
Ames Laboratory
6-5-2018
Molecular dynamics simulation of the solid-liquid
interface migration in terbium
Mikhail I. Mendelev
Ames Laboratory, [email protected]
Feng Zhang
Ames Laboratory, [email protected]
H. Song
Ames Laboratory
Yang Sun
Ames Laboratory, [email protected]
Cai-Zhuang Wang
Ames Laboratory, [email protected] See next page for additional authors
Follow this and additional works at:
https://lib.dr.iastate.edu/ameslab_manuscripts
Part of the
Biological and Chemical Physics Commons
This Article is brought to you for free and open access by the Ames Laboratory at Iowa State University Digital Repository. It has been accepted for inclusion in Ames Laboratory Accepted Manuscripts by an authorized administrator of Iowa State University Digital Repository. For more information, please [email protected].
Recommended Citation
Mendelev, Mikhail I.; Zhang, Feng; Song, H.; Sun, Yang; Wang, Cai-Zhuang; and Ho, Kai-Ming, "Molecular dynamics simulation of the solid-liquid interface migration in terbium" (2018).Ames Laboratory Accepted Manuscripts. 428.
Molecular dynamics simulation of the solid-liquid interface migration in
terbium
Abstract
We developed a Tb embedded atom method potential which properly reproduces the liquid structure
obtained from the ab initio molecular dynamics simulation, the hexagonal close packed (hcp)-body-centered
cubic (bcc) phase transformation, and melting temperatures. At least three crystal phases [hcp, face-centered
cubic (fcc), and bcc] described by this potential can coexist with the liquid phase. Thus, the developed
potential provides an excellent test bed for studies of the completive phase nucleation and growth in a single
component system. The molecular dynamics simulation showed that all crystal phases can grow from the
liquid phase close to their melting temperatures. However, in the cases of the hcp and fcc growth from the
liquid phase at very large supercoolings, the bcc phase forms at the solid-liquid interface in the close packed
orientations in spite of the fact that both hcp and fcc phases are more stable than the bcc phase at these
temperatures. This bcc phase closes the hcp and fcc phase from the liquid such that the remaining liquid
solidifies into the bcc phase. The initial hcp phase then slowly continues growing in expense of the bcc phase.
Disciplines
Biological and Chemical Physics
Authors
Mikhail I. Mendelev, Feng Zhang, H. Song, Yang Sun, Cai-Zhuang Wang, and Kai-Ming Ho
J. Chem. Phys. 148, 214705 (2018); https://doi.org/10.1063/1.5026922 148, 214705
© 2018 Author(s).
Molecular dynamics simulation of the
solid-liquid interface migration in terbium
Cite as: J. Chem. Phys. 148, 214705 (2018); https://doi.org/10.1063/1.5026922
Submitted: 26 February 2018 . Accepted: 16 May 2018 . Published Online: 05 June 2018
M. I. Mendelev, F. Zhang, H. Song, Y. Sun , C. Z. Wang, and K. M. Ho
ARTICLES YOU MAY BE INTERESTED IN
A unified relation for the solid-liquid interface free energy of pure FCC, BCC, and HCP metals
The Journal of Chemical Physics 144, 144707 (2016); https://doi.org/10.1063/1.4946032
Development of an interatomic potential for the simulation of defects, plasticity, and phase transformations in titanium
The Journal of Chemical Physics 145, 154102 (2016); https://doi.org/10.1063/1.4964654
Solid-liquid interface free energies of pure bcc metals and B2 phases
THE JOURNAL OF CHEMICAL PHYSICS148, 214705 (2018)
Molecular dynamics simulation of the solid-liquid interface
migration in terbium
M. I. Mendelev,1,a)F. Zhang,1H. Song,1Y. Sun,1C. Z. Wang,1and K. M. Ho1,2,3 1Division of Materials Sciences and Engineering, Ames Laboratory (US Department of Energy),
Ames, Iowa 50011, USA
2Department of Physics, Iowa State University, Ames, Iowa 50011, USA
3Hefei National Laboratory for Physical Sciences at the Microscale and Department of Physics,
University of Science and Technology of China, Hefei, Anhui 230026, China
(Received 26 February 2018; accepted 16 May 2018; published online 5 June 2018)
We developed a Tb embedded atom method potential which properly reproduces the liquid structure obtained from theab initiomolecular dynamics simulation, the hexagonal close packed (hcp)-body-centered cubic (bcc) phase transformation, and melting temperatures. At least three crystal phases [hcp, face-centered cubic (fcc), and bcc] described by this potential can coexist with the liquid phase. Thus, the developed potential provides an excellent test bed for studies of the completive phase nucleation and growth in a single component system. The molecular dynamics simulation showed that all crystal phases can grow from the liquid phase close to their melting temperatures. However, in the cases of the hcp and fcc growth from the liquid phase at very large supercoolings, the bcc phase forms at the solid-liquid interface in the close packed orientations in spite of the fact that both hcp and fcc phases are more stable than the bcc phase at these temperatures. This bcc phase closes the hcp and fcc phase from the liquid such that the remaining liquid solidifies into the bcc phase. The initial hcp phase then slowly continues growing in expense of the bcc phase.Published by AIP Publishing. https://doi.org/10.1063/1.5026922
I. INTRODUCTION
Metastable crystal phases can often influence or domi-nate the solidification process in deeply undercooled liquids. For example, it is well known from experimental,1–4 computa-tional,5,6and theoretical7,8studies that a body-centered cubic (bcc) phase can nucleate first and then transform into a pure face-centered cubic (fcc) phase in systems where the fcc phase is the most stable phase from 0 K to its melting temperature. This phenomenon can be explained by the fact that the bcc-liquid interface free energy is smaller than the fcc-bcc-liquid inter-face energy in the same system.9,10In multi-component alloys, a metastable phase can nucleate and grow from the interface between the more stable phase and a glass/supercooled liquid if the growth of the metastable phase does not require par-titioning and the growth of the stable phase does (e.g., see Ref.11). Since there can be no partitioning in one-component systems, to the best of our knowledge such a phenomenon has not been observed in these systems. However, there is no reason to exclude this possibility if the growth kinetics of a metastable phase is much faster than the growth kinet-ics of the most stable phase. In this paper, we report the results of the molecular dynamics (MD) simulation of the solid-liquid interface (SLI) migration in Tb which shows that a metastable bcc phase can nucleate and grow from the interfaces between solid phases more stable than bcc and a supercooled liquid.
a)Author to whom correspondence should be addressed: mendelev@
ameslab.gov
It should be noted that the formation of the bcc phase at the interface between the hexagonal close packed (hcp) phase and liquid has been observed in molecular dynamics (MD) simu-lation. For example, the authors of Ref.12noticed that the Mg embedded atom method (EAM)13potential from Ref.14leads to “a stable bcc phase at temperatures above the hcp melting point” which made this potential unsuitable for the application of the capillary fluctuation method (CFM)15 of calculation of the SLI free energy since the bcc phase formed between liquid and hcp phases. For the same reason, the authors of Ref.10could not use Zr #2 potential from Ref.16to deter-mine the hcp-liquid interface free energy: the bcc phase always formed between the hcp and liquid phase during the long simulation time necessary to collect the data for the CFM. However, these were not surprising results because in both cases the bcc was the most stable phase at the temperatures of the MD simulation. To the best of our knowledge, it has not been reported that the bcc phase forms at the hcp-liquid interface at a temperature where the hcp is the most stable phase.
Terbium represents a very interesting case to study the competitive crystal phase nucleation and growth from liquid. It forms the hcp lattice at low temperatures which transforms into the bcc lattice at Tα→β= 1563 K which is stable up to its melting temperature Tm= 1633 K.17The fact that the hcp-bcc
transformation temperature is close to the melting temperature makes the bulk driving forces for the solidification of these phase to be comparable. It is difficult to study a completive crystal phase growth from a supercooled liquid in an experi-ment because these processes proceed very fast in pure metals,
214705-2 Mendelevet al. J. Chem. Phys.148, 214705 (2018)
and while there are some data on the nucleation in pure metals (e.g., see Refs.18–20), we are not aware about such studies for pure Tb. However, the fact that the nucleation and growth proceed very fast in pure metals makes the classical molecu-lar dynamics simulation a very convenient tool to reveal the details of these processes.
In the present work, we developed an EAM potential for pure Tb and employed it to perform MD simulations of the SLI migration. While only two crystal phases in pure Tb are sta-ble at p = 0, other crystal lattices [Sm-type, dousta-ble hexagonal close packed (dhcp), fcc, and trigonal] are stable at very high pressures.21One of these phases (fcc) was explicitly included in the potential development procedure because without spe-cial constraints the EAM potentials tend to make the fcc the most stable phase which would be incorrect in the case of Tb and could lead to some artifacts during MD simulation of the nucleation and even SLI migration. Since both hcp and fcc are close packed lattices, we also used this opportunity to investi-gate how the difference in the packing sequence affects the SLI migration.
The rest of the paper is organized as follows. First, we will describe theab initiocalculations we performed to obtain some target quantities used in the potential development pro-cedure. Next, we will describe the developed potential and the thermodynamic properties it provides. We will demon-strate that it is especially suitable for the simulation of the solidification in Tb. Finally we will present the results of the MD simulation of the SLI migration and discuss the obtained results.
II. AB INITIOCALCULATIONS
[image:5.594.338.514.49.224.2]To build a database of target properties for the poten-tial development procedure, we first calculated the lattice
TABLE I. Physical properties calculated for various interatomic potentials.
Property Target value FS potentiala
a (hcp) (Å) 3.624b 3.625
c/a (hcp) 1.560b 1.561
Ecoh(eV/atom) 4.0545 4.19
Evf(eV/atom)c 1.76b 1.75
C11(hcp, GPa) 67.946 68.6
C12(hcp, GPa) 24.346 31.7
C44(hcp, GPa) 21.446 28.5
C13(hcp, GPa) 23.046 18.4
C33(hcp, GPa) 72.346 69.8
a (fcc) (Å) 5.021b 5.162
∆Ehcp→fcc(eV/atom) 0.005b 0.006
Tα→β(K) 156317 1556
∆Hα→β(eV/atom) 0.05217 0.028
Tm(hcp, K) 1609
∆Hm(hcp, eV/atom) 0.167
Tm(bcc, K) 163317 1621
∆Hm(bcc, eV/atom) 0.11217 0.138
Tm(fcc, K) 1586
∆Hm(fcc, eV/atom) 0.165
aThe properties used in the potential development procedure are printed in bold. bAb initiocalculations performed in the present study.
cUnrelaxed value.
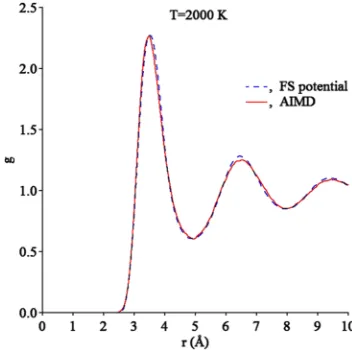
FIG. 1. Pair correlation functions of liquid Tb obtained from the AIMD and classical MD simulation.
parameters and total energy of the fcc and hcp phases using the density functional theory (DFT) implemented into the Viennaab initioSimulation Package (VASP).22,23The gener-alized gradient approximation proposed by Perdew, Burke, and Ernzerhof24was used for the exchange-correlation functional. The projector-augmented wave method25,26was used to treat the electron-ion interaction. A cutoff energy of∼200 eV was used for the plane-wave basis. The total energy converged to 10−5eV per cell in each self-consistent loop. Our calculations
successfully predicted that the hcp phase is the most stable at T = 0, while the total energy of the fcc phase is 5.0 meV/atom higher. Next, we calculated the unrelaxed formation energy of a Tb vacancy using the 4×4×4 supercell. The supercell with the vacancy was not relaxed. The obtained data are provided in TableI.
To generate a model of the liquid Tb, we performed
the ab initio molecular dynamics (AIMD) simulation at
T = 2000 K. A large unit cell containing 200 atoms was used to ensure that the long-range correlations are sufficiently captured. The constant number of atoms, volume, and tem-perature (NVT) ensemble was applied with the Nose-Hoover thermostat.27The Verlet algorithm was used to integrate New-ton’s equations of motion, using a time step of 3 fs. After a few trial densities, we chose an approximate density for which the pressure was averaged over 7000 snapshots. The obtained average pressure which turned out to be 0.6 GPa was used as the target quantity in the potential develop-ment procedure to provide that the equilibrium liquid den-sity predicted by the semi-empirical potential is close the AIMD value. The pair correlation function (PCF) was aver-aged over the same AIMD snapshots. The obtained PCF shown in Fig. 1 looks like a typical liquid metal PCF (e.g., see Ref.28).
III. SEMI-EMPIRICAL POTENTIAL FOR TERBIUM
[image:5.594.44.288.487.724.2]214705-3 Mendelevet al. J. Chem. Phys.148, 214705 (2018)
the correct liquid structure and reproduce the melting tem-perature data. Most semi-empirical potentials are fitted to T = 0 data obtained fromab initiocalculations or room tem-perature data obtained from experiment. There is no reason to expect that such potentials will be suitable for the simulation of solidification (e.g., see the discussion in Ref.29). There-fore, the information about the liquid structure and the melting temperature data should be included in the potential develop-ment procedure. The method to include PCFs in the potential development procedure for an EAM potential was proposed in Ref.30. It utilizes the Born–Green–Bogoliubov equation31 without any use of the superposition approximation. Instead the integral containing the three-particle correlation function is calculated using the liquid model snapshots. The target PCFs can be obtained either from X ray or neutron diffraction exper-iments or from AIMD simulations as in the present study. As it was shown in Ref.32, this method allows us to almost exactly reproduce an AIMD PCF if this is the only target property to fit.
The melting temperature data include the melting tem-perature itself, the latent heat, and the change in volume upon melting. The method to fit a semi-empirical potential to the melting temperature was proposed in Ref.33. The inclusion of the latent heat is not really different from the commonly used fitting to the T = 0 allotropic transformation energies and has been used for semi-empirical potentials developed to sim-ulate the solidification (e.g., see Ref.12). The fitting a potential to the change in volume upon melting is also conceptually not difficult because it reduces to fitting to the zero pressure at given density (which was also discussed in Ref.30). How-ever, since in most cases, there are no target values for this property, it is usually ignored in the potential development procedure.
Since the hcp-bcc transformation temperature for Tb is close to its melting temperature, it is especially important to reproduce the parameters of this transformation. Just like in the case of melting, the most important quantities to reproduce are the transformation temperature itself and the latent heat. The method to incorporate such data in the potential development procedure was proposed in Ref.16and further discussed in Ref.34.
The potential development procedure used in the present study is similar to that used in Ref.34. The target properties are listed in TableI. As usually, they include the T = 0 basic properties of the ground state (hcp). The potential was also fit to the hcp-bcc transformation temperature, the bcc melting temperature, and the corresponding latent heats. Since we had no data on the fcc melting temperature, we just provided that this phase is always metastable with respect to the hcp phase. This was done by fitting to the fcc-hcp transformation energy at T = 0 and ensuring that the fcc melting temperature is below the hcp melting temperature.
The melting temperatures for all three competing crys-talline phases (hcp, fcc, and bcc) were determined using the protocol described in detail in Ref. 35. The inaccuracy of the determination of the melting temperatures was about 0.005Tm.Once the melting temperatures and latent heats were
determined, the change in the free energies upon melting, ∆Gm, was calculated via the Gibbs-Helmholtz equation. The
difference between the free energies of solid phases,∆Gss, was
determined from the differences of the corresponding∆Gm.
The temperatures where∆Gss= 0 are the solid-solid
transfor-mation temperatures which can be determined this way with inaccuracy within 2 K, as was discussed in Ref.34. We empha-size that this approach does not rely on any approximation, and its accuracy is only limited by the accuracy of the MD simulation.
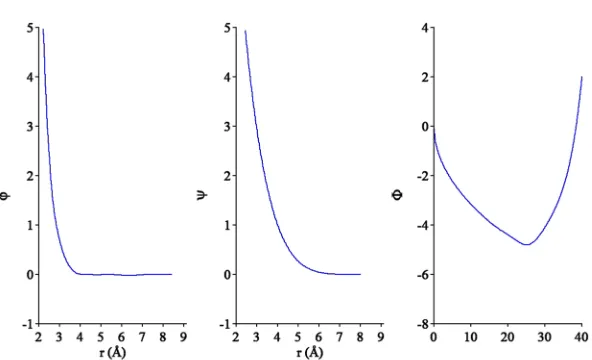
[image:6.594.45.341.571.751.2]The developed potential functions are shown in Fig.2. They can be found in thesupplementary materialand Ref.36. The examination of TableIshows that the developed poten-tial reproduces the target quantities reasonably well. The only considerable deviation is the latent heat of the hcp-bcc trans-formation which is underestimated by the developed poten-tial. This should lead to an underestimation for the driv-ing force for this transformation. Figure 1 shows that the developed potential leads to a liquid structure which is in excellent agreement with the AIMD data. Overall, since the potential correctly reproduces the liquid structure and the stability of crystal phases in the entire temperature interval from 0 K up to the melting temperature, it can be employed in the MD simulations of the phase transformations in pure Tb.
214705-4 Mendelevet al. J. Chem. Phys.148, 214705 (2018)
IV. THERMODYNAMIC PROPERTIES
The atomic volume and energy (the sum of the poten-tial and kinetic energies) of three competing crystal phases and the liquid as functions of temperature were obtained from the NVT MD simulation using small simulation cells containing ∼2000 atoms. The time step of the MD simula-tion was 2 fs. In order to determine the equilibrium lattice parameters/density at each temperature, the stresses/pressure at several probe lattice parameters/densities were determined from the NVT MD simulation. The equilibrium lattice param-eters/densities were determined from the conditions that the stresses/pressure should be equal to zero. Both the stresses and energy were averaged over 20 000 MD steps (40 ps). The obtained equilibrium data were used to construct the inter-polation formulas provided in thesupplementary material. It should be noted that the data for the liquid phase were obtained down to 1200 K. Below this temperature, the liquid sponta-neously solidifies into the bcc phase even in the simulation cell containing 2000 atoms during 80 ps. Therefore, the interpo-lation formulas provided for the liquid in thesupplementary materialcannot be used below this temperature. In the case of the solid phase, the data could be collected up to 1800 K. Slightly above this temperature, all solid phases spontaneously melt.
[image:7.594.48.285.477.725.2]The changes in the energy and free energy associated with the phase transformations are shown in Fig.3. It demonstrates that the developed potential does provide the correct descrip-tions of the phase transformadescrip-tions in Tb: the hcp phase is the most stable phase from 0 to 1556 K when it transforms to the bcc phase which is stable up to its melting temperature. No other phase transformations happen at p = 0. We note that the bcc energy is always higher than the hcp energy which means that the hcp-bcc transition is possible because the bcc
FIG. 3. Change in the energy (the sum of the potential and kinetic energies) and free energy for phase transformation in Tb.
entropy is higher than the hcp entropy. The hcp phase also has lower energy than the fcc energy, except for very high temper-atures which are above the hcp melting temperature. The free energy of the hcp phase is always lower than the fcc free energy such that no equilibrium between these phases is possible at p = 0.
Figure 3 shows that the driving forces for the solidifi-cation for all considered crystal phases are rather close to each other at large supercoolings. Therefore, it is mostly the SLI free energy and the growth kinetics which will control the solidification in this system. While we did not employ the computationally expensive CFM to determine the SLI free energy, based on the empirical correlations proposed in Ref. 10, we can estimate the SLI free energy at the melting temperature as 112, 113, and 83 mJ/m2, for the hcp, fcc, and bcc phases, respectively. Taking into account the closeness of the bulk driving forces for the solidification for all three crys-tal phases, it is reasonable to assume that it is the bcc phase which will nucleate first even below the hcp-bcc transforma-tion temperature. We indeed observed this phenomenon in the NVT MD simulation of the liquid phase at T = 1200 K (see Sec.VI).
V. MOLECULAR DYNAMICS SIMULATION OF THE SOLID-LIQUID INTERFACE MIGRATION
The method to construct the simulation cells to study the SLI migration was described in detail in Ref.37. The simula-tion cells contained a solid phase in the middle and the liquid layers at the bottom and top such that two SLIs were normal to the z-direction. The simulation cells had periodic bound-ary conditions in the x- and y-directions. The simulation cell sizes in these directions were chosen according to the crys-tal phase lattice parameters at the simulation temperature and did not change in the course of the MD simulation. Finally, the simulation cells had free surfaces in the z-direction. Such a simulation geometry provides zero stresses during the SLI migration.
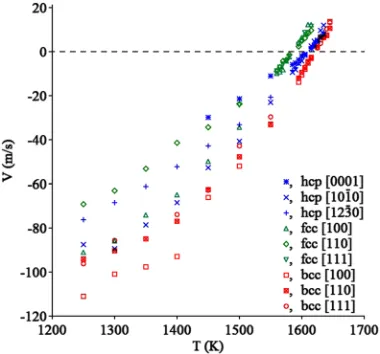
To avoid the effect of the heat generation/adsorption dur-ing the SLI migration, a layered thermostat with the thickness of 3 nm was employed (see Ref. 38for discussion). During the MD simulation, the total energy was recorded as a func-tion of time, and the SLI velocity,V, was determined from the slope of this curve (see Ref.37for details). The SLI veloc-ities as functions of temperature are shown in Fig. 4. All obtained dependences are linear in the vicinity of the melt-ing temperature (±30 K) and sublinear at large supercooling. The solidification MD simulations were performed down to 1250 K to avoid the spontaneous homogeneous nucleation in the liquid phase which becomes rather fast below 1200 K (see Sec.VI). The typical simulation time at T = 1250 K was less than 0.2 ns with the number of atoms in each liquid part of the simulation cell not greater than 12 000. This time and the system size were too small to observe any homogeneous nucle-ation in the liquid phase during the SLI migrnucle-ation simulnucle-ations (see the discussion in Sec.VI).
Ten data points with a step of 5 K closest to the melting temperature were used to determine the kinetic coefficients,
214705-5 Mendelevet al. J. Chem. Phys.148, 214705 (2018)
FIG. 4. Solid-liquid interface velocities as functions of temperature.
solidification, we checked if the growing crystal phase indeed has the same lattice as the initial seed. We found that all three crystal phases can coexist with the liquid phase at small under-cooling, and we never observed a nucleation of a new crystal phase during the MD simulation under this condition. The obtained values of the kinetic coefficients are summarized in TableII. The SLI migration for all crystal phases is anisotropic. While a larger number of orientations should be studied in the future, the MD simulation data for each phase are in agreement with the data of the previous MD studies for the same lattices. In particular, in the case of the hcp lattice, the close packed [0001] direction is the slowest which is in agreement with the results obtained in Ref.39. The close packed [111] direction is also the slowest for the fcc lattice which is in agreement with the results of Refs. 37,40, and41. The SLI migration in the case of the bcc lattice is more isotropic than for the close packed lattices, which is in agreement with the results of Ref.42.
The developed potential for Tb provides a rather unique opportunity to compare the kinetic coefficients for three crystal phases. The examination of Table II shows that the kinetic coefficients for the bcc phase is larger than those for the fcc and hcp phases. A similar result was obtained in Ref.43for fcc and bcc Fe described by the same EAM potential.
While at small supercooling, we never observed any new crystal phase formation in the course of the MD simulation of
TABLE II. Solid-liquid interface kinetic coefficients.
Phase Orientation µ[m/(s·K)]
hcp [0001] 0.26±0.03
[10¯10] 0.42±0.03
[12¯30] 0.34±0.02
fcc [100] 0.44±0.03
[110] 0.31±0.03
[111] 0.37±0.02
bcc [100] 0.50±0.04
[110] 0.48±0.06
[111] 0.46±0.03
the solidification; we did observe such phenomena at large supercoolings for the close packed directions of both hcp (below T = 1450 K) and fcc (below T = 1500 K) phases (see the supplementary material). In the case of the hcp phase growth, the original hcp seed grew for some time in expense of the liq-uid and then the bcc phase formed at the solid-liqliq-uid interface after which it was the bcc phase which grew in expense of the liquid phase (see the movie in thesupplementary material). This is a rather surprising result especially taking into account that we never observed such a phenomenon above T = 1556 K when the bcc is the most stable phase. We also never observed this phenomenon for other two orientations of the hcp-liquid and fcc-liquid interfaces we studied.
In the case of the fcc phase growth at the largest super-cooling (T = 1250 K), we observed a similar behavior: the original fcc seed grew for some time in expense of the liquid phase and then the bcc phase formed at the fcc-liquid interface after which it was the bcc phase which grew in expense of the liquid phase. At T = 1300 K, T = 1350 K, and T = 1400 K, we observed formations of either the hcp or bcc phases at the fcc-liquid interface which then grew in expense of the liquid phase. Finally, at T = 1450 K, only the hcp phase nucleated at the fcc-liquid interface and then grew in expense of the liquid phase.
VI. DISCUSSION
The most interesting result of the MD simulations per-formed in the present study is the formation of the metastable bcc phase during the solidification when the simulation cell initially contains only an hcp seed. As we noted above, we observe this phenomenon well below the hcp-bcc transforma-tion temperature. The phenomenon could be easily explained if the bcc phase homogeneously nucleated in the bulk liq-uid because as we mentioned above it is very likely that the bcc-liquid interface had a relatively low free energy. However, the examination of the movie provided in thesupplementary materialshows that the bcc phase does nucleate at the hcp-liquid interface. Moreover, we performed additional NVT sim-ulations of the homogenous nucleation in the liquid phase. In these simulations, the simulation cell contained 10 000 atoms which is approximately the number of atoms each of the liquid parts has in the beginning of the SLI migration simulations. We did observe the homogeneous bcc phase nucleation at T = 1200 K, but it happens only after 4 ns, while the entire SLI migration simulation lasted only 160 ps at T = 1300 K, and Fig.5(Multimedia view) shows that the bcc phase appeared in both parts of the simulation cell at t = 100 ps. We observed no homogeneous nucleation at T = 1250 K and T = 1300 K in the simulation cells containing 10 000 atoms even after 100 ns of the MD simulation. Therefore, the bcc phase does form at the interface during the hcp-liquid interface migration.
[image:8.594.44.288.608.751.2]214705-6 Mendelevet al. J. Chem. Phys.148, 214705 (2018)
FIG. 5. Solid-liquid interface migration at T = 1300 K. Initially the simulation cell contained the liquid and hcp seed with the [0001] direction parallel to the z-axis in the middle of the simulation cell. The visualization was made using the OVITO software package.47 The
col-oring is made using the polyhedral template matching method developed in Ref.48. See Multimedia view for the time interval from 0 to 0.2 ns. Multimedia view: https://doi.org/10.1063/1.5026922.1
remaining liquid solidifies into the bcc phase. However, after that the bcc phase slowly transforms into the hcp phase. There-fore, the hcp phase is definitely more stable than the bcc phase at T = 1300 K, in agreement with the transformation free energy data presented in Fig.3.
Thus, it seems that the only possible explanation of the observed phenomenon is that the bcc phase can relatively eas-ily nucleate at the [0001] hcp-liquid interface. Once it nucle-ates, it grows several times faster than the hcp phase grows in the [0001] direction (see Fig.4). A more detailed description of the bcc nucleation will require the determination of the hcp-bcc interface free energy and hcp- and hcp-bcc-liquid interface free energies, which is a very difficult challenge taking into account that we observe this phenomenon at temperatures well below the temperatures of the corresponding phase transformations. Another surprising result is that we never observed the bcc phase formation in the hcp-liquid and fcc-liquid MD simula-tions close to the hcp and fcc meting temperatures where the bcc phase is the most stable phase. This supports our conclu-sion that the observed phenomenon can be explained, namely, by the kinetics of the solid-liquid transformations rather than by their thermodynamics alone.
VII. CONCLUSIONS
In summary, we developed a Tb EAM potential which properly reproduces the liquid structure obtained from the AIMD simulation, the hcp-bcc phase transformation, and melt-ing temperatures. At least three crystal phases (hcp, fcc, and bcc) described by this potential can coexist with the liquid phase. Therefore, the developed potential provides an excel-lent test bed for studies of the completive phase transfor-mations in a single component system. The MD simulation performed within the present study showed that all crystal phases can grow from the liquid phase close to their melting temperatures. However, in the cases of the hcp and fcc growth from the liquid phase at very large supercoolings, the bcc phase forms in the close packed orientations. This bcc phase closes the more stable hcp and fcc phase from the liquid such that
the remaining liquid solidifies into the bcc phase. The initial hcp phase then slowly continues growing in expense of the bcc phase.
SUPPLEMENTARY MATERIAL
See supplementary material for the developed EAM potential in the LAMMPS44format, the thermodynamic prop-erties of the Tb phases obtained from MD simulation, the final snapshot pictures for all solidification simulations, and a movie of the solidification of the [0001] hcp-liquid interface at T = 1300 K.
ACKNOWLEDGMENTS
This work was supported by the U.S. Department of Energy (DOE), Office of Science, Basic Energy Sciences, Materials Science and Engineering Division. The research was performed at Ames Laboratory, which is operated for the U.S. DOE by Iowa State University under Contract No. DE-AC02-07CH11358.
1G. Ghosh,Mater. Sci. Eng., A189, 277 (1994).
2D. M. Herlach,J. Phys.: Condens. Matter13, 7737 (2001).
3M. J. Li, X. Lin, G. S. Song, G. C. Yang, and Y. H. Zhou,Mater. Sci. Eng.,
A268, 90 (1999).
4C. Notthoff, B. Feuerbacher, H. Franz, D. M. Herlach, and D.
Holland-Moritz,Phys. Rev. Lett.86, 1038 (2001).
5S. Auer and D. Frenkel,Nature409, 1020 (2001).
6S. Auer and D. Frenkel,J. Phys.: Condens. Matter14, 7667 (2002). 7Y. C. Shen and D. W. Oxtoby,Phys. Rev. Lett.77, 3585 (1996). 8L. Granasy and T. Pusztai,J. Chem. Phys.117, 10121 (2002).
9D. Y. Sun, M. Asta, J. J. Hoyt, M. I. Mendelev, and D. J. Srolovitz,Phys.
Rev. B69, 020102 (2004).
10S. R. Wilson and M. I. Mendelev,J. Chem. Phys.144, 144707 (2016). 11T. Cullinan, I. Kalay, Y. E. Kalay, M. Kramer, and R. Napolitano,Metall.
Mater. Trans. A46A, 600 (2015).
12D. Y. Sun, M. I. Mendelev, C. A. Becker, K. Kudin, T. Haxhimali, M. Asta,
J. J. Hoyt, A. Karma, and D. J. Srolovitz,Phys. Rev. B73, 024116 (2006).
13M. S. Daw and M. I. Baskes,Phys. Rev. B29, 6443 (1984).
14X. Y. Liu, J. B. Adams, F. Ercolessi, and J. A. Moriarty,Modell. Simul.
Mater. Sci. Eng.4, 293 (1996).
214705-7 Mendelevet al. J. Chem. Phys.148, 214705 (2018)
17A. I. Efimov, L. P. Belorukova, and I. V. Vasilkova,Svoistva Neorganich-eskikh Soedinenii. Spravochnik(Himiia, Leningrad, 1983).
18J. Bokeloh, R. E. Rozas, J. Horbach, and G. Wilde,Phys. Rev. Lett.107,
145701 (2011).
19A. Filipponi, A. Di Cicco, S. De Panfilis, P. Giammatteo, and F. Iesari,Acta
Mater.124, 261 (2017).
20G. Wilde, J. L. Sebright, and J. H. Perepezko,Acta Mater.54, 4759 (2006). 21W. A. Grosshans and W. B. Holzapfel,Phys. Rev. B45, 5171 (1992). 22G. Kresse and J. Furthmuller,Comput. Mater. Sci.6, 15 (1996). 23G. Kresse and J. Furthmuller,Phys. Rev. B54, 11169 (1996).
24J. P. Perdew, K. Burke, and M. Ernzerhof, Phys. Rev. Lett. 77, 3865
(1996).
25P. E. Blochl,Phys. Rev. B50, 17953 (1994).
26G. Kresse and D. Joubert,Phys. Rev. B59, 1758 (1999). 27S. Nose,J. Chem. Phys.81, 511 (1984).
28Y. Waseda,The Structure of Non-Crystalline Materials: Liquids and Amor-phous Solids(McGraw-Hill International Book Co., New York, London, 1980).
29M. I. Mendelev, S. Han, D. J. Srolovitz, G. J. Ackland, D. Y. Sun, and
M. Asta,Philos. Mag.83, 3977 (2003).
30M. I. Mendelev and D. J. Srolovitz,Phys. Rev. B66, 014205 (2002). 31M. Born and H. S. Green,Proc. R. Soc. Lond. A. Math. Phys. Sci.188, 10
(1946).
32M. J. Kramer, M. I. Mendelev, and M. Asta, Philos. Mag.94, 1876
(2014).
33J. B. Sturgeon and B. B. Laird,Phys. Rev. B62, 14720 (2000).
34M. I. Mendelev, T. L. Underwood, and G. J. Ackland,J. Chem. Phys.145,
154102 (2016).
35S. R. Wilson, K. Gunawardana, and M. I. Mendelev,J. Chem. Phys.142,
134705 (2015).
36Seehttp://www.ctcms.nist.gov/potentialsfor potentials for Tb to download
the developed potential in the LAMMPS format.
37M. I. Mendelev, M. J. Rahman, J. J. Hoyt, and M. Asta,Modell. Simul.
Mater. Sci. Eng.18, 074002 (2010).
38J. Monk, Y. Yang, M. I. Mendelev, M. Asta, J. J. Hoyt, and D. Y. Sun,
Modell. Simul. Mater. Sci. Eng.18, 015004 (2010).
39Z. G. Xia, D. Y. Sun, M. Asta, and J. J. Hoyt,Phys. Rev. B75, 012103
(2007).
40E. Burke, J. Q. Broughton, and G. H. Gilmer,J. Chem. Phys.89, 1030
(1988).
41J. J. Hoyt and M. Asta,Phys. Rev. B65, 214106 (2002). 42J. J. Hoyt, M. Asta, and D. Y. Sun,Philos. Mag.86, 3651 (2006). 43D. Y. Sun, M. Asta, and J. J. Hoyt,Phys. Rev. B69, 174103 (2004). 44S. Plimpton,J. Comput. Phys.117, 1 (1995).
45G. Simmons and H. Wang,Single Crystal Elastic Constants and Calcu-lated Aggregate Properties: A Handbook, 2nd edn. (MIT Press, Cambridge, Mass., 1971).
46K. Salama, F. R. Brotzen, and P. L. Donoho, J. Appl. Phys.43, 3254
(1972).
47A. Stukowski,Modell. Simul. Mater. Sci. Eng.18, 015012 (2010). 48P. M. Larsen, S. Schmidt, and J. Schiotz,Modell. Simul. Mater. Sci. Eng.

![FIG. 5. Solid-liquid interface migration at T = 1300 K.Initially the simulation cell contained the liquid and hcpseed with the [0001] direction parallel to the z-axis inthe middle of the simulation cell](https://thumb-us.123doks.com/thumbv2/123dok_us/8122523.239814/9.594.45.342.46.267/interface-migration-initially-simulation-contained-direction-parallel-simulation.webp)
