R E S E A R C H
Open Access
Height for age z score and cognitive
function are associated with Academic
performance among school children aged
8
–
11 years old
Demewoz Haile
1*, Dabere Nigatu
2, Ketema Gashaw
2and Habtamu Demelash
3Abstract
Background:Academic achievement of school age children can be affected by several factors such as nutritional status, demographics, and socioeconomic factors. Though evidence about the magnitude of malnutrition is well established in Ethiopia, there is a paucity of evidence about the association of nutritional status with academic performance among the nation’s school age children. Hence, this study aimed to determine how nutritional status and cognitive function are associated with academic performance of school children in Goba town, South East Ethiopia.
Methods:An institution based cross-sectional study was conducted among 131 school age students from primary schools in Goba town enrolled during the 2013/2014 academic year. The nutritional status of students was assessed by anthropometric measurement, while the cognitive assessment was measured by the Kaufman Assessment Battery for Children (KABC-II) and Ravens colored progressive matrices (Raven’s CPM) tests. The academic
performance of the school children was measured by collecting the preceding semester academic result from the school record. Descriptive statistics, bivariate and multivariable linear regression were used in the statistical analysis. Results:This study found a statistically significant positive association between all cognitive test scores and average academic performance except for number recall (p= 0.12) and hand movements (p= 0.08). The correlation between all cognitive test scores and mathematics score was found positive and statistically significant (p< 0.05). In the multivariable linear regression model, better wealth index was significantly associated with higher mathematics score (ß = 0.63; 95 % CI: 0.12–0.74). Similarly a unit change in height for age z score resulted in 2.11 unit change in mathematics score (ß = 2.11; 95 % CI: 0.002–4.21). A single unit change of wealth index resulted 0.53 unit changes in average score of all academic subjects among school age children (ß = 0.53; 95 % CI: 0.11–0.95). A single unit change of age resulted 3.23 unit change in average score of all academic subjects among school age children (ß = 3.23; 95 % CI: 1.20–5.27).
Conclusion:Nutritional status (height for age Z score) and wealth could be modifiable factors to improve academic performance of school age children. Moreover, interventions to improve nutrition for mothers and children may be an important contributor to academic success and national economic growth in Ethiopia. Further study with strong design and large sample size is needed.
* Correspondence:[email protected]
1School of Public Health, College of Medicine and Health Sciences, Bahir Dar University, Bahir Dar, Ethiopia
Full list of author information is available at the end of the article
Background
Academic achievement of school age children can be af-fected by several factors such as nutritional status, demographics, and socio-economic factors [1, 2]. No na-tion can afford to waste its greatest nana-tional resource: the intellectual power of its people. In many poor coun-tries where malnutrition is widespread, it is considered a problem that negatively affects the ability of children to learn and causes them to perform at a lower level in school [3]. Studies have shown that food insecurity is associated with academic performance of school age children [4, 5].
An intervention study showed that free school break-fast programs resulted in significant improvements in at-tendance, mathematics grades, behavior and decreases in hunger [6]. Another study showed that improvement in academic performance would be achieved once proper nutrition is achieved [7]. Children who were malnour-ished in early life are more likely to have lower school attendance and to score poorly in cognitive tests during school age as compared to well-nourished children [8]. Many studies done in different parts of the world showed that poor growth characteristics are associated with poor academic performance. A prospective cohort study from Canada revealed that though overweight does not increase risk for poor educational outcomes, being underweight increase risk for poorer cognitive out-comes [9]. A study from Southeast Asia showed that all poor growth characteristics (HAZ, WAZ and BAZ) and non-verbal IQ scores were associated negatively [10]. A study from Southern Ethiopia also found that better HAZ and WAZ were positively correlated with cognitive performance tests [11].
Ethiopia is one of the sub-Saharan African countries largely affected by child malnutrition [12]. Studies con-ducted in different parts of Ethiopia have shown that under nutrition is common among school age children. A study from northwest Ethiopia revealed that 32.3 % of school age children were undernourished (27.1 % under-weight and 11.2 % stunted) [13]. Another study from Gondar showed that the prevalence of stunting among school-aged children was 42.7 % in rural areas and 29.2 % in urban areas, while the corresponding figures for thinness were 21.6 and 20.8 % [14]. A study from eastern Ethiopia showed prevalence of stunting among school-aged children was 8.9 % of which 2 % had severe stunting [15]. A 2014 study in Addis Ababa, the nation’s capital found about 31 % of children were undernour-ished (19.6 % stunted, 15.9 % underweight) [16]. This implies that child malnutrition is still a public health problem in both urban and rural areas.
The future of a nation entirely depends on the welfare of its younger generation. Ethiopia is currently transi-tioning from the end of its first national growth and
transformation plan to the beginning of its second growth and transformation plan, of which its success will largely depend on the academic performance of its school children and their future contributions. In 2012/ 2013 the net enrolment rate in Primary Level (1–8) was 85.9 %. Similarly, the net enrollment rate at Primary Level in the nation’s largest and most populous region, Oromiya region, was 83.9 %. The national repetition rate among primary school students was found to be 7.9 % while the repetition rate of Oromiya region was 9 %. The dropout rate for Oromiya was 18.8 % while the na-tional was 15.7 % [17]. Therefore proper attention should be given to this group of children because their performance will impact the socioeconomic develop-ment of the entire country.
Though evidence about the magnitude of malnutrition is well established in Ethiopia, there is a paucity of evi-dence regarding how nutritional status is associated with academic performance among the nation’s school age children. Hence, this study is aimed to determine the as-sociation of nutritional status and cognitive performance with academic performance of school children in Goba town, South East Ethiopia.
Methods
Study area and period
An institutional based cross-sectional study design was employed in Goba town, Bale zone, Oromiya region, Southeast Ethiopia. The study was conducted from May to June 2014 among grade three elementary school students in Goba town. At the time the town had one preparatory school, two high schools, ten Kindergartens and 13 elementary schools, of which 7 were private and 6 were public [18]. The town schools also served the rural residents who live around the town. From these elementary schools, the study selected grade three stu-dents from randomly selected schools, in order to minimize inter-grade variability between different levels of grades. All of the student participants were of age 8 to 11 years old and had been enrolled in the school in 2013/2014 academic year.
Sample size and sampling procedure
The total number and list of students were obtained from each selected school. To determine the number of students included in the study from each school, we used proportional allocation based on the number of eligible students from each school. For schools which have more than one section of grade three dents, the same procedure was followed. Finally stu-dents were selected using a simple random sampling technique (computer generated random number). In any case when a randomly selected student was ab-sent on three consecutive data collection days; he/she was substituted by the next randomly selected student from the same class room.
Measurements
Socio-demographic characteristics were collected using structured questionnaire adopted from the Ethiopian demographic and health survey questionnaire [12]. Diet-ary intake was assessed using qualitative 24 h dietDiet-ary re-call method in a joint interview with both parent and child. From the qualitative 24 h dietary recall, dietary di-versity for each student was calculated based on the WHO eight food groups [20]. The cognitive function of the students was assessed using selected tests from the Kaufman Assessment Battery for Children (KABC-II) and Raven’s Colored Progressive Matrices (RCPM) [21, 22]. The KABC II used Number Recall, Word Order and Hand Movement for measuring sequential processing (short term memory). In KABC II, simul-taneous processing is measured by Rover and Trian-gles while planning (fluid reasoning) is assessed by using Pattern Reasoning. From KABC-II tests, core subsets for planning and conceptual thinking, were not administered because previous studies done in similar settings indicated that, most of the pictures in the subsets were not familiar to Ethiopian children [11, 23]. Tests for measuring learning and knowledge were not used for this study because they were not used previously in similar cultural settings. Raven’s Colored Progressive Matrices (RCPM) made up of three sets of twelve problems which measures the ability to solve problems and reasoning by analogy has been used extensively as a culturally fair test of intelligence [21]. Each of the cognitive tests (selected tests from KABC-II and RCPM) were administered by different well trained data collectors in separate class rooms with a quiet and distraction free environment. One data collector administered only one cognitive test for all study subjects to reduce inter individual differences. Anthropometric measurements (height and weight) were taken for all children included in the study. Body weight was recorded to the nearest 0.1 kg using the UNICEF SECA weighing scale. Instruments were checked daily against a standard
weight for accuracy. Calibration of the indicator against zero reading was checked before weighing every child. Children were weighed with light clothing and without shoes. Height was measured to the near-est 0.1 cm using the Shorr measuring board without shoes at Frankfort plane standing position. The age of children in completed years was obtained from school and confirmed from their parents. The academic per-formance of the school children was measured by col-lecting the preceding semester academic result from the school record. We used the students’ mathematics and overall average semester results to measure aca-demic performance.
Data entry, processing and analysis
Data were checked for completeness, cleaned, coded and entered into SPSS version 20 and WHO AnthroPlus Version 1.0.4 for analysis. The nutritional status of height-for-age, weight-for-age, and weight-for-height were calculated from measurements using WHO AnthroPlus and compared with reference data according to the WHO 2006 population. Children below negative 2 standard deviation (−2SD) according to the WHO median for weight-for-age, height-for-age and weight-for-height were considered under-weight, stunted or wasted, re-spectively. Normal was defined as Z-score greater than or equal to -2SD. A descriptive analysis was conducted to obtain summary statistics (frequencies, means and standard deviations). Pearson correlation was used to check the relationship between nutri-tional status and academic performance. The associ-ation between academic performance and cognitive performance was also measured by Pearson correl-ation. Those variables which were found statistically significant at P value less than 0.25 in the bivariate analysis were entered into the multivariable linear re-gression model to identify the independent predictors of academic performance. This cutoff point prevented removing variables that would potentially have an effect during multivariable analysis [24]. Variables with p-value less than 0.05 in the final multivariable model were accepted as statistically significant and declared as associated factors.
Ethical consideration
that the information they provided would be kept confidential.
Results
Socio-demographic characteristics
The majority of the study participants were Orthodox (97,74.8 %) by religion and Oromo by ethic group (66, 51.1 %). Ninety five (74.8 %) and 122 (93.1 %) of the school age children were from families who were currently on marriage and residing in urban areas, re-spectively. Nearly one third of (42,32.8 %) the chil-dren were from households headed by husbands. Fifty four (47.0 %) of the school age children had a father who attended formal education up to the level of high school. Nearly two thirds (84, 64.9 %) of the school age children were living with both their fathers and mothers. Nineteen (14.5 %) of school age chil-dren were living with their grandparents. Eighty four (63.4 %) of the school age children were male by sex. The mean (±SD) age of the school age children was 10.02 (±0.86) years (Table 1).
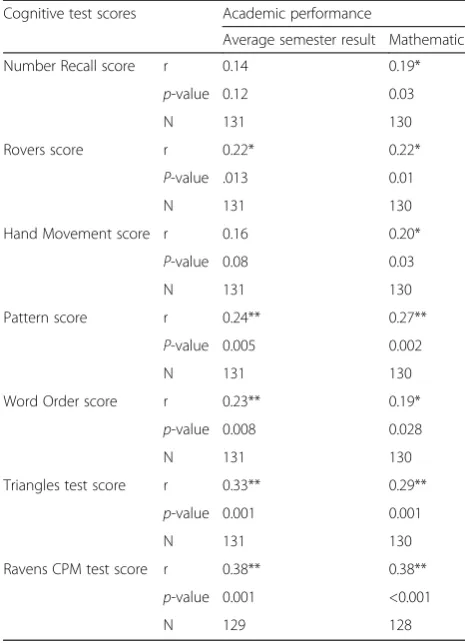
There was a statistically significant positive association between all cognitive test scores and average academic performance except for number recall (p= 0.12) and hand movements (p= 0.08). This study found that there was a statistically significant positive correlation between all cognitive test scores and mathematics score (p< 0.05) (Table 2).
As showed in Table 3, there was a statistically signifi-cant positive correlation between height for age Z score (HAZ) and mathematics score among school aged chil-dren (p= 0.026). However, both weight for age Z score (WAZ),and body mass index for age Z score (BAZ) had no statistically significant association with academic per-formance (average semester result and mathematics score) (p> 0.05).
Variables including residence, maternal education, pa-ternal education, diet diversity, meal frequency, breakfast habit, iodized salt consumption, sex of the child, occupa-tion, attendance of preschool program and family size were not significantly associated with academic perform-ance (P> 0.25). Hence those variables were excluded from the multivariable linear regression model.
In the bivariate analysis only height for age Z score and wealth index were significantly associated with mathematics score, qualifying as candidate variables for the multivariable linear regression model. Age and wealth index were positively associated with average score of all academic subjects (courses) of the preceding semester in the multivariable model.
In the multivariable linear regression model better wealth index was significantly associated with better mathematics score (ß = 0.63; 95 % CI: 0.12–0.74). A sin-gle unit change of wealth index resulted in 0.63 unit
Table 1Socio-demographic and economic characteristics of respondents in Goba Town, South east Ethiopia, 2014
Variables Frequency Percent
Religion Orthodox 97 74.8
Muslim 27 20.6
Protestant 6 4.6
Ethnic group Oromo 66 51.1
Amhara 60 45.8
Othersb 4 3.1
Marital status Married 95 74.8
Divorced 6 4.6
Separated 14 10.7
Widowed 13 9.9
Head of the household Husband 42 32.8
Wife 17 13.0
Both 54 41.2
Othersc 17 13
Place of residence Urban 122 93.1
Rural 9 6.9
Educational status of the father
Illiterate 12 10.3
Primary (1–8) 24 20.5
Secondary school (9–12)
54 47.0
Tertiary (>12) 26 22.2
Educational status of the mother
Illiterate 13 9.9
Primary (1–8) 43 32.8
Secondary (9–12) 51 38.9
Tertiary (>12) 17 13.0
Wealth index Poor 46 36.8
Medium 35 28.0
High 44 35.2
With whom the child lives Father only 4 3.1
Mother only 19 14.5
With both 84 64.9
Grand parents 19 14.5
Othersa 4 3.1
Sex Male 83 63.4
Female 48 36.6
School type Private schools 67 51.1
Governmental schools
64 48.9
Family size ≤3 32 24.6
4–5 61 46.9
≥6 37 28.5
a
Aunts, sister, religious brothers, any non relativesb
Gurage, Tigre Wolayita
c
change in mathematics score. Height for age Z score was found positively associated with mathematics score in the multivariable model. A single unit change in height for age Z score resulted in 2.11 unit change in mathematics score (ß = 2.11; 95 % CI: 0.002–4.21). A
single unit change in wealth index resulted in 0.53 unit change in average score of all academic subjects among school age children (ß = 0.53; 95 % CI: 0.11–0.95). Older children scored significantly higher in average semester result. A single unit change of age results 3.23 unit change in average score of all academic subjects among school age children (ß = 3.23; 95 % CI: 1.20–5.27).
Discussion
This study found that WAZ and BAZ were not significantly associated with average semester results or mathematics score among school age children, age 8–11 years. Similarly a study from Malaysia found no association between poor nutritional status and school performance among a sample of 7 to 8 years old pri-mary school children [25]. However, in contrast to the finding of this study, studies have shown that higher WAZ is positively associated with academic performance [26, 27]. High WAZ score is associated with better cognitive performance [11]. The small sample size of this study possibly a reason for ab-sence of association between WAZ and academic performance. Additionally, this study was conducted among school age children attending urban schools, where prevalence of underweight is tends to be lower than in rural schools. Therefore the effect of under-weight on academic performance in a study popula-tion where malnutripopula-tion prevalence is low might not reflect the effect at a population level. The absence of association between BAZ and academic performance might be explained by the fact that BAZ indicates acute nutritional status and do not interfere with cog-nitive functioning.
This study found that good HAZ score was signifi-cantly associated with higher mathematics scores. Simi-lar finding came from a study conducted in Sri Lanka which showed that higher HAZ score is associated with better academic score [27]. Height-for-age reflects the ac-cumulation of nutritional deprivation throughout the years, which may consequently affect educational achieve-ment of children [28]. A study from Uganda revealed that HAZ had statistically significant positive associations with learning achievement in English (language) and mathem-atics among grade 4 children [29]. A study among grade 4 children in Sri Lanka showed a significant positive associ-ation between height-for-age and examinassoci-ation scores [30]. Stunted children have shown more anxiety, depression and lower self-esteem than their non stunted counter parts [31]. Similarly, protein malnutrition (and low energy availability in general) may have negative effects on brain development. Chronic protein energy malnutrition (stunt-ing) affects the ongoing development of higher cognitive processes during childhood years [32, 33]. Stunted chil-dren have impaired behavioral development in early life
Table 2Correlation between cognitive function test and academic performance among school aged children in Goba Town, South east Ethiopia, May 2014
Cognitive test scores Academic performance
Average semester result Mathematics
Number Recall score r 0.14 0.19*
p-value 0.12 0.03
N 131 130
Rovers score r 0.22* 0.22*
P-value .013 0.01
N 131 130
Hand Movement score r 0.16 0.20*
P-value 0.08 0.03
N 131 130
Pattern score r 0.24** 0.27**
P-value 0.005 0.002
N 131 130
Word Order score r 0.23** 0.19*
p-value 0.008 0.028
N 131 130
Triangles test score r 0.33** 0.29** p-value 0.001 0.001
N 131 130
Ravens CPM test score r 0.38** 0.38** p-value 0.001 <0.001
N 129 128
*Statistically significant at p <0.05, **Statistically significant at p<0.01
Table 3Correlation between anthropometric Z scores and academic Achievement among school aged children in Goba Town, South east Ethiopia, May 2014
Anthropometric z scores
Academic performance
Average semester score Mathematics score
HAZa r 0.103 0.197a
p-value 0.249 0.026
N 128 127
WAZb r 0.061 0.099
P-value 0.497 0.270
N 127 126
BAZc r −0.029 −0.061
p-value 0.743 0.496
N 127 126
a
[34] and have poorer cognitive ability [35] than non-stunted children. Brain functions such as cognition, mem-ory and locomotors skills are affected by under nutrition [36, 37]. However, the associations between poor linear growth and impaired neurodevelopment are not well understood [36]. Cognitive functioning might mediate the association between stunting and academic performance. This study found that all the cognitive test scores were significantly associated with the mathematics scores. Ex-cept number recall and hand movement, all other cogni-tive tests were correlated with average semester results.
This study found that higher wealth index is associated with better mathematics score of school age children. Many consistent findings were reported from different part of the world. Food security, which is correlated with wealth index has predicted impaired academic perform-ance in mathematics for girls and boys [4]. A meta ana-lysis study showed that there is a strong correlation between socio economic status and academic perform-ance [38]. Poor socioeconomic condition of the family is one of the determinants for poor school performance among children [39]. Primary school children in Malaysia from the lower income group had significantly poorer aca-demic performance [2]. The association between socio economic status and academic achievement widens with increasing age. Socio‐economic gaps in the early school years has long lasting consequences. Particularly, as chil-dren in low socio economic status get older, their situation tends to worsen [40]. The association between socioeco-nomic status and academic achievement is complex and included several factors such as nutrition, school environ-ment, home living environenviron-ment, material support etc. Socio economic status might affect educational per-formance due to its influence on affordability of quality of residence, access and affordability of Infor-mation Communication facilities and services, and li-brary materials which deal with academic matters [41]. Low socioeconomic status is associated with chronic stress which has long term negative conse-quences on brain development [42]. Furthermore, low socioeconomic individuals have high levels of stress hormones such as cortisol and catecholamines [43].
This study implies that academic performance is af-fected by chronic malnutrition and wealth. The educa-tion sector, which largely determines the welfare of a country, can be improved by investing in nutrition, par-ticularly on chronic malnutrition. Stunting begins in utero and continues for at least the first 2 years of post-natal life; the period from conception to a child’s second birthday (the first one thousand days) has therefore been identified as the most critical window of opportunity for interventions. There are proven interventions to prevent stunting such as exclusive breastfeeding, complementary feeding, infection prevention, sanitation and hygiene.
Nutrition interventions should also be strengthened in schools to improve children’s academic performance. Improving the socioeconomic status of a community has profitable gains in terms of students’academic perform-ance and development of the nation.
This study had some limitations. The first limitation was its small sample size and biased inclusion of chil-dren mostly from urban residency. This study used only anthropomorphic measurements and did not assess the micronutrients status of study participants. Furthermore, there may have been differences in the evaluation system for students’ academic performance among the public and private schools. Finally, physical performance cap-acity and motor skills were not measured in this study.
Conclusion
Nutritional status and wealth could be additional modifi-able factors to improve academic performance of the children. Moreover, interventions to improve nutrition for mothers and children may be an important contribu-tor to academic success and national economic growth in Ethiopia Further study with a strong design and large sample size is important.
Competing interest
The authors declare that they have no competing interests.
Authors’contribution
DH, KG, DN and HD conceived the study. DH performed the data management and analysis, contributed in the interpretation of data and drafting the manuscript and critically reviewed the manuscript. KG performed the data collection, contributed in the interpretation of data, drafted the manuscript and critically reviewed the manuscript. DN performed the data collection, contributed in the interpretation of data, and critically reviewed the manuscript. HD performed the data collection, contributed in the interpretation of data, and critically reviewed the manuscript. All authors have contributed equally to this manuscript. All authors read and approved the final manuscript.
Acknowledgment
We would like to acknowledge Madawalabu University for financing this study. We are also grateful to thank Lianna Tabar, WEEMA International, Brookline, MA, USA for her professional language editing and reviewing the manuscript.
Author details
1
School of Public Health, College of Medicine and Health Sciences, Bahir Dar University, Bahir Dar, Ethiopia.2Department of Nursing College of Medicine and Health Sciences, Madawalabu University, Bale Goba, Ethiopia. 3Department of Public Health, College of Medicine and Health Sciences, Debre Tabor University, Debre Tabor, Ethiopia.
Received: 17 November 2015 Accepted: 1 March 2016
References
1. Zalilah M, Bond J, Johnson N. Nutritional status of primary school children from low income households in Kuala Lumpur. Malays J Nutr. 2000;6:17–32. 2. Anuar M, Lim C, Low W, Harun F. Effects of nutritional status on academic
performance of Malaysian primary school children. Asia Pac J Public Health. 2005;17:81–7.
4. Jyoti D, Frongillo E, Jones S. Food insecurity affects school children’s academic performance, weight gain, and social skills. J Nutr. 2005;135:2831–9.
5. Frongillo E, Jyoti DF, Jonesy S. Food stamp program participation is associated with better academic learning among school children. J Nutr. 2006;136:1077–80.
6. Kleinman R, Hall S, Green H, Korzec-Ramirez D, Patton K, Pagano M, et al. Diet, breakfast, and academic performance in children. Ann Nutr Metab. 2002;46(1):24–30.
7. Rausch R. Nutrition and Academic Performance in School-Age Children The Relation to Obesity and Food Insufficiency. J Nutr Food Sci. 2013;3:190. 8. Alaimo K, Olson C, Frongillo E. Food insufficiency and American
school-aged children’s cognitive, academic, and psychosocial development. Paediatrics. 2001;108:44–53.
9. Bisset S, Foumier M, Pagani L, Janosz M. Predicting academic and cognitive outcomes from weight status trajectories during childhood. Int J Obes (Lond). 2013;37(1):154–9.
10. Sandjaja PBK, Rojroonwasinkul N, Le Nyugen BK, Budiman B, Ng LO, et al. Relationship between anthropometric indicators and cognitive performance in Southeast Asian school-aged children. Br J Nutr. 2013;110(3):S57–64. 11. Alemtsehay B, Stoecker B, Kennedy T, Hubbs-Tait L, Thomas D, Abebe Y,
et al. Nutritional status and cognitive performance of mother-child pairs in sidama zone, southern Ethiopia. Matern Child Nutr. 2013;9(2):274–84. 12. Central Statistical Agency (CSA) Ethiopia. Demographic and Health Survey
2011. Addis Ababa, Ethiopia and Calverton, Maryland, USA: CSA and ORC Macro; 2011.
13. Alelign T, Degarege A, Erko B. Prevalence and factors associated with undernutrition and anaemia among school children in Durbete Town, northwest Ethiopia. Arch Public Health. 2015;73(1):34.
14. Herrador Z, Sordo L, Gadisa E, Moreno J, Nieto J, Benito A, et al. Cross-Sectional Study of Malnutrition and Associated Factors among School Aged Children in Rural and Urban Settings of Fogera and Libo Kemkem Districts, Ethiopia. PLoS ONE. 2014;9(9):e105880.
15. Mesfin F, Berhane Y, Worku A. Prevalence and associated factors of stunting among primary school children in Eastern Ethiopia. Nutr Diet Suppl. 2015;7:61–8.
16. Degarege D, Degarege A, Animut A. Undernutrition and associated risk factors among school age children in Addis Ababa, Ethiopia. BMC Public Health. 2015;15:375.
17. Ethiopian Ministry of Education. Education statistics Annual Abstract: Available at http://www.moe.gov.et/English/Resources/Documents/eab05. pdf.2012/2013.
18. Goba woreda education office. Goba woreda education office annual report. 2013.
19. Faul F, Erdfelder E, Lang A, Buchner A. G*Power 3: A flexible statistical power analysis program for the social, behavioral, and biomedical sciences. Behavior research method: Available at http://www.gpower.hhu.de/ fileadmin/redaktion/Fakultaeten/Mathematisch-Naturwissenschaftliche_ Fakultaet/Psychologie/AAP/gpower/GPower3-BRM-Paper.pdf. 2007. 20. WHO U, IFPRI, UC Davis, USAID, FANTA,.Indicators for assessing infant and
young child feeding practices. Geneva, Switherland World Health Organization (http://apps.who.int/iris/bitstream/10665/43895/1/ 9789241596664_eng.pdf) date accessd May 25, 2011). 2008.
21. Raven J. The Raven’s Progressive Matrices: change and stability over culture and time. Cogn Psychol. 2000;41:1–48.
22. Kaufman A, Kaufman N. Kaufman assessment battery for children. 2nd ed. Circle Pines: Pearson (AGS); 2004.
23. Girma M, Loha E, Stoecker B. Iodine deficiency, anthropometric status cognitive function of school age children in Hawassa town, Southern Ethiopia. Msc.thesis submitted to Human Nutrition Graduate Program, College of Agriculture School of Graduate Studies Hawassa University: 2009. 24. Peter C, Jack V. Automated variable selection methods for logistic
regression produced unstable models for predicting acute myocardial infarction mortality. J Clin Epidemiol. 2004;57:1138–46.
25. Ong LC, Chandran V, Lim YY, Chen AH, Poh BK. Factors associated with poor academic achievement among urban primary school children in Malaysia. Singapore Med J. 2010;51(3):247–52.
26. HamidJan JM, AmalMitra K, Hasmiza H, Pim CD, Ng LO, WanManan WM. Effect of gender and nutritional status on academic achievement and cognitive function among primary school children in a rural district in Malaysia. Malays J Nutr. 2011;17(2):189–200.
27. Sarma MSG, Wijesinghe DGNG, Sivananthawerl T. The Effects of Nutritional Status on Educational Performance of Primary School Children in the Plantation Sector in Nuwara Eliya Educational Zone. Trop Agric Res. 2013;24(3):203–14.
28. Shariff ZM, Bond JT, Johnson NE. Nutrition and educational achievement of urban primary school children in Malaysia. Asia Pac J Clin Nutr. 2000;9(4):264–73.
29. Acham H, Kikafunda JK, Oluka S, Malde MK, Tylleskar T. Height, weight, body mass index and learning achievement in Kumi district, East of Uganda. Sci Res Essay. 2008;3(1):1–8.
30. Aturupane H, Glewwe P, Wisniewski S. The impact of School Quality, Socio-Economic Factors and Child Health on Students’Academic Performance: Evidence from Sri Lankan Primary Schools.Available at http://siteresources.worldbank.org/INTSOUTHASIA/Resources/ ImpactOfSchoolQuality_July2007.pdf.
31. Walker S, Chang S, Powell C, Simonoff ES, Grantham-McGregor S. Early childhood stunting is associated with poor psychological functioning in late adolescence and effects are reduced by psychosocial stimulation. J Nutr. 2007;137:2464–9.
32. Kar B, Rao SL, Chandramouli BA. Cognitive development in children with chronic protein energy malnutrition. Behav Brain Funct. 2008;4:31. 33. Crookston BT, Dearden KA, Alder SC, Porucznik CA, Stanford JB, Merrill RM,
et al. Impact of early and concurrent stunting on cognition. Matern Child Nutr. 2011;7(4):397–409.
34. Lasky RE, Klein RE, Yarbrough C, Engle PL, Lechtig A, Martorell R. The relationship between physical growth and infant behavioral development in rural Guatemala. Child Dev. 1981;52:219–26.
35. Casale D, Desmond C, Richter L. The association between stunting and psychosocial development among preschool children a study using the South African Birth to Twenty cohort data. Child Care Health Dev. 2014;40(6):759–914.
36. Levitsky DA, Strupp BJ. Malnutrition and the brain: changing concepts, changing concerns. J Nutr. 1995;125:2212–20.
37. Ranade SC, Rose A, Rao M, Gallego J, Gressens P, Mani S. Different types of nutritional deficiencies affect different domains of spatial memory function checked in a radial armmaze. Neuroscience. 2008;152:859–66.
38. Sirin SR. Socioeconomic Status and Academic Achievement: A Meta-Analytic Review of Research. Rev Educ Res. 2005;75(3):417–53.
39. Kim H, Frongillo E, Han S, Oh S, Kim W, Jang Y, et al. Academic performance of Korean children is associated with dietary behaviours and physical status. Asia Pac J Clin Nutr. 2003;12(2):186–92.
40. Daniel H. Caro Socioeconomic Status and Academic Achievement Trajectories from Childhood to Adolescence. Can J Educ. 2009;32(3):558–90. 41. Okioga CK. The impact of students’socio-economic background on
academic performance in Universities, a case of students in Kisii University College. Am Int J Soc Sci. 2013;2(2):38-45.
42. Turner RJ, Avison WR. Status variations in stress exposure: implications for the interpretation of research on race, socioeconomic status, and gender. J Health Soc Behav. 2003;44(4):488–505.
43. Cohen S, Doyle WJ, Baum A. Socioeconimic status is associted with stress hormones. Psychosom Med. 2006;68(3):414–20.
• We accept pre-submission inquiries
• Our selector tool helps you to find the most relevant journal • We provide round the clock customer support
• Convenient online submission • Thorough peer review
• Inclusion in PubMed and all major indexing services • Maximum visibility for your research
Submit your manuscript at www.biomedcentral.com/submit