Copyright © 2014 IJECCE, All right reserved
Optimization of Determinant Factors of Satellite
Electrical Power System with Particle Swarm
Optimization (PSO) Algorithm
Mojtaba Biglarahmadi
*Dr. S. M. Mousavi Badjani
Ali Nahari
Dr. S. A. Mousavi
Faculty of Electrical Engineering, Malek Ashtar University of
Technology, Esfahan, Iran [email protected]
Faculty of Electrical Engineering, Malek Ashtar University of
Technology, Esfahan, Iran [email protected]
Iranian Gas Transmittion. Co., District 10,
Bushehr, Iran [email protected]
Faculty of Electrical Engineering, Iran University of Science and
Technology, Tehran, Iran. [email protected]
Abstract – Weight and dimension, cost, and performance are determinant factors for design, fabrication, and launch the satellites which are related to the mission type of the satellites. Each satellite includes several subsystems such as Electrical Power Subsystem (EPS), Navigation Subsystem, Thermal Subsystem, etc. The purpose of this paper is to optimize these determinant factors by Particle Swarm Optimization (PSO) algorithm, for Electrical Power Subsystem. This paper considers the effects of selecting various types of Photovoltaic (PV) cells and batteries on weight and dimension, cost, and performance of the satellite. We have used two various types of PVs and two various type of batteries in optimization of the Electrical Power Subsystem (EPS).
Keywords–Satellite Electrical Power Subsystem, Particle Swarm Optimization, Determinant Factors, Photovoltaic (PV) Cells, Batteries.
I. I
NTRODUCTIONThere are several objectives in optimization of the Electrical Power Subsystem such as weight, cost, and performance. To achieve these objectives, we have to carefully consider conditions and concepts of the satellites power system. This paper can optimize the satellite power system by means of different elements and their configurations and by using various technologies. With considering these two options, we can formulate design optimization problem and find required tools to implement it. Then with optimization and obtaining optimal solution, better results for satellite sizing and its simulation can be achieved. With extending optimization tools, we can use evolutionary algorithm for PV cells modeling and EPS design. These evolutionary algorithms can be used for general design analysis and satellite power subsystem in two multi-objective solutions: Classic Solution (weighted sum) and Real Multi-objective Solution. In fact, this paper aims to create a model to formulate EPS design problem as an optimization problem which help us to select optimal components.
II. S
ATELLITEE
LECTRICALP
OWERS
UBSYSTEMElectrical Power Subsystem has to supply all satellite particles entire the mission, whether particles are supplied by batteries or be on the orbit. Generally, this subsystem has to:
• Supply the electrical power of the total spacecraft system in all mission phases.
• Control, regulate, and appropriately distribute electrical power among all subsystems.
• Control the performance and status of the Electrical Power System from the earth.
• Convert direct current (DC) to alternative current (AC) if needed.
Generally, the Electrical Power Subsystem in a satellite or spacecraft is composed of four sections, as shown in Fig.1.
Fig.1. Main sections of the Electrical Power Subsystem The satellite Electrical Power Subsystem includes sections like photovoltaic arrays, batteries, loads, Power Control Unit (PCU), Power Management And Distribution unit (PMAD), etc. Fig 2 shows block diagram of the EPS. Photovoltaic arrays produce all or a part of the satellite electrical power in sun-light time and batteries fulfill the satellite power demand in launch phase, eclipse time, and when the produced power of the photovoltaic arrays are lower than satellite required power [1].
Fig.2. Electrical power system functional block diagram [1].
Photovoltaic Cells Technology
Photovoltaic cells technologies include Silicon (Si), High Efficiency Silicon (High-η Si), Gallium Arsenide Single Junction (GaAs/Ge SJ), Gallium Arsenide Double Junction (GaInP2/GaAs/Ge DJ), Gallium Arsenide Triplet Junction (GaInP2/GaAs/Ge TJ), and Ultra Triplet Junction
Satellite Electrical Power Subsystem
Power generating
system
Power storage system
Power control and adjust
system
power distribution and
Copyright © 2014 IJECCE, All right reserved (UTJ). Photovoltaic cell technologies used for
optimization in this paper are High Efficiency Silicon (High-η Si) and Ultra Triplet Junction (UTJ). Although Silicon photovoltaic cells are still in use, because of their inexpensiveness, but High Efficiency Silicon (High-η Si) Photovoltaic cells, because of higher efficiency and lower mass density, and Multi-junction photovoltaic cells,
having efficiency twice the Silicon photovoltaic cells, are more interesting. A comparison of Begin Of Life efficiency (BOL), power, mass, cost, thermal coefficients and illumination intensity reduction factors (P/Po) in different illumination levels for various photovoltaic cells technologies is presented in Table 1.
Table 1: Comparison of solar cell characteristics (courtesy of [2], [3]) Solar Cell
Technology
BOL Efficiency (28ºC)
BOL Power (W/m2 )
Cost (K$/Kg)
Mass (Kg/m2)
Power Temperature Coefficients (%/ºC)
Si 13.7 185 20 0.55 -0.045
High-η Si 16 216 50 0.28 -0.0415
GaAs/GeSJ 19 253 140 0.83 -0.022
GaInP2/GaAs/GeDJ 22 297 140 0.85 -0.03
GaInP2/GaAs/GeTJ 25 337 150 0.85 -0.06
Ultra Triplejunction (UTJ) 28 378 170 0.86 -0.06
Battery Technologies
Most commonly used batteries in spacecraft applications are rechargeable Nickel Cadmium (NiCd) batteries, Nickel Hydrogen (NiH2) batteries, and lately Lithium-ion (Li-ion)
batteries. In recent years, Lithium-ion (Li-ion) batteryis the most studied technology [4], [5]. In this paper two
types of batteries: Nickel Hydrogen (NiH2) and
Lithium-ion (Li-Lithium-ion) are used for optimizatLithium-ion. Electrical characteristics such as nominal voltage, cell specific power, function temperature and energy density for three aforementioned batteries are represented in Tabale 2.
Table 2: Typical battery cell characteristics comparison (courtesy of [4]) Battery
Technology
Cell Nominal Voltage (V)
Cell Average Discharge Voltage (V)
Cell-Specific Energy (W-hr/Kg)
Cell-Specific Power (W/Kg)
NiCd 1.45 1.25 40-50 150-200
NiH2 1.55 1.25 45-65 150-200
Li-ion 4.1 3.5 90-150 200-220
III. P
ARTICLES
WARMO
PTIMIZATIONA
LGORITHMThe optimization algorithm used in this paper is particle swarm optimization (PSO). PSO starts with a group of random particles and then search for optimal particles with updated products. Each particle is a point in N-dimensional and its new position is obtained by the experiences of itself and other particles. Each particle continue its path in solution space regarding to the best solution ever experienced by that particle.
In fact, in each step each particle is updated with following two optimized values:
• The best solution (fitness) which is experienced by that particle itself, up to now. This value is Best Personal Solution called “pbest”.
• The best solution which is experienced by all the particles neighbouring that particle. This value is the Best General Solutioncalled “gbest”.
The main concept of the PSO is to accelerate each particle with regard to its “pbest” and “gbest” positions, with a randomly obtained weight, in each step. PSO simulates the swarming behavior of birds. Consider the following scenario: a swarm of birds are searching for food randomly in a region and there is just one piece of food in this region. None of the birds have any information
about the position of the food, but they know their distance from the food in each step. The problem, here, is to find the best strategy to reach the food. One of the effective methods is to follow the birds having the smallest distance from the food. PSO algorithm uses this searching scenario to solve the optimization problems.
IV. S
ATELLITEP
OWERS
UBSYSTEMM
ASSE
STIMATIONThe mass of the EPS is the sum of individual masses of the photovoltaic cells, batteries, Power Control Unit (PCU) and Power Management And Distribution (PMAD) unit, calculated according to the Eq. (1) [6], [7]:
( )
eps sa batt batt PMAD PCU
M M M N M M (1)
In this equation, Mscell, Mbatt, Mpcu, and MPMAD are the
masses of the photovoltaic array, batteries, Power Control Unit, and PMAD, respectively. The total mass of the photovoltaic array is calculated according to Table 1 and by Eq. (2):
(
) (
)
sa scell sctotal areal array
M
M
A
M
A
(2)in which Mscell, Mareal, Aarray, and Asctotal are the masses of
Copyright © 2014 IJECCE, All right reserved photovoltaic cells, respectively. The mass of the batteries
is calculated according to the energy density of the battery cells (ρcell) and with Eq. (3):
batt batt cell avg
M
= 1.1 (Ah
N
V
cell)
(3)in which the mass of the PMAD is obtained from Eq. (4):
PMAD box cable
M
M
M
(4)in which the box mass (Mbox) and cable mass (Mcable) is
calculated from linear Eq. (5) and (6): 0.02
box sa
M P (5)
0.015
Mcable Psa (6)
Also, the mass of the Power Control Unit is obtained from Eq. (7):
0.025
pcu sa
M P (7)
V. S
ATELLITEP
OWERS
YSTEMC
OSTE
STIMATIONThe cost of the EPS is obtained by the sum of the individual costs of photovoltaic array (Csa), battery (Cbatt),
and total cost of the projection system calculated from Eq. (8) [2], [8].
eps sa batt batt eps launch
C
= C + (C
N
) (M
R
)
(8)photovoltaic array cost (Cbatt) is obtained by Eq. (9):
(
)
(
)
sa scell sctotal areal array
C
C
A
C
A
(9)Battery cost (Cbatt) is obtained by Eq. (10):
batt Ah batt
C
C
Ah
(10)in which CAh, the battery cost for an ampere-hour, is equal to 4020, 7400, and 10000 dollars per ampere-hours for Nickel Cadmium (NiCd), Nickel Hydrogen (NiH2), and Lithium-ion (Li-ion) batteries, respectively.
VI. O
PTIMIZATIONThere are several and different methods for multi-objective problem leading. The most classic and extensive method is to use weighted sum method in which a weight or coefficient is assigned to each objective and sum of these weighted objectives leads to a unique objective function. This method is used in this paper. The weighted sum objective function, M, is formulated by Eq. (11).
1
( ) ( )
M j jj
F x
f x (11)In this equationis the weight which depicts the relational importance of the j’th objective function. With choosing various for different objectives, the priority and excellence of determinant factors are highlighted. The sum of all weights should be equal to 1.
VII. P
ROBLEME
XPRESSIONIn this study, a Low Earth Orbit (LEO) mission with medium power rating is considered as an optimization
problem which must to be solved by PSO algorithm. The parameters of this mission and their demanded powers are listed in Table 3. These demands must be supplied and the designed EPS must have minimum mass and cost and maximum performance, simultaneously.
Table 3: List of mission parameters
Parameter name Value
Orbit altitude 500 km
Mission life 2 Yrs
Day light power requirements 140 kW Eclipse power requirements 80 kW Sun-orbit-plane angle (β) 10º
VIII. O
BJECTIVEF
UNCTIONF
ORMULATIONIn this paper, first of all, we summarized the problem to a weighted sum problem. The objective function used in optimization is based on minimizing system mass (Wm),
system cost (Wc), and inverse coefficient of system
performance (Wipi). The last one means to maximize EPS
performance. This objective function is shown in Eq. (12):
m m
c c
ipi ipiJ
W
W
W
(12)In this equation, ω represents the weight assigned to each factor and W represent the value of each objective. In fact, the EPS performance factor shows the performance of the total system. This factor takes photovoltaic array efficiency (FoMsa) and system reliability (Reps) into
consideration. Since this problem is formulated as a minimizing problem, this factor has been taken into account by an inverse coefficient, calculated by Eq. (13), (14), and (15):
m sa batt PMAD PCU
W M M M M (13)
In these equations, Msa, MPMAD, and MPCUare the mass of
photovoltaic cell, batteries, Power Management and Distribution unit, and Power Control Unit, respectively.
Launch
c sa batt
W C C C (14)
in which Csa, Cbatt, and Claunchare the costs of photovoltaic
cell, batteries, and launch, respectively.
1 1
ipi
sa eps
W
FoM R (15)
in which FoMsais photovoltaic cell efficiency, calculated
from Eq. (16) [2], and Reps is system reliability.
2 3
sa sa
sa sa
P
FoM
M
A
(16)IX. D
ESIGNV
ARIABLESCopyright © 2014 IJECCE, All right reserved Table 4: Design Variables
Variables J
Wm(kg)
Wc(104$)
Wipi
Msa(kg)
Mbatt(kg)
Mpmad(kg)
Mpcu(kg)
Cbatt(104$)
Csa(104$)
Claunch(104$)
X. O
PTIMIZATIONR
ESULTS WITHPSO
A
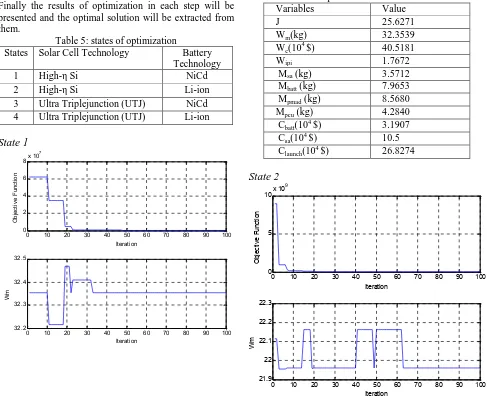
LGORITHMIn this section the results of optimization with PSO algorithm for four states, shown in Table 5, is presented. Finally the results of optimization in each step will be presented and the optimal solution will be extracted from them.
Table 5: states of optimization
States Solar Cell Technology Battery Technology
1 High-η Si NiCd
2 High-η Si Li-ion
3 Ultra Triplejunction (UTJ) NiCd 4 Ultra Triplejunction (UTJ) Li-ion
State 1
Fig3. Fitness values of individual and weighted sum objective over optimization for State 1 Table 6: Optimization Results for State 1
Variables Value
J 25.6271
Wm(kg) 32.3539
Wc(104$) 40.5181
Wipi 1.7672
Msa(kg) 3.5712
Mbatt(kg) 7.9653
Mpmad(kg) 8.5680
Mpcu(kg) 4.2840
Cbatt(104$) 3.1907
Csa(104$) 10.5
Claunch(104$) 26.8274
State 2
0 10 20 30 40 50 60 70 80 90 100 0
2 4 6 8x 10
7
Iteration
O
bj
ec
tiv
e
Fu
nc
tio
n
0 10 20 30 40 50 60 70 80 90 100 32.2
32.3 32.4 32.5
Iteration
W
m
0 10 20 30 40 50 60 70 80 90 100 40.6
40.8 41 41.2
Iteration
W
c
0 10 20 30 40 50 60 70 80 90 100 1.764
1.766 1.768 1.77 1.772
Iteration
W
ip
i
0 10 20 30 40 50 60 70 80 90 100 0
5 10x 10
9
Iteration
O
bj
ec
tiv
e
Fu
nc
tio
n
0 10 20 30 40 50 60 70 80 90 100 21.9
22 22.1 22.2 22.3
Iteration
W
Copyright © 2014 IJECCE, All right reserved Fig.4. Fitness values of individual and weighted sum
objective over optimization for State 2 Table 7: Optimization Results for State 2
Variables Value
J 21.4486
Wm(kg) 21.9598
Wc(104$) 40.5033
Wipi 1.7121
Msa(kg) 3.5029
Mbatt(kg) 2.9253
Mpmad(kg) 8.4042
Mpcu(kg) 4.2021
Cbatt(104$) 9.2661
Csa(104$) 10.2993
Claunch(104$) 20.938
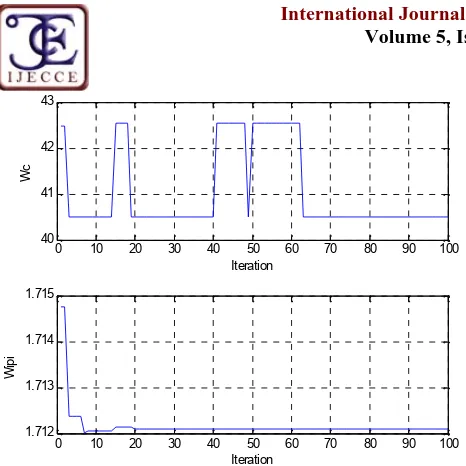
State 3
Fig.5. Fitness values of individual and weighted sum objective over optimization for State 3 Table 8: Optimization Results for State 3
Variables Value
J 25.3524
Wm(kg) 31.0037
Wc(10 4
$) 42.1087
Wipi 1.0612
Msa(kg) 2.1832
Mbatt(kg) 7.9653
Mpmad(kg) 8.5932
Mpcu(kg) 4.2966
Cbatt(104$) 3.1907
Csa(104$) 13.5758
Claunch(104$) 25.3422
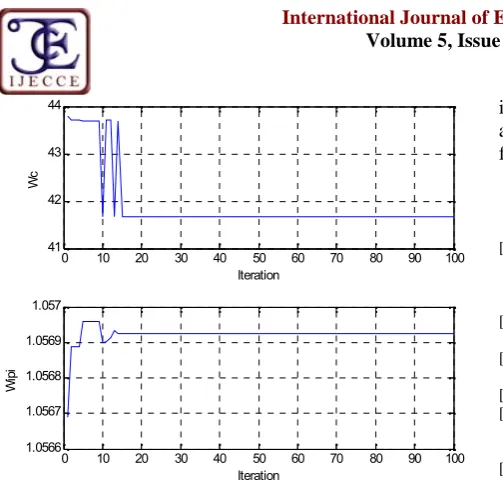
State 4
0 10 20 30 40 50 60 70 80 90 10040 41 42 43
Iteration
W
c
0 10 20 30 40 50 60 70 80 90 100 1.712
1.713 1.714 1.715
Iteration
W
ip
i
0 10 20 30 40 50 60 70 80 90 100 0
5 10 15x 10
9
Iteration
Ob
je
ct
iv
e
Fu
nc
tio
n
0 10 20 30 40 50 60 70 80 90 100 30.95
31 31.05 31.1 31.15
Iteration
W
m
0 10 20 30 40 50 60 70 80 90 100 42.1
42.2 42.3 42.4
Iteration
W
c
0 10 20 30 40 50 60 70 80 90 100 1.061
1.0611 1.0612 1.0613 1.0614
Iteration
W
ip
i
0 10 20 30 40 50 60 70 80 90 100 0
0.5 1 1.5
2x 10
10
Iteration
O
bj
ec
tiv
e
Fu
nc
tio
n
0 10 20 30 40 50 60 70 80 90 100 20.4
20.5 20.6 20.7 20.8
Iteration
W
Copyright © 2014 IJECCE, All right reserved Fig.6. Fitness values of individual and weighted sum
objective over optimization for State 4 Table 9: Optimization Results for State 4
Variables Value
J 20.9922
Wm(kg) 20.4374
Wc(104$) 41.6672
Wipi 1.0569
Msa(kg) 2.1128
Mbatt(kg) 2.9253
Mpmad(kg) 8.316
Mpcu(kg) 4.158
Cbatt(104$) 9.2661
Csa(104$) 13.1379
Claunch(10
4
$) 19.2633
XI. C
OMPARISON OFPSO R
ESULTS OFF
OURS
TATEWith considering four optimization states with PSO algorithm, we found out that state number 4 is the optimal state and its objective function value is lower than the others Table 9 represents a brief comparison between these four states.
Table 9: Comparison Results of Four State Variables State 1 State 2 State 3 State 4
J 25.6271 21.4486 25.3524 20.9922
Wm(kg) 32.3539 21.9598 31.0037 20.4374
Wc(104$) 40.5181 40.5033 42.1087 41.6672
Wipi 1.7672 1.7121 1.0612 1.0569
XII. C
ONCLUSIONIn optimizing a satellite, the mass of satellite is not the main criterion and there are several other factors. Cost, performance, mission type, longevity, orbit period, altitude, etc. are other determinant factors for an optimization. Therefore these determinant factors all together can lead to optimal tools for simulation and real design of a satellite to have the best outputs. In this paper
it is conclude that the type of battery and photovoltaic array have important effects on minimizing objective function.
R
EFERENCES[1] S.-S. Jang and J. Choi, "Energy balance analysis of small satellite in Low Earth Orbit (LEO)," in Power and Energy Conference, 2008. PECon 2008. IEEE 2nd International, 2008, pp. 967-971.
[2] R., R. M., “Space solar cell-tradeoff analysis,” Solar energy
materials and solar cells, May 2003, pp. 175–208.
[3] Spectrolab, “Spectrolab Products- Space -Cells,”http://www. spectrolab.com/prd/space/ cell-main.asp, 2008.
[4] Patel, M. R., Spacecraft power systems, CRC Press, 2005. [5] M. Broussely and G. Pistoia, Industrial applications of batteries:
from cars to aerospace and energy storage: Elsevier Science, 2007.
[6] S. Asif and Y. Li, "Spacecraft Power Subsystem Technology Selection," in Vehicle Power and Propulsion Conference, 2006. VPPC'06. IEEE, 2006, pp. 1-6.
[7] H. T El-Madany, et al., "Optimization and Feasibility Analysis of Satellite Earth Station Power System Using Homer," TELKOMNIKA (Telecommunication, Computing, Electronics and Control), vol. 10, pp. 359-370, 2012.
[8] S. Habraken, et al., "Space solar arrays and concentrators," Acta Astronautica, vol. 48, pp. 421-429, 2001.
A
UTHOR’
SP
ROFILEMojtaba Biglarahmadi
was born in Babol, Iran, on July 07, 1987. He received the B.Sc. in electrical power engineering in 2010. He is currently pursuing a M.Sc. degree in electrical power engineering. His research interests are photovoltaic energy conversion, distribution system.
Seyyed Mehdi Mousavi Badjani
was born in Esfahan, Iran. He received the B.Sc. and M.Sc. in electrical power engineering, and PhD degrees from Iran University of Science and Technology, Tehran, Iran. He is currently an Assistant Professor in the Department of Electrical Engineering at Malek Ashtar University of Technology. His research interests include photovoltaic energy conversion, battery charging systems, power electronics, unified power quality conditioners and FACTS devices.
Ali Nahari
was born in Bushehr, Iran, on Sep 16, 1985. He received the B.Sc. in electrical power engineering in 2008. He is currently pursuing a M.Sc. degree in electrical power engineering. His research interests are distribution system and DG especially in Photovoltaic system, cathodic protection systems.
Seyyed Abdollah Mousavi
received the B.Sc. degree from KN Toosi University of Technology, Tehran, Iran, in 1999, and M.Sc. and Ph.D. degrees from Iran University of Science and Technology, Tehran, Iran, in 2002 and 2011, respectively, all in electrical engineering. He is currently an Assistant Professor in the Department of Electrical Engineering at Mazandaran University of Science and Technology. His research interests include photovoltaic energy conversion, electric motor drives, battery charging systems, and utility applications of power electronics, such as active and hybrid power filters, unified power quality conditioners and DFACTS devices. 0 10 20 30 40 50 60 70 80 90 100
41 42 43 44
Iteration
W
c
0 10 20 30 40 50 60 70 80 90 100 1.0566
1.0567 1.0568 1.0569 1.057
Iteration
W
ip
![Table 2: Typical battery cell characteristics comparison (courtesy of [4])Cell AverageDischarge Voltage (V)](https://thumb-us.123doks.com/thumbv2/123dok_us/8788309.1765151/2.595.52.543.397.468/table-typical-battery-characteristics-comparison-courtesy-averagedischarge-voltage.webp)