Agnieszka Lenarcik, Bożena Bidzińska-Speichert,
Urszula Tworowska-Bardzińska
Metabolic Abnormalities in Siblings of Women
with Polycystic Ovary Syndrome*
Zaburzenia metaboliczne u rodzeństwa kobiet
z zespołem wielotorbielowatych jajników
Department of Endocrinology, Diabetology and Isotope Treatment, Wroclaw Medical University, Poland
Abstract
Background. There is evidence of familial occurrence of metabolic disturbances in first-degree relatives of women with Polycystic Ovary Syndrome (PCOS).
Objectives. The aim of this study was to establish whether siblings of women with PCOS have the metabolic abnor-malities that are typical of PCOS.
Material and Methods. Forty-four sisters and forty-two brothers of women with PCOS were recruited. There were two control groups consisting of 70 healthy women and 30 healthy men. Anthropometric and metabolic parameters (glucose and insulin, fasting and during an oral glucose tolerance test (OGTT 30’, 60’ and 120’), insulin-sensitivity and insulin-resistance indexes, lipidogram) were assessed in all subjects.
Results. In comparison with the controls, siblings of women with PCOS had higher glucose levels, higher insulin levels at 120’ and higher mean insulin levels during the OGTT. There were no differences in the insulin-sensitivity indexes or insulin resistance indexes between siblings and the controls. The total cholesterol and LDL-cholesterol levels were higher in sisters and brothers of women with PCOS than in the controls.
Conclusions. Siblings of patients with PCOS are predisposed to some metabolic abnormalities, such as higher fasting glycemia, glucose intolerance and a more adverse lipid profile than the controls. Insulin resistance in PCOS families is related mainly to obesity and seems not to have a genetic background (Adv Clin Exp Med 2011, 20, 2, 165–175).
Key words: PCOS, siblings, familial occurrence, metabolic disturbances.
Streszczenie
Wprowadzenie. Istnieją dane na temat rodzinnego występowania zaburzeń metabolicznych u krewnych pierwsze-go stopnia kobiet z zespołem wielotorbielowatych jajników (PCOS).
Cel pracy. Ocena rodzeństwa kobiet z PCOS pod kątem występowania zaburzeń metabolicznych.
Materiał i metody. Zbadano 44 siostry i 42 braci pacjentek z PCOS. Grupy kontrolne stanowiło 70 zdrowych kobiet i 30 zdrowych mężczyzn. U wszystkich zrekrutowanych oceniono wskaźniki antropometryczne i metabo-liczne (stężenia glukozy i insuliny na czczo oraz podczas doustnego testu obciążenia glukozą – OGTT – 30’, 60’ i 120’, wskaźniki insulinowrażliwości i insulinooporności oraz pełny lipidogram).
Wyniki. Rodzeństwo kobiet z PCOS w porównaniu z odpowiednimi grupami kontrolnymi miało większe stę-żenia glukozy podczas OGTT oraz stęstę-żenia insuliny w 120’ i średnie stęstę-żenia insuliny podczas OGTT. Nie było różnic dotyczących wartości wskaźników insulinowrażliwości i insulinooporności między rodzeństwem pacjentek z PCOS a odpowiednimi grupami kontrolnymi. Siostry i bracia charakteryzowali się większymi stężeniami chole-sterolu całkowitego i cholechole-sterolu LDL niż osoby z grup kontrolnych.
Wnioski. Rodzeństwo pacjentek z PCOS jest predysponowane do występowania zaburzeń metabolicznych, takich jak: nieprawidłowa tolerancja glukozy, większe stężenia glukozy na czczo oraz bardziej niekorzystny profil lipidowy w porównaniu z rodzeństwem zdrowych kobiet. Insulinooporność w rodzinach pacjentek z PCOS jest związana z otyłością i wydaje się, że nie ma podłoża genetycznego (Adv Clin Exp Med 2011, 20, 2, 165–175).
Słowa kluczowe: PCOS, rodzeństwo, występowanie rodzinne, zaburzenia metaboliczne.
Adv Clin Exp Med 2011, 20, 2, 165–175 ISSN 1230-025X
ORIGINAL PAPERS
© Copyright by Wroclaw Medical University
Polycystic ovary syndrome (PCOS) is among the most commonly diagnosed endocrinopathies in women of reproductive age. The symptoms of PCOS include the consequences of androgen ex-cess, chronic anovulation and infertility. Patients with PCOS are also at increased risk for obesity, insulin resistance, dyslipidemia, metabolic syn-drome, glucose intolerance and diabetes mellitus [1–5]. Familial aggregation of PCOS is well docu-mented and suggests a genetic susceptibility to the disorder. Family studies of PCOS have investigated not only the occurrence of hormonal abnormali-ties, but also metabolic abnormalities among the first-degree relatives of women with PCOS. It has been observed that both female and male relatives may have metabolic disturbances similar to those found in patients with PCOS, such as insulin resis-tance and dyslipidemia [6–12].
The aim of the present study was to determine whether brothers and sisters of patients with PCOS differ from healthy siblings of healthy women in terms of metabolic parameters.
Material and Methods
The study included 44 sisters and 42 broth-ers of women diagnosed with PCOS (according to the Rotterdam criteria) who were patients of the Department of Endocrinology, Diabetology and Isotope Treatment of Wroclaw Medical Univer-sity. The control groups consisted of 70 healthy women and 30 healthy men whose sisters did not have PCOS, menstrual disturbances or hirsutism. The study groups were divided into two subgroups according to body mass index (BMI): those with BMI < 25 kg/m2 and those with BMI ≥ 25 kg/m2.
None of the participants in the study had pre-viously been treated with hormonal or insulin-sensitizing drugs, and they all stated that during the three months prior to the study they had not been on any special diet or practiced intense phys-ical exercise, that they had consumed alcohol only occasionally, and that they had not smoked more than five cigarettes a day. Persons with hypercor-tisolemia, hyperprolactinemia, impaired thyroid function, or suspicion of ovarian or adrenal tumor were excluded from the study.
The study protocol was approved by the Eth-ics Committee of Wroclaw Medical University, and all the subjects gave their informed consent in writing.
A physical examination of all the subjects was carried out, including anthropometrical measure-ments: body mass, body height, and waist and hip circumference. The body mass index was calcu-lated using the equation: body mass [kg]/height-
-squared [m2]. The waist-to-hip ratio (WHR) was
calculated using the equation: waist circumference [cm]/hip circumference [cm].
Blood for laboratory tests was collected be-tween 8:00 and 10:00 AM after overnight fasting, at least eight hours after the last meal. An oral glu-cose tolerance test (OGTT) was performed for all subjects; blood for measuring glucose and insulin was collected after 0, 30, 60 and 120 minutes.
Serum concentrations of glucose, total choles-terol (TC), HDL cholescholes-terol, and triglycerides were measured by routine enzymatic methods (Dade Behring Marburg GmbH, Germany) and LDL- -cholesterol was calculated from Friedewald’s for-mula: LDL-cholesterol [mg/dl] = total cholesterol [mg/dl] – HDL-cholesterol [mg/dl] – (triglycerides [mg/dl]/5). Serum insulin concentrations were de-termined by a chemifluorescent method using an Immulite 2000 analyzer (DPC, Diagnostic Prod-ucts Corporation, Los Angeles, USA).
To estimate insulin sensitivity, insulin-sensi-tivity indexesand insulin-resistance indexes were computed as shown below, where I0 is fasting
in-sulin, G0 is fasting glucose, Imean is the mean insulin
concentration during OGTT and Gmean is the mean
glucose concentration during OGTT):
– HOMA – insulin-resistance index: (I0 (μIU/
/ml) × G0 (mmol/l))/22.5 [13],
– FIRI – insulin-resistance index: (I0 (μIU /ml)
× G0 (mmol/l))/25 [14],
– QUICKI – insulin-sensitivity index: 1/[log I0
(μIU/ml) + log G0 (mg/dl)] [15],
– insulin-sensitivity index of Matsuda and de-Fronzo, the MATSUDA index: 10000/√[(G0 (mg/
/dl) × Gmean (mg/dl)) × (I0 (μIU/ml) × Imean (μIU/
/ml))] [16].
Statistical Analysis
The Shapiro-Wilk test assessing the normal-ity of the data distribution was used to evaluate the assumptions of the parametric tests. To assess the differences between groups, the data were ana-lyzed by means of the Student’s t test. In the ab-sence of a normal distribution, the non-parametric Mann-Whitney U test was used. The variability of the tested features due to the group and body mass index was studied using a two-factorial analysis of variance. A post-hoc comparison between the groups was made with Tukey’s LSD test. The level of statistical significance was set at p < 0.05.
Results
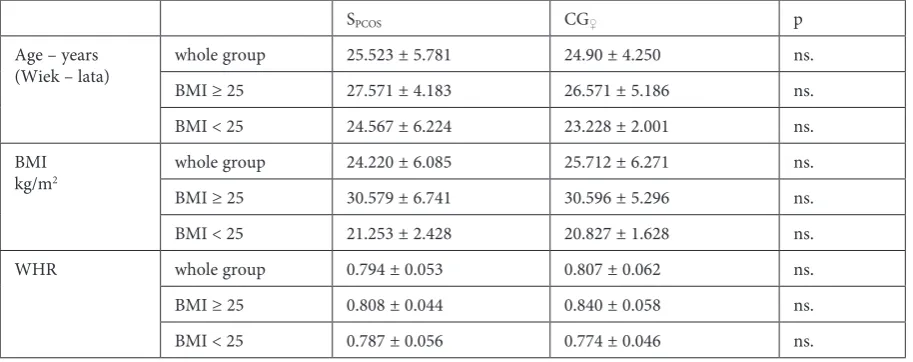
Neither the main groups of women (SPCOS,
the control group. Both the subgroups of sisters of PCOS patients (those with BMI ≥ 25 and those with BMI < 25) showed a significantly higher mean concentration of insulin at 120’ of the OGTT and a higher mean concentration of insulin during the OGTT than the corresponding subgroups of con-trol-group women.
The mean values of the insulin-resistance and insulin-sensitivity indexes in the sisters of patients with PCOS and in the control group of women are shown in Table 4. In the subgroup of sisters with BMI <25, a significantly lower mean value of the differed significantly in terms of average age and
average values of the anthropometric parameters (Tables 1 and 2).
The parameters of carbohydrate metabolism (glucose and insulin during the OGTT) in the sis-ters of patients with PCOS and the women in the control group are summarized in Table 3. A signif-icantly higher mean fasting glucose concentration was noted in the sisters than in the women in the control group. The sisters of patients with PCOS had a significantly higher mean concentration of insulin at 120’ of the OGTT than the women in
Table 1. Comparison of age, BMI and WHR in the sisters of patients with PCOS and the control group of women
Tabela 1. Porównanie wieku oraz wskaźników BMI i WHR u sióstr pacjentek z PCOS oraz kobiet z grupy kontrolnej
SPCOS CG♀ p
Age – years
(Wiek – lata) whole group 25.523 ± 5.781 24.90 ± 4.250 ns. BMI ≥ 25 27.571 ± 4.183 26.571 ± 5.186 ns. BMI < 25 24.567 ± 6.224 23.228 ± 2.001 ns. BMI
kg/m2 whole group 24.220 ± 6.085 25.712 ± 6.271 ns.
BMI ≥ 25 30.579 ± 6.741 30.596 ± 5.296 ns. BMI < 25 21.253 ± 2.428 20.827 ± 1.628 ns. WHR whole group 0.794 ± 0.053 0.807 ± 0.062 ns. BMI ≥ 25 0.808 ± 0.044 0.840 ± 0.058 ns. BMI < 25 0.787 ± 0.056 0.774 ± 0.046 ns. SPCOS – sisters of patients with PCOS.
CG♀ – women of control group.
SPCOS – siostry pacjentek z PCOS.
CG♀ – kobiety w grupie kontrolnej.
Table 2. Comparison of age, BMI and WHR in the brothers of patients with PCOS and the control group of men
Tabela 2. Porównanie wieku oraz wskaźników BMI i WHR u braci pacjentek z PCOS oraz mężczyzn z grupy kontrolnej
BPCOS CG♂ p
Age – years (Wiek – lata)
whole group 23.524 ± 5.052 24.10 ± 1.749 ns. BMI ≥ 25 26.60 ± 4.309 25.10 ± 2.025 ns. BMI < 25 20.727 ± 3.978 23.60 ± 1.392 ns.
BMI kg/m2
whole group 24.443 ± 4.003 24.868 ± 3.767 ns. BMI ≥ 25 27.673 ± 3.086 29.340 ± 2.634 ns. BMI < 25 21.506 ± 1.919 22.631 ± 1.605 0.075
WHR
whole group 0.892 ± 0.069 0.878 ± 0.062 ns. BMI ≥ 25 0.940 ± 0.061 0.933 ± 0.064 ns. BMI < 25 0.853 ± 0.047 0.850 ± 0.039 ns. BPCOS – brothers of patients with PCOS
CG♂ – men of control group.
SPCOS – bracia pacjentek z PCOS.
MATSUDA index than in the corresponding con-trol group was observed.
The parameters of carbohydrate metabo-lism (glucose and insulin during the OGTT) of the brothers of patients with PCOS and the men in the control group are summarized in Table 5. The brothers had significantly higher mean fasting glucose and glucose levels during the OGTT than the men in the control group. The brothers with BMI < 25 had a significantly higher mean fasting glucose concentration and mean concentration of glucose during the OGTT than corresponding subgroup among the control-group men.
The brothers of patients with PCOS had sig-nificantly higher concentrations of insulin during the OGTT than the control-group men. There were no significant differences between these groups in
terms of insulin-resistance and insulin-sensitivity indexes (Table 6).
The average concentrations of total cho-lesterol and LDL-chocho-lesterol were significantly higher among the sisters of PCOS patients than in the control-group women. The differences in lipid parameters between the subgroups of sisters with BMI < 25 and their controls were similar (Table 7).
The average concentrations of total cholester-ol and LDL-chcholester-olestercholester-ol were significantly higher in the group of brothers of patients with PCOS than in the control-group men. The differences between the lipid parameters of the subgroup of brothers with BMI ≥ 25 and the relevant control group were similar to the differences between the main groups’ lipid parameters (Table 8).
Table 3. Comparison of concentrations of glucose and insulin during the OGTT in the sisters of patients with PCOS and the control group of women
Tabela 3. Porównanie stężeń glukozy i insuliny podczas OGTT u sióstr pacjentek z PCOS oraz kobiet z grupy kontrolnej
SPCOS CG♀ p
Glucose 0’ (Glukoza 0’) mg/dl
whole group 87.227 ± 7.139 81.686 ± 8.321 < 0.001 BMI ≥ 25 92.0 ± 7.716* 85.343 ± 7.507 0.01616 BMI < 25 85.0 ± 5.723* 78.028 ± 7.524 < 0.001
Glucose 120’ (Glukoza 120’) mg/dl
whole group 87.232 ± 26.047 83.071 ± 19.501 ns. BMI ≥ 25 102.0 ± 20.408* 87.514 ± 21.270 0.02473 BMI < 25 80.833 ± 25.887* 78.628 ± 16.695 ns.
Glucose mean (Glukoza średnia) mg/dl
whole group 101.669 ± 18.100 96.243 ± 15.280 0.09061 BMI ≥ 25 108.596 ± 15.311 101.914 ± 15.354 ns. BMI < 25 98.667 ± 18.618 90.571 ± 13.112 0.03401
Insulin 0’ (Insulina 0’)
µIU/ml
whole group 7.793 ± 5.375 8.964 ± 7.335 ns. BMI ≥ 25 12.092 ± 7.050* 11.559 ± 8.599 ns. BMI < 25 5.930 ± 3.066* 6.443 ± 4.748 ns.
Insulin 120’ (Insulina 120’)
µIU/ml
whole group 37.579 ± 23.815 27.662 ± 36.667 < 0.001 BMI ≥ 25 53.938 ± 30.917* 36.850 ± 48.931 0.00131 BMI < 25 30.490 ± 15.935* 18.737 ± 14.097 0.00115
Insulin mean (Insulin średnia)
µIU/ml
Discussion
Metabolic disorders, such as impaired fasting glycemia, glucose intolerance, insulin resistance and atherogenic dyslipidemia, are common in pa-tients with PCOS. Around 7.5% of obese women with PCOS have type 2 diabetes [2]. Recent reports indicate familial occurrence of these metabolic dis-orders, especially in first-degree relatives of women with PCOS [8, 10–12, 17].
The present study shows that sisters of patients with PCOS, regardless of BMI, had higher glucose concentrations than the women in the control group. Significant differences were found in fast-ing glucose concentrations. In three sisters (6.8%) impaired fasting glycemia was noted, and glucose intolerance in two others (4.5%). In the control group, only one woman (1.3%) had glucose intol-erance. Overall, 11.4% of the sisters showed predi-abetic status (impaired fasting glycemia or glucose intolerance), but none of the sisters were diagnosed with type 2 diabetes. Similar results were obtained by Yildiz et al., who observed impaired glucose tolerance in 5% of sisters of PCOS patients; how-ever, no abnormal fasting glycemia was noted in these relatives [8]. The results of the current study are in accordance with a recently published report
in which higher fasting glucose levels were noted among first-degree female relatives of patients with PCOS than in a control group of women. In addi-tion, impaired glucose tolerance was diagnosed in 5.7% of these relatives [18].
In the current study, a trend towards in-creased insulin concentrations during the OGTT was noted among the sisters of patients with PCOS as compared with the control-group women. The exception was the fasting insulin concentration, which was slightly lower in the sisters than in the controls. The concentration of insulin during the OGTT, especially at 120 minutes, and the mean concentration of insulin during the OGTT, were higher in the sisters of PCOS patients than in the control-group women, regardless of BMI. The sis-ters were characterized by lower insulin-sensitivity index values than the respective control groups, but this difference was statistically significant only for the MATSUDA index in the subgroups with BMI < 25. Only fasting concentrations of glucose and insulin are used for the calculation of HOMA, FIRI, and QUICKI. In this study the sisters of PCOS patients did not show increased fasting in-sulin concentrations compared with the controls, but had a higher mean concentration of insulin. This may explain why no major differences were
Table 4. Comparison of values of insulin-resistance and insulin-sensitivity indexes in the sisters of PCOS patients and the control group of women
Tabela 4. Porównanie wartości wskaźników insulinooporności i insulinowrażliwości u sióstr pacjentek z PCOS oraz kobiet z grupy kontrolnej
SPCOS CG♀ p
HOMA
whole group 1.709 ± 1.270 1.856 ± 1.713 ns. BMI ≥ 25 2.755 ± 1.679* 2.488 ± 2.085 ns. BMI < 25 1.255 ± 0.682* 1.242 ± 0.929 ns.
FIRI
whole group 1.538 ± 1.143 1.670 ± 1.542 ns. BMI ≥ 25 2.480 ± 1.511* 2.239 ± 1.876 ns. BMI < 25 1.130 ± 0.613* 1.118 ± 0.836 ns.
QUICKI
whole group 0.367 ± 0.035 0.370 ± 0.047 ns. BMI ≥ 25 0.339 ± 0.032* 0.352 ± 0.043 ns. BMI < 25 0.379 ± 0.029* 0.389 ± 0.043 ns.
MATSUDA
observed between the insulin-resistance indexes of the sisters of PCOS patients and those of the controls. It also shows why the MATSUDA index seems to be a better measure of insulin sensitivity. Fasting concentrations of glucose and insulin and their average concentrations from the OGTT are used to calculate the MATSUDA index. It is cur-rently believed that the MATSUDA index corre-lates best with the values of the insulin-resistance indexes obtained using the euglycemic clamp technique [16].
The observations of many researchers show unambiguously that sisters of PCOS patients have elevated levels of insulin and insulin-resistance indexes [8, 11, 17–20]. Yildiz et al. demonstrated that sisters with BMI < 25 and with normal glu-cose tolerance had higher fasting insulin levels, increased areas under the curve for insulin
con-centration during the OGTT and higher HOMA indexes than an age- and BMI-matched control group of women [8]. Thus they demonstrated that, as in lean patients with PCOS, insulin resistance also occurs in their lean sisters. This suggests that there is a genetic predisposition for the develop-ment of insulin resistance in the families of PCOS women and that it is independent of obesity. The results of the present study show that overweight or obese sisters had significantly higher concen-trations of fasting insulin and insulin during the OGTT, higher insulin-resistance index values and lower insulin-sensitivity index rates than lean sis-ters, which suggests that obesity plays a significant role in the development of insulin resistance in sis-ters of patients with PCOS. Legro et al. described insulin resistance in sisters of women with PCOS who also had PCOS or hyperandrogenemia [11].
Table 5. Comparison of concentrations of glucose and insulin during the OGTT in the brothers of patients with PCOS and the control group of men
Tabela 5. Porównanie stężeń glukozy i insuliny podczas OGTT u braci pacjentek z PCOS oraz mężczyzn z grupy kontrolnej
BPCOS CG♂ p
Glucose 0’ (Glukoza 0’) mg/dl
whole group 89.333 ± 6.083 85.933 ± 6.373 0.01540 BMI ≥ 25 90.0 ± 5.534 87.20 ± 7.899 ns. BMI < 25 88.727 ± 6.613 85.30 ± 5.583 0.04967
Glucose 120’ (Glukoza 120’) mg/dl
whole group 84.976 ± 19.697 71.60 ± 22.841 0.00975 BMI ≥ 25 84.250 ± 24.659 74.90 ± 28.614 ns. BMI < 25 85.636 ± 14.364 69.950 ± 19.996 0.00181
Glucose mean (Glukoza średnia) mg/dl
whole group 110.095 ± 15.440 95.575 ± 15.777 < 0.001 BMI ≥ 25 113.275 ± 15.956 102.350 ± 21.270 0.05680 BMI < 25 107.204 ± 14.721 92.187 ± 11.376 0.00120
Insulin 0’ (Insulina 0’)
µIU/ml
whole group 7.393 ± 4.541 8.987 ± 4.883 ns. BMI ≥ 25 8.915 ± 5.288* 10.560 ± 4.498 ns. BMI < 25 6.001 ± 3.277* 8.20 ± 4.986 0.08357
Insulin 120’ (Insulina 120’)
µIU/ml
whole group 25.812 ± 16.322 15.213 ± 12.418 0.00385 BMI ≥ 25 26.455 ± 20.766 11.780 ± 6.610 0.03680 BMI < 25 25.227 ± 11.367 16.930 ± 14.330 0.01056
Insulin mean (Insulina średnia)
µIU/ml
Table 6. Comparison of values of insulin-resistance and insulin-sensitivity indexes in the brothers of PCOS patients and the control group of men
Tabela 6. Porównanie wartości wskaźników insulinooporności i insulinowrażliwości u braci pacjentek z PCOS oraz mężczyzn z grupy kontrolnej
BPCOS CG♂ p
HOMA
whole group 1.627 ± 0.990 1.921 ± 1.102 ns. BMI ≥ 25 1.966 ± 1.145* 2.324 ± 1.131 ns. BMI < 25 1.320 ± 0.720* 1.720 ± 1.058 ns.
FIRI
whole group 1.465 ± 0.891 1.729 ± 0.992 ns. BMI ≥ 25 1.769 ± 1.030 2.091 ± 1.018 ns. BMI < 25 1.879 ± 0.648 1.548 ± 0.953 ns.
QUICKI
whole group 0.368 ± 0.036 0.357 ± 0.033 ns. BMI ≥ 25 0.357 ± 0.037 0.344 ± 0.027 ns. BMI < 25 0.377 ± 0.033 0.364 ± 0.0347 ns.
MATSUDA
whole group 8.173 ± 4.928 9.356 ± 4.759 ns. BMI ≥ 25 6.983 ± 3.980 7.026 ± 2.334 ns. BMI < 25 9.255 ± 5.524 10.521 ± 5.263 ns. * Statistically significant difference between the subgroups of brothers of PCOS patients with BMI ≥ 25 and BMI < 25. * Statystycznie istotna różnica między podgrupą braci pacjentek z PCOS i BMI ≥ 25 a BMI < 25.
Table 7. Comparison of lipid parameters in the sisters of patients with PCOS and the control group of women
Tabela 7. Porównanie wskaźników lipidogramu u sióstr pacjentek z PCOS oraz kobiet z grupy kontrolnej
SPCOS CG♀ p
TC mg/dl
whole group 189.454 ± 34.396 177.043 ± 34.371 0.01898 BMI ≥ 25 196.143 ± 25.407 184.143 ± 38.462 0.08377 BMI < 25 186.333 ± 37.857 169.943 ± 28.537 0.04298
LDL-C mg/dl
whole group 107.535 ± 30.416 95.811 ± 29.744 0.03985 BMI ≥ 25 116.143 ± 19.887 104.559 ± 33.288 ns. BMI < 25 103.379 ± 33.899 87.314 ± 23.304 0.04472
HDL-C mg/dl
whole group 67.302 ± 16.650 63.271 ± 16.181 ns. BMI ≥ 25 60.357 ± 14.254 57.486 ± 16.218 ns. BMI < 25 70.655 ± 16.904 69.057 ± 14.121 ns.
TG mg/dl
Those authors suggested a relationship between hyperandrogenemia, impaired carbohydrate me-tabolism and insulin resistance in families of PCOS women, and inheritance of these anomalies in first-degree relatives of these women.
In addition to disorders of carbohydrate me-tabolism, lipid disorders have also been observed in sisters of PCOS patients. However, not all au-thors agree on this. Raskauskiene et al. [21] and Yilmaz et al. [17] found no differences between the lipid parameters of sisters of PCOS patients and those of control groups. In contrast, Sam et al. found significantly higher concentrations of total cholesterol, LDL-cholesterol and triglycerides in patients with PCOS sisters [12]. The concentra-tion of LDL-cholesterol was significantly higher in the sisters with hyperandrogenemia than in the sisters without increased levels of androgens, and the concentrations of triglycerides were higher in sisters with PCOS than in other sisters. Sam concluded that, in both women with PCOS and their sisters, an increased concentration of LDL- -cholesterol is associated with hyperandrogen-emia, and hypertriglyceridemia is associated with insulin resistance. In the present study, as in that of Sam et al., higher concentrations of total cho-lesterol and LDL-chocho-lesterol were observed in the sisters of PCOS patients than in the control-group
women. These concentrations were higher in both subgroups of sisters, regardless of BMI. No dif-ferences in these parameters were seen between the lean sisters and the overweight or obese ones, while triglyceride concentrations were signifi-cantly higher in the group of sisters with BMI ≥ 25 than in the lean ones. Thus it appears that insulin resistance associated with obesity is a factor influ-encing triglyceride levels. Like some of the previ-ously mentioned authors [17, 19], we did not find differences between the concentrations of HDL- -cholesterol and triglycerides in the sisters of PCOS patients and in the control-group women.
In the current study, the brothers of patients with PCOS showed essentially similar metabolic disturbances as the sisters. Compared with the men in the control group, they were characterized by higher fasting glucose concentrations during the OGTT. No differences were noted in the con-centrations of glucose between the lean brothers and the overweight or obese brothers. This may indicate that obesity is not a key factor influenc-ing the concentration of glucose in brothers of pa-tients with PCOS, but it may have a family back-ground. Impaired fasting glycemia was identified in two of the brothers (4.8%), and one of them (2.4%) showed impaired glucose tolerance. In the control group, only one man had impaired
fast-Table 8. Comparison of mean values of lipid parameters in the brothers of patients with PCOS and the control group
Tabela 8. Porównanie wskaźników lipidogramu u braci pacjentek z PCOS oraz mężczyzn z grupy kontrolnej
BPCOS CG♂ p
TC mg/dl
whole group 184.309 ± 40.220 161.167 ± 32.711 0.01050 BMI ≥ 25 209.50 ± 37.099* 168.20 ± 37.297 0.00478 BMI < 25 161.409 ± 27.554* 157.650 ± 30.581 ns.
LDL-C mg/dl
whole group 105.683 ± 39.882 88.533 ± 26.470 0.04451 BMI ≥ 25 127.158 ± 44.344* 91.40 ± 31.081 0.01881 BMI < 25 87.136 ± 23.803* 87.10 ± 24.604 ns.
HDL-C mg/dl
whole group 59.951 ± 14.807 57.733 ± 14.839 ns. BMI ≥ 25 58.947 ± 16.403 50.10 ± 10.650 ns. BMI < 25 60.818 ± 13.612 61.550 ± 15.374 ns.
TG mg/dl
whole group 91.714 ± 44.322 91.0 ± 59.808 ns. BMI ≥ 25 118.650 ± 39.125* 133.10 ± 83.842 ns. BMI < 25 67.227 ± 33.632* 70.10 ± 27.154 ns.
ing glycemia (3.3%). These results are consistent with those of other authors. Yildiz et al. observed impaired fasting glycemia in 4% of the brothers of patients with PCOS [8]. Baillargeon et al. found glucose intolerance in 17.6% of the brothers of pa-tients with PCOS – a much larger proportion than in this study [22]. Baillargeon et al. demonstrated that, compared with men matched in terms of age, BMI, waist circumference and body fat content, the brothers of patients with PCOS had significantly higher glucose concentrations at 120 minutes of the OGTT and increased areas under the curve, as well as higher fasting glucose concentrations. The concentration of glucose at 120 minutes of the OGTT as a screening test is more important than the information gained from the concentration of fasting glucose, because high basal concentrations of insulin are sufficient to keep glucose within the normal range when fasting, but are often insuffi-cient for the satisfactory adjustment of the carbo-hydrate level after a glucose load [23, 24].
The brothers of PCOS patients, like the sisters, were characterized by higher concentrations of in-sulin in the OGTT than the control-group men. The exception was fasting insulin concentration, which was slightly lower in the group of brothers. Overweight and obesity had a significant effect on the insulin level. The fasting insulin concentration was significantly lower in the lean brothers than in the overweight or obese brothers. The obese or overweight brothers had lower levels of SHBG than the lean brothers (data not shown), and it is known that the concentration of SHBG depends on obesity status as well as the degree of insulin resistance [25]. Neither of the analyzed groups of brothers differed from the corresponding control groups of men in terms of insulin resistance or insulin sensitivity. This can be partly explained, as with the sisters, by the fact that the brothers did not differ from the control group in the concentration of fasting insulin, and even had slightly lower fasting insulin levels. We did not observe statistically significant differences in the MATSUDA index, although the brothers were characterized by slightly lower val-ues. The overweight or obese brothers had higher values in the HOMA insulin-resistance index and lower insulin-sensitivity index values than the lean brothers, which once again points to the dominant role of obesity as an influence on insulin resistance among relatives of patients with PCOS.
Many authors have reported the presence of insulin resistance in brothers of patients with PCOS [17, 22, 26, 27]. Most of them used HOMA as an insulin resistance indicator. Assuming – in accordance with the criteria used by other authors [28, 29] – that a HOMA value > 2.5 indicates in-sulin resistance, in the current study inin-sulin
resis-tance was found in 19% of the brothers of PCOS patients. However, this percentage is comparable to the percentage of insulin resistance among the control-group men (20%). In both groups, insulin resistance was found mostly in men with BMI ≥ 25. Similar results were obtained by Yildiz et al. [8]. They did not observe differences in the parameters of insulin resistance between brothers of patients with PCOS and their control-group men, but they found that the former were characterized by a much higher value of the area under the curve for insulin during the OGTT. Yilmaz et al. [17] and Sam et al. [27], contrary to our results, dem-onstrated higher fasting insulin concentrations in male relatives of women with PCOS. Baillargeon et al., using the euglycemic clamp, found decreased insulin sensitivity in 38% of brothers of patients with PCOS [22].
In the present study, higher concentrations of insulin were observed during the OGTT among the siblings of women with PCOS. But contrary to results of other authors, fasting insulin levels were lower in those relatives. As shown by Colilla et al., women with PCOS and their relatives are predis-posed to β-cell dysfunction and abnormal insu-lin secretion and action [30]. The degree of this dysfunction could reflect the severity of primary disorders of the basal and postprandial secretion of insulin in relatives of patients with PCOS. It is likely that genetic β-cell dysfunction results in relatively lower basal secretion of insulin, and so differences were not found between the fasting in-sulin levels of siblings of PCOS patients and the control groups.
Fasting hyperinsulinemia is present mainly in obese, not lean, PCOS women. Higher insulin lev-els after aglucose load are observed in lean as well as obese patients with PCOS [1]. It seems that pri-mary genetic defect in PCOS families is related to insulin response to an oral glucose load, while the fasting insulin level depends mainly on obesity and environmental factors. Genetically determined ab-normal β-cell function in women with PCOS and their relatives is a component of glucose intoler-ance, and is a risk factor for developing diabetes mellitus, independent of insulin resistance [30, 31]. So siblings of women with PCOS, although they do not show insulin resistance, but have metabolic disturbances related with β-cell dysfunction, such as abnormal glucose tolerance and higher insulin levels in the OGTT, are at risk for diabetes mel-litus type 2.
differences concerning total cholesterol and LDL- -cholesterol between the whole group of brothers and the whole male control group, and also between the subgroup of overweight or obese brothers and the respective control subgroup. Other authors also described adverse lipid profiles in brothers of PCOS patients compared with control-group men. In contrast to the results of the present study, they observed not only higher concentrations of total and LDL-cholesterol, but also of triglycerides in male relatives of patients with PCOS [17, 20, 22, 27]. There were no differences in HDL-cholesterol level between brothers and controls, either in the current study or in those mentioned above [17, 22].
In the current study, in contrast to the findings of most authors, siblings of women with PCOS did not demonstrate all the metabolic disturbances that are typical of PCOS. Higher glucose levels, glucose intolerance, higher insulin levels after glucose load and higher total and LDL-cholesterol levels were observed in siblings of PCOS patients. However, they did not reveal the disorders most typical of PCOS: insulin resistance and atherogenic dyslipi-demia. This probably results from the fact that in PCOS these abnormalities do not have a genetic background. Insulin resistance and an atherogenic lipid profile are strongly related to obesity, among
the siblings of women with PCOS and the controls as well.
Undoubtedly, siblings of women with PCOS are at greater risk for contracting type 2 diabetes and cardiovascular diseases than healthy coun-terparts in the general population, but this risk is not as large as for PCOS patients themselves. For these reasons the entire families of patients with PCOS should be included in the primary and sec-ondary prevention of cardiovascular diseases and diabetes.
The authors concluded that siblings of patients with PCOS are predisposed to the occurrence of metabolic abnormalities partially similar to those observed in PCOS, expressed through impaired fasting glycemia, glucose intolerance and a more adverse lipid profile; however, they do not display the atherogenic dyslipidemia typical of PCOS. It seems that insulin resistance and atherogenic dys-lipidemia in PCOS are related mainly to obesity and do not have a genetic background. To sum up, siblings of PCOS patients showing metabolic dis-turbances are a group at increased risk of cardio-vascular and metabolic diseases, including type 2 diabetes, but this risk seems lower than in women with PCOS.
References
[1] Dunaif A: Insulin Resistance and the Polycystic Ovary Syndrome: Mechanism and Implications for Pathogenesis. Endocr Rev 1997, 18, 774–800.
[2] Carmina E, Lobo RA: Polycystic Ovary Syndrome (PCOS): Arguably the Most Common Endocrinopathy is Associated with Significant Morbidity in Women. J Clin Endocrinol Metab 1999, 84, 1897–1899.
[3] American Association of Clinical Endocrinologists Position Statement on Metabolic and Cardiovascular Consequences of Polycystic Ovary Syndrome. American Association of Clinical Endocrinologists Polycystic Ovary Syndrome Writing Commiitee. Endocr Pract 2005, 11, 126–134.
[4] Dokras A, Bochner M, Hollinrake E, Markham S, Vanvoorhis B, Jagasia DH: Screening women with polycystic ovary syndrome for metabolic syndrome. Obstet Gynecol 2005, 106, 131–137.
[5] Ehrmann DA, Liljenquist DR, Kasza K, Azziz R, Legro RS, Ghazzi MN: PCOS/Troglitazone Study Group. Prevalence and predictors of the metabolic syndrome in women with polycystic ovary syndrome. J Clin Endocrinol Metab 2006, 91, 48–53.
[6] Kahsar-Miller MD, Nixon C, Boots LR, Go RC, Azziz R: Prevalence of polycystic ovary syndrome (PCOS) in first-degree relatives of patients with PCOS. Fertil Steril 2001, 75, 53–58.
[7] Legro RS, Driscoll D, Strauss JF 3rd, Fox J, Dunaif A: Evidence for a genetic basis for hyperandrogenemia in polycystic ovary syndrome. Proc Nat Acad Sci USA 1998, 95, 14956–14960.
[8] Yildiz BO, Yarali H, Oguz H, Bayraktar M: Glucose intolerance, insulin resistance, and hyperandrogenemia in first degree relatives of women with polycystic ovary syndrome. J Clin Endocrinol Metab 2003, 88, 2031–2036.
[9] Legro RS, Kunselman AR, Demers L, Wang SC, Bentley-Lewis R, Dunaif A: Elevated dehydroepiandrosterone sulfate levels as the reproductive phenotype in the brothers of women with polycystic ovary syndrome. J Clin Endocrinol Metab 2002, 87, 2134–2138.
[10] Kaushal R, Parchure N, Bano G, Kaski JC, Nussey SS: Insulin resistance and endothelial dysfunction in the broth-ers of Indian subcontinent Asian women with polycystic ovaries. Clin Endocrinol (Oxf) 2004, 60, 322–328.
[11] Legro RS, Bentley-Lewis R, Driscoll A, Wang S, Dunaif A: Insulin resistance in the sisters of women with poly-cystic ovary syndrome: association with hyperandrogenemia rather than menstrual irregularity. J Clin Endocrinol Metab 2002, 87, 2128–2133.
[12] Sam S, Legro RS, Bentley-Lewis R, Dunaif A: Dyslipidemia and metabolic syndrome in the sisters of women with polycystic ovary syndrome. J Clin Endocrinol Metab 2005, 90, 4797–4802.
[14] Ducan MH, Singh BM, Wise PH: A simple measure of insulin resistance. Lancet 1995, 346, 12–121.
[15] Katz A, Nambi SS, Mather K: Quantitative insulin sensitivity check index: a simple, accurate method for assessing insulin sensitivity in humans. J Clin Endocrinol Metab 2000, 85, 2402–2410.
[16] Matsuda M, DeFronzo RA: Insulin sensitivity indices obtained from oral glucose tolerance testing: comparison with the euglycemic insulin clamp. Diabetes Care 1999, 22, 1462–1470.
[17] Yilmaz M, Bukan N, Ersoy R, Karakoc A, Yetkin I, Ayvaz G, Cakir N, Arslan M: Glucose intolerance, insulin resistance and cardiovascular risk factors in first degree relatives of women with polycystic ovary syndrome. Hum Reprod 2005, 20, 2414–2420.
[18] Unlühizarci K, Ozocak M, Tanriverdi F, Atmaca H, Kelestimur F: Investigation of hypothalamo-pituitary-go-nadal axis and glucose intolerance among the first-degree female relatives of women with polycystic ovary syn-drome. Fertil Steril 2007, 87, 1377–1382.
[19] Diamanti-Kandarakis E, Alexandraki K, Bergiele A, Kandarakis H, Mastorakos G, Aessopos A: Presence of metabolic risk factors in non-obese PCOS sisters: evidence of heritability of insulin resistance. J Endocrinol Invest 2004, 27, 931–936.
[20] Norman RJ, Masters S, Hague W: Hyperinsulinemia is common in family members of women with polycystic ovary syndrome. Fertil Steril 1996, 66, 942–947.
[21] Raskauskiene D, Jones PW, Govind A, Obhrai M, Clayton RN: Do polycystic ovaries on ultrasound scan indicate decreased insulin sensitivity in sisters of women with polycystic ovary syndrome? J Clin Endocrinol Metab 2005, 90, 2063–2067.
[22] BaillargeonJ, Carpentier AC: Brothers of women with polycystic ovary syndrome are characterised by impaired glucose tolerance, reduced insulin sensitivity and related metabolic defects. Diabetologia 2007, 50, 2424–2432.
[23] Bidzińska B: Związek hiperandrogenizmu z otyłością, insulinoopornością, peptydami regulującymi apetyt i wyda-tek energetyczny oraz polimorfizmem genu receptora aktywowanego proliferatorami peroksysomów gamma 2 (PPARγ2). Rozprawa na stopień doktora habilitowanego. Akademia Medyczna, Wrocław 2004.
[24] Palmert MR, Gordon CM, Kartoshov AI, Legro RS, Emans SJ, Dunaif A: Screening for abnormal glucose tole-rance in adolescents with polycystic ovary syndrome. J Clin Endocrinol Metab 2002, 87, 1017–1023.
[25] Plymate SR, Matej LA, Jones RE, Friedl KE: Inhibition of sex hormone-binding globulin production in the human hepatoma (Hep G2) cell line by insulin and prolactin. J Clin Endocrinol Metab 1988, 67, 460–464.
[26] Kurzrock R, Cohen PR: Polycystic ovary syndrome in men: Stein-Leventhal syndrome revisited. Med Hypotheses 2007, 68, 480–483.
[27] Sam S, Coviello AD, Sung YA, Legro RS, Dunaif A: Metabolic phenotype in the brothers of women with poly-cystic ovary syndrome. Diabetes Care 2008, 31, 1237–1241.
[28] De Oliveira EP, De Lima MD, De Souza ML: Metabolic syndrome, its phenotypes, and insulin resistance by HOMA-IR. Arq Bras Endocrinol Metabol 2007, 51, 1506–1515.
[29] Meigs JB: The metabolic syndrome. BMJ 2003, 327, 61–62.
[30] Colilla S, Cox NJ, Ehrmann DA: Heritability of insulin secretion and insulin action in women with polycystic ovary syndrome and their first degree relatives. J Clin Endocrinol Metab 2001, 86, 2027–2031.
[31] Bloomgarden ZT: Second World Congress on the Insulin resistance Syndrome. Mediators, pediatric insulin resis-tance, the polycystic ovary syndrome, and malignancy. Diabetes Care 2005, 28, 1821–1830.
Address for correspondence:
Agnieszka LenarcikDepartment of Endocrinology, Diabetology, and Isotope Treatment Wroclaw Medical University
Wybrzeże L. Pasteura 4 50-367 Wroclaw, Poland Tel.: +48 71 784 25 52 E-mail: [email protected]
Conflict of interest: None declared