Volume 01, No. 10, October 2015
P
age
77
Optimization and Prediction of Mechanical Properties of
ZA-27/Al
2O
3MMC Processed By Centrifugal Casting Using Multiple
Regression Analysis
Jyothi P N*, M.C.Jagath
**& K.Channakeshavalu
****Department of Mechanical Engineering, K.S.School of Engineering and Management, Bangalore, India
**
Department of Industrial Engineering and Management, Bangalore Institute of Technology, Bangalore India
***Department of Mechanical Engineering, East west Institute of Technology, Bangalore, India
ABSTRACT:
In the present investigation ZA-27/Al2O3 MMC are processed by Centrifugal casting. The
Hardness and Ductilityproperty of the MMC wasstudied using Brinell hardness tester and Universal testing Machine. Experiments were done based on the Design of Experiments generated through Taguchi’s technique. A L25 Orthogonal array was chosen for analysis of data. Study was done to find the influence of melt temperature, rotational speed of the mold, Wt. % of particulate, the size of the particulate and distance from the center of the ingot on hardness and Ductility. Analysis was done by ANOVA and Regression Equation for each response were developed for ZA-27/Al2O3 MMC. The parameter“larger the better” was used
to analyze the mechanical properties. Results show that melt temperate and Wt. % of particulate have highest significant effect followed by rotational speed,particulate size and distance from the center. Final experimental values were compared with predicted values.
Key words: ZA-27; Al2O3; Centrifugal casting; Taguchi’s technique; Analysis of Variance;
Multiple Regression analysis.
1. INTRODUCTION
From past many years Zinc based alloys are widely used for diecasting commercial components.By varying the aluminium percentage ( Typical8,12&27 %) excellent bearing properties can be achieved.These alloys have good castability, high fluidity, and excellent Mechanical properties.In addition,they also possess good physical and technological properties with lower manufacturing cost [1]. These alloys are manufactured using sand, permanent mold, shell mold and high-pressure die casting methods. They can be castinthin sections and does not require any flux. [2]. The properties tend to deteriorate at temperature above 1000C [3, 4]. This disadvantage can be overcome by reinforcing these alloys with hard ceramic particles.These reinforcement contributes to a higher hardness, superior elastic modulus and lower coefficient of thermal expansion of the matrix alloy at high temperature [5]. Among high aluminum content Zinc based alloys, ZA-27 alloys have excellent fluidity, low density, high mechanical properties excellent bearing and wear resistance properties. In the present work, ZA-27 alloy was reinforced with Al2O3 particulate. Mechanical properties
like hardness and ductility were studied for different Melt temperature (oC), Rotational speed (rpm), Wt.% of Al2O3 ,Size of the particulate (µm), and Distance from the center (mm).
Volume 01, No. 10, October 2015
P
age
78
DESIGN OF EXPERIMENTS
To study the effect of multiple variables Design of Experiment is one of the powerful statistical techniques, which involve a series of experiments to yield an improved performance of process parameters. [6]. Design of Experiments requires a set of factors and levels be tested in order to observe the results of those test conditions. Taguchi approach is one of the techniques which rely on the assignment of factors in a specific orthogonal array to know the testing combinations. This processhas three main phases, i.e.the planning phase, the conducting phase, and the Analysis phase. The important step in the DOE is the determination of the combination of factors and levels which willprovide the desired output [7]. The experimental result from the analysis uses a signal to noise ratio in order to determine the best process designs. To investigate hardness and ductility this technique has been successfully used. In the present work, DOE was generated by the Taguchi method using orthogonal arrays for improving the design of the manufacturing process. This method yields optimized parameters with the level of significance of the influence of factors on a particular output response.
2. EXPERIMENTAL DETAILS
In the present work, ZA-27 alloy with the chemical composition as per ASTM B669-82 ingot specification, are used as the basic matrix alloy and Al2O3 as reinforcement with different
size. The alloy was melted usingelectric resistance furnace and 200 °C super heat is maintained as teeming temperature for all the cast tubes. A horizontal centrifugal casting machine used to cast ZA-27 alloyspecimen. The mold was preheated to 500 °C and pouring temperature of the ZA-27/Al2O3 composite slurry and the rotation speed of the moldsare given in Table 1. The dimension of the cylinder is 100 mm outer diameter and 150 mm length. Samples were sectioned from the cylinder along the radial direction in different distance from the center given in Table 1. All tests were conducted in as per ASTM standards. Ductility tests were conducted at room temperature using Universal Testing Machine (UTM). The tensile specimens of diameter 8.9mm and gauge length 76mm were machined from the cast composites. The hardness tests were conducted in accordance with ASTM E10 standard using standard Brinell hardness testing machine with a ball indentor of diameter 2.5mm and load of 31.25 kg. The load was applied for 30 seconds.
Table.1 Control factors and their levels used in the experiment
Level
Melt
temperature(oC)
(a)
Rotational speed (RPM)
(b)
Wt. % of
Al2O3
(C)
Size of the particulate (µm)
(d)
Distance from the center (mm)
(e)
1 450 400 5 20 0
2 500 500 10 40 10
3 550 600 15 60 20
4 600 700 20 80 30
Volume 01, No. 10, October 2015
P
age
79
3. RESULTS AND DISCUSSIONS
I. Statistical Analysis of Experiments:
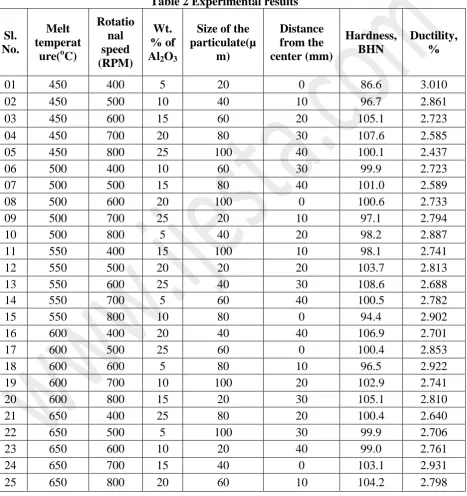
As per the orthogonal array the experiments were conducted based upon the various combinations of parameters. The measured results were analyzed using the user friendly software, i.e. MINITAB 14 specifically used for DOE. Table 2 shows the experimental results for hardness and ductility.
Table 2 Experimental results
Sl. No.
Melt temperat
ure(oC)
Rotatio nal speed (RPM)
Wt. % of
Al2O3
Size of the particulate(µ
m)
Distance from the center (mm)
Hardness, BHN
Ductility, %
01 450 400 5 20 0 86.6 3.010
02 450 500 10 40 10 96.7 2.861
03 450 600 15 60 20 105.1 2.723
04 450 700 20 80 30 107.6 2.585
05 450 800 25 100 40 100.1 2.437
06 500 400 10 60 30 99.9 2.723
07 500 500 15 80 40 101.0 2.589
08 500 600 20 100 0 100.6 2.733
09 500 700 25 20 10 97.1 2.794
10 500 800 5 40 20 98.2 2.887
11 550 400 15 100 10 98.1 2.741
12 550 500 20 20 20 103.7 2.813
13 550 600 25 40 30 108.6 2.688
14 550 700 5 60 40 100.5 2.782
15 550 800 10 80 0 94.4 2.902
16 600 400 20 40 40 106.9 2.701
17 600 500 25 60 0 100.4 2.853
18 600 600 5 80 10 96.5 2.922
19 600 700 10 100 20 102.9 2.741
20 600 800 15 20 30 105.1 2.810
21 650 400 25 80 20 100.4 2.640
22 650 500 5 100 30 99.9 2.706
23 650 600 10 20 40 99.0 2.761
24 650 700 15 40 0 103.1 2.931
Volume 01, No. 10, October 2015
P
age
80
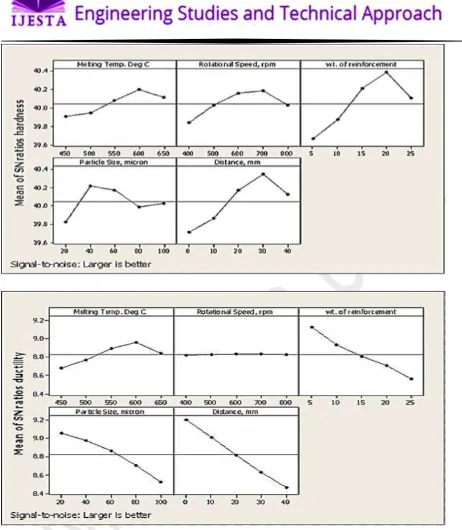
Figure 1 shows the influence of process parameters on hardness and ductility graphically.
The analysis of these experimental results using S/N ratio gives the optimum conditions resulting in maximum hardness and minimum ductility. Table 3 shows the optimum level parameters for hardness and ductility.
Table 3 optimum level process parameters for Hardness and Ductility.
Mechanical properties
Melt temperature(oC)
Rotational speed
(RPM) Wt.% of Al2O3
Size of the particulate(µm)
Distance from the center (mm)
Volume 01, No. 10, October 2015
P
age
81
Ductility 600 - 5 20 0
II. ANOVA RESULTS
The analysis of variance is used to analyze the experimental results and to investigate the influence of the control parameter that significantly affects the performance measures. By the analysis of variance it can be decided that which independent factor dominates over the other independent variable with their particular contribution.
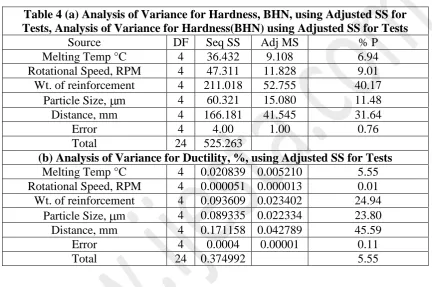
Table 4 (a) Analysis of Variance for Hardness, BHN, using Adjusted SS for Tests, Analysis of Variance for Hardness(BHN) using Adjusted SS for Tests
Source DF Seq SS Adj MS % P
Melting Temp °C 4 36.432 9.108 6.94
Rotational Speed, RPM 4 47.311 11.828 9.01
Wt. of reinforcement 4 211.018 52.755 40.17
Particle Size, m 4 60.321 15.080 11.48
Distance, mm 4 166.181 41.545 31.64
Error 4 4.00 1.00 0.76
Total 24 525.263
(b) Analysis of Variance for Ductility, %, using Adjusted SS for Tests
Melting Temp °C 4 0.020839 0.005210 5.55
Rotational Speed, RPM 4 0.000051 0.000013 0.01
Wt. of reinforcement 4 0.093609 0.023402 24.94
Particle Size, m 4 0.089335 0.022334 23.80
Distance, mm 4 0.171158 0.042789 45.59
Error 4 0.0004 0.00001 0.11
Total 24 0.374992 5.55
Table 4(a) and 4(b) shows the ANOVA results for hardness and Ductility for five factors varied at five levels and interaction of those factors. This analysis is carried out for a confidence level of 95%. Sources with the P value less than 0.05 were considered to have a statically significant contribution to the performance measure.
From ANOVA and Signal /Noise ratio, it is concluded that Wt. of reinforcement has the highest contribution on hardness and ductility is followed by distance from the center of the ingot.
4. MULTIPLE REGRESSION MODEL
Using statistical software “MINITAB 14”, a Multiple Regression analysis is developed. This model gives the relationship between an experimental values verses predicted values and the response variable is obtained by fitting a linear equation bygiving data. The generated regression equation establishes the correlation between the significant terms obtained from ANOVA analysis for the control factors.
The Regression equation developed for ZA-27/Al2O3 MMC for hardness and ductility as
Volume 01, No. 10, October 2015
P
age
82
Hardness = 130.839 - 0.0861877 A - 0.176718 B + 0.803639 C - 0.0491628 D + 4.72042
E + 0.000349566 A*B + 0.00307473 B*C + 0.00207902 C*D - 0.053039 D*E - 0.00732791 E*A - 8.38288e-6 A*B*C + 1.11121e-5 B*C*D +
2.95709e-5 C*D*E + 8.2839e-5 D*E*A (1)
Ductility = 2.68271 + 0.000573373 A + 0.000765348 B + 0.00433615 C - 0.000483626 D
- 0.011796 E - 1.2394e-6 A*B - 4.09065e-005 B*C - 0.000164073 C*D + 0.00014098 D*E + 1.09698e-5 E*A + 5.07891e-8 A*B*C + 1.22781e-7 B*C*D - 4.20913e-7 C*D*E - 2.55507e-7 D*E*A
(2)
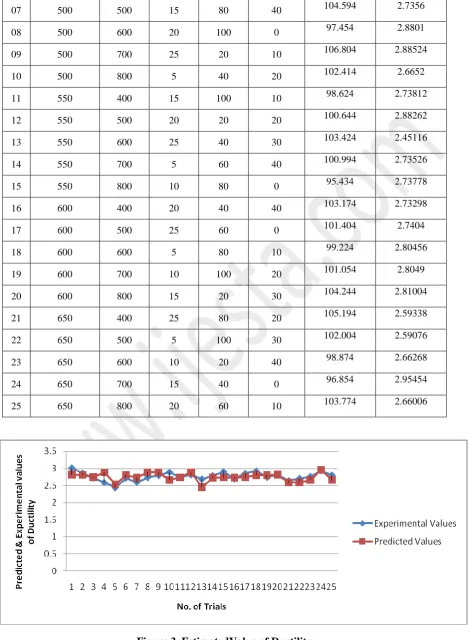
PREDICTED VALUES
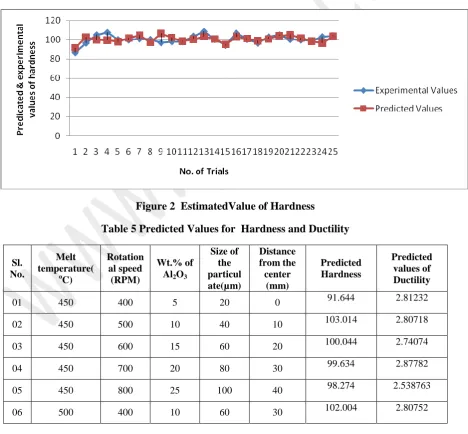
The experimental values will be fed into the MINITAB along with the control parameter. The Table 5 showsthe values of hardness and ductility for various control factors at different levels obtained from from Regression Analysis technique,Fig 2 and 3 shows the variation in experimental and predicted values for hardness and ductility.
Figure 2 EstimatedValue of Hardness
Table 5 Predicted Values for Hardness and Ductility
Sl. No.
Melt temperature(
oC)
Rotation al speed (RPM)
Wt.% of Al2O3
Size of the particul ate(µm)
Distance from the center
(mm)
Predicted Hardness
Predicted values of Ductility
01 450 400 5 20 0 91.644 2.81232
02 450 500 10 40 10 103.014 2.80718
03 450 600 15 60 20 100.044 2.74074
04 450 700 20 80 30 99.634 2.87782
05 450 800 25 100 40 98.274 2.538763
Volume 01, No. 10, October 2015
P
age
83
07 500 500 15 80 40 104.594 2.7356
08 500 600 20 100 0 97.454 2.8801
09 500 700 25 20 10 106.804 2.88524
10 500 800 5 40 20 102.414 2.6652
11 550 400 15 100 10 98.624 2.73812
12 550 500 20 20 20 100.644 2.88262
13 550 600 25 40 30 103.424 2.45116
14 550 700 5 60 40 100.994 2.73526
15 550 800 10 80 0 95.434 2.73778
16 600 400 20 40 40 103.174 2.73298
17 600 500 25 60 0 101.404 2.7404
18 600 600 5 80 10 99.224 2.80456
19 600 700 10 100 20 101.054 2.8049
20 600 800 15 20 30 104.244 2.81004
21 650 400 25 80 20 105.194 2.59338
22 650 500 5 100 30 102.004 2.59076
23 650 600 10 20 40 98.874 2.66268
24 650 700 15 40 0 96.854 2.95454
25 650 800 20 60 10 103.774 2.66006
Volume 01, No. 10, October 2015
P
age
84
CONCLUSION
The experimental results show that the Wt. % of Al2O3 has most significant effect on the
multiple performance characteristics such as hardness and ductility of the ZA-27/Al2O3
composites.
The position of the specimen from the center axis of spinning is second and is followed by melting temperature, particle size and lastly rotation speed.
It was observed that optimized parameters have shown good results, the initial hardness of ZA-27/Al2O3 MMC is 86.6 BHN to 107.6 BHN and the Ductility is 2.4% to 3%
The optimized parameters for the hardness of ZA-27/Al2O3 MMC is the melt temperature
of 600oC, rotational speed of 700rpm, Wt. % of alumina is 20%,Size of the particulate is 40µm and Distance from the center is 30mm,which gives the hardness of 105.45 BHN
The optimized parameters for the Ductility of ZA-27/Al2O3 MMC is the melt temperature
of 600oC, rotational speed of 400rpm, Wt. % of alumina is 5%,Size of the particulate is 20µm and Distance from the center is 0mm,which gives the ductility of 2.902%
Finally the prediction of hardness and ductility is being done using the Multiple Regression Analysis which gives the 5% error by comparing the measured data and estimated data of both hardness and ductility.
REFERENCES
i. Bobic.et al. “Microstructure and mechanical properties of Zn25Al3Cu based composites with large Al2O3 particles at room and elevated temperatures”, International Journal of Materials Research: Vol. 101, No. 12, pp. 1524-1531
ii. Balalan, Kaplan “Investigation of the Microstructure and Wear Properties of a Cast ZA Alloy”, International Journal of Science & Technology, Volume 2, No 1, 75-81, 2007.
iii. Babic, M., Slobodan, M., Dzunic, D. and Jeremic, B., 2010, Tribol Lett 37 ,401–410
iv. Li, Y., Ngai, T. L., Xia, W. and Zang, W., Wear 198 ,129-135 ,1996
v. Tijun, C., Chengren, Y., Mingfeng, F., Ying, M., Yuandong, L. and H. Yuan, , China Foundry, Vol.6, No. 1, 2009
vi. G. Taguchi, introduction to quality engineering, Asian productivityorgnization,1990.