© Central Fisheries Research Institute (CFRI) Trabzon, Turkey and Japan International Cooperation Agency (JICA)
Diel Variations on the Fish Assemblages at Artificial Reefs in Two Different
Environments of the Aegean Sea (Western Coast of Turkey)
Introduction
Monitoring and assessment of artificial reefs to evaluate their effectiveness had gained great importance in recent years (Borton and Kimmel, 1991; Seaman and Jensen, 2000). More accurate description of fish fauna, abundance and biomass and monitoring of changes of these variables by yearly, seasonally and daily may provide better understanding on ecological and biological process in this structure. Most of the studies aimed for determination of fish assemblages at artificial reef had been made during day time (e.g. Charbonnel et al.,
2002; Lök et al., 2002; Relini, 2000). This may result
in lower estimate of fish assemblages. The literature on diel activity of fish are common mainly at coral reefs (Colton and Alevizon, 1981; Helfman, 1978; Hobson, 1965; 1972; Hobson et al., 1980) and scarce
at artificial reefs (Santos et al., 2002). Difficulties and
logistic problems may play important roles in carrying out this kind of study.
The objective of this study is to determine the variations of fish assemblage during the diel cycle in terms of number of species, abundance and biomass. We specifically compared variations of fish assemblage on ARs deployed on muddy and sea grass habitats.
Material and Methods
Site and Artificial Reef Descriptions
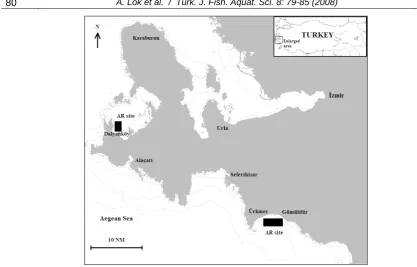
Dalyanköy is located in the Bay of Ildır (Central Aegean Coast of Turkey), 100 km west of İzmir (Figure 1). Dalyanköy artificial reef (DAR) site is approximately 700 m off-shore and at depth of 20-21 m. The bottom between 1 and 30 m depth is covered by sea grass (Posidonia oceanica (L.) Delile) and
muddy at deeper depths. There is not any natural reef in 800 m proximity.
ARs were constructed from concrete modules in two designs. Fifty hollow cubic modules: 100 cm x 100 cm x 100 cm, (1 m³), weighed approximately 735 kg in air (385 kg in water) and had 15 cm column width. Another 50 modules had cross shaped design; measures and volume were the same like the hollow cubic modules. But weight was 569 kg in air (298 kg in water) and column width was 10 cm. Drawings and some other details can be found in Lök et al. (2002).
ARs were deployed at 20-21 m depths in four sets and each set consisted of 25 hollow cubic or cross shaped units in September 1995. Each reef set was 50 m from adjacent set.
Gümüldür and Ürkmez are neighbouring coastal villages located in Gulf of Kuşadası, 60 km south of
İzmir. AR sites in Gümüldür-Ürkmez coast are
Abstract
Determination of diel variations of fish assemblages around artificial reefs may provide a better understanding of the ecological and biological process occurring in these man-made structures, as well as more accurate evaluation of their effectiveness. The aim of this study was to determine the diel variations of the fish assemblages on artificial reefs on muddy and sea grass meadow areas of Western coast of Turkey (Aegean Sea). To determine the diel variations, visual census were conducted according to a time schedule (06:00-07:00, 12:00-13:00, 18:00-19:00 and 24:00-01:00) by SCUBA divers in August 2004. Counts were made as three replicates during each time period. A total of 27 fish species belonging to 10 families were recorded in DAR. At GÜAR, 27 fish species belonging to 13 families were recorded. The lowest species (3 in both sites) and individual numbers (4 in GÜAR and 9 in DAR) were recorded at night (24:00-01:00 period) observations in both sites while the highest numbers were recorded at 06:00-07:00 at DAR (16 species and 838 individuals) and at 12:00-13:00 at GÜAR (11 species and 1068 individuals). Biomass values changed between 293 g and 20,600 g in DAR. The lowest value recorded at night and highest value at 12:00-13:00 period. In GÜAR, the lowest and the highest values were recorded during morning observations. In result of study, it was found that fish assemblages showed significant diel variations in both environments.
Key words:fish composition, visual census, artificial reef, Aegean Sea.
Altan Lök1,*, Benal Gül1, Ali Ulaş1, F. Ozan Düzbastılar1, Cengiz Metin1
1 Ege University, Faculty of Fisheries, Bornova, 35100, İzmir, Turkey.
* Corresponding Author: Tel.: +90.232 3434000/5225; Fax: +90.232 3747450; E-mail: [email protected]
approximately 600 m offshore and parallel to shore. Sea bottom between 0-5 m is sandy; 5-15 m is covered by P. oceanica meadows and than muddy
zone extending to deeper areas. Nearest natural reef is located 1 nautical mile south-east of AR site. These ARs were also constructed from concrete modules in two designs. 180 hollow cubic concrete modules were constructed by Gümüldür Municipality; each measured 120 cm x 120 cm x 120 cm, occupied 1.7 m³, weighed approximately 1,365 kg in air (715 kg in water) and had 25 cm column width. These 180 reef modules were deployed in 9 reef sets (each set has 20 modules) at 18-21 m depths in October 1998. Ürkmez Municipality was also constructed 160 pentagon-dome shape modules; each side of pentagon is 80 cm and height is 150 cm, occupied approximately 2 m³, weighed 1575 kg in air (825 kg in water) and had 25 cm column width. Distances between reef sets in both sites were approximately 200 m.
Wind conditions in Gümüldür-Ürkmez AR (GÜAR) site were worse than Dalyanköy, because this site is open to southward. DAR site is located in a Bay and an only north wind affects the site. Horizontal underwater visibility varied between 15-30 m in Dalyanköy and 5-20 m in Gümüldür-Ürkmez in general. Small scale commercial and recreational fishery activities exist in both areas.
Sampling
Observations were carried out between 3–6 August in DAR and 8–11 August in GÜAR. To determine diel variations in fish assemblages in both sites, visual census methods were used, as described by Harmelin-Vivien et al. (1985), Borton and Kimmel
(1991), Bohnsack et al. (1994), according to a time
schedule 00:00-01:00 (night), 06:00-07:00 (morning), 12:00-13:00 (midday), and 18:00-19:00 (afternoon). Visual count continued until all fish counted. Fast and large fishes were first censused and than cryptic and small species were counted. Fish assemblages in four time periods were sampled for fish composition, abundance and fish size estimation. The names of fish species in this paper are according to Fisher et al.,
(1987). The method of abundance groups for enumeration of fish schools and the size group method for size estimations described by Harmelin-Vivien et al. (1985) were used in visual census. Three
replicates were conducted for both sites during all sampling period.
Total census was made by divers in all observation periods. Diving time was approximately 10 min for day diving and 15 min for night dives. Our anxiety during night dives was to frighten some fishes. For this reason, we made a plan to reduce possible negative effects of voice (generated by SCUBA equipment) and light. Each dive was started approximately 20 m away from the reef buoy. Underwater lights were kept off until arrival to reef set. While one diver was using 100 watt halogen light and leading a second diver, second diver was recording fish to plate under small light attached to his/her own mask.
Divers (authors) in this study have minimum ten years diving and observation experience in artificial reef sites. Furthermore, they have experience in fish size estimation during last two years in study areas.
Analyses
Statistical analyses were carried out using SPSS Version 11.0 for Windows®. Biomass estimation was
made using individual length estimates and length to weight conversion formulas. Length to weight conversion formulas belongings to all fish species could not be obtained from one literature. For this reason, different literatures were used (Rafail, 1972; Bauchot and Bauchot, 1978; Magnusson and Magnusson, 1987; Chauvet, 1991; Dulcic et al., 1994;
Dulcic and Kraljevic, 1996; Gonçalves et al., 1997;
Manooch and Potts, 1997; Merella et al., 1997;
Stergiou and Moutopoulos, 2001; Taskavak and Bilecenoglu, 2001; Abdallah, 2002; Moutopoulos and Stergiou, 2002; Koutrakis and Tsikliras, 2003; Valle
et al., 2003). Where there was not any available
conversion formula, the formula of nearest fish with the most similar body shape was used. Data were obtained from visual counts were non-parametric. For this reason, data were converted to log10 and these
converted data analyzed for homogeneity of variance. After that all converted data were analyzed by using the One-Way ANOVA. Jaccard and Bray-Curtis similarity indices were used to measure of the similarity of the structure of fish communities in both AR sites following Washington (1984).
Results
Assemblage Structure in DARs
A total of 27 species (3935 fishes) belonging to 10 families were recorded in 36 censuses during 3 sampling days (Table 1). Labridae (10 species) and Sparidae (8 species) were the dominant families in the fish community (67% of the species pool). The lowest values of number of species, abundance and biomass were recorded during night observations while the highest values were recorded at morning observations (Figure 2). Differences between mean values of number of species, abundance and biomass belonging to four time periods were found significant (P<0.05). Distribution of species according to diet was 77.8% carnivore, 18.5% omnivore and 3.7% herbivore.
Nine labrid species (Table 1) were never seen during night diving except one individual of L. merula; but most of these species were encountered
under the canopy of sea grass around ARs at night. S. cretense was also not observed at night dives. C. chromis and S. maena showed peaks in the morning
and midday, with lowest value at night. D. puntazzo
Table 1. Fish species censused in Dalyanköy AR site during all observation periods. Fish species, common name and diet are
according to Fisher et al. (1987)
Species Common name Diet1 Economic
value2 number Total Biomass (kg) 1 Serranus scriba Painted comber Car. R 74 6.23 2 Mullus surmuletus Striped red mullet Car. C 4 0.29
3 Boops boops Bogue Omn. C R 1 0.01
4 Dentex dentex Common dentex Car. C R 3 0.95 5 Diplodus annularis Annular seabream Car. C R 145 2.59 6 Diplodus sargus White seabream Car. C R 20 3.38 7 Diplodus vulgaris Two-banded seabream Car. C R 271 18.55 8 Lithognathus mormyrus Striped seabream Car. C R 5 0.56 9 Diplodus puntazzo Sharpsnout seabream Omn. C R 25 8.96 10 Spondyliosoma cantharus Black seabream Omn. C R 15 0.98 11 Spicara maena Blotched picarel Car. C R 1,687 161.83
12 Chromis chromis Damselfish Car. 3,344 6.96
13 Labrus merula Brown wrasse Car. R 58 7.91
14 Labrus viridis Green wrasse Car. 47 12.73
15 Coris julis Rainbow wrasse Car. R 22 0.48
16 Symphodus rostratus Beakednose wrasse Car. 9 0.12 17 Symphodus mediterraneus Axillary wrasse Car. 26 0.36 18 Symphodus melanocercus Black-tail wrasse Car. 61 0.45
19 Symphodus ocellatus Wrasse Car. 2 0.02
20 Symphodus roissali Five-spotted wrasse Car. 9 0.11 21 Symphodus tinca Peacock wrasse Car. 63 2.91
22 Symphodus doderleini Wrasse Car. 10 0.16
23 Spariosoma cretense Parrot fish Omn. 6 0.24 24 Parablennius rouxi Black-banded blenny Her. 3 0.00 25 Parablennius gattorugine Tompot blenny Omn. 7 0.08 26 Tripterygion tripteronotus Black-head blenny Car. 4 0.00 27 Scorpaena porcus Black scorpionfish Car. C 14 2.39
Total 3,935 239.25
was observed only at night and morning periods with peak value at night. M. surmuletus, B. boops, D. dentex, P. rouxi and T. tripteronotus occurred in
rather low quantities. For this reason, their diel pattern is not clear. All other species displayed a relatively consistent abundance pattern during all observation periods. For sparids, abundance and biomass declined, but number of species remained almost the same during the last day of the observations.
a 0 2 4 6 8 10 12 14 16 18
00:00 06:00 12:00 18:00
Time of observation
N u m b er o f sp eci es b 0 100 200 300 400 500 600 700 800 900
00:00 06:00 12:00 18:00
Time of observation
N u m b er o f in d ivi d u al s c 0 5000 10000 15000 20000 25000 30000
00:00 06:00 12:00 18:00
Time of observation
B io m as s ( g )
Figure 2. Mean changes of number of species (a), number
of individuals (b) and biomass (c) according to observation periods in DAR. Vertical bars represent the range between minimum and maximum values.
Assemblage Structure in GÜARs
Twenty-seven species (3,460 fishes) belonging to 13 families were recorded in 36 census during 3 sampling days (Table 2). Sparidae (7), Labridae (4), Serranidae (3) and Scorpaenidae (3) were dominant families in the fish composition (63%).
The lowest values of number of species and abundance were recorded at night and afternoon for biomass (Figure 3). The highest values of biomass
a 0 2 4 6 8 10 12
00:00 06:00 12:00 18:00
Time of observation
N u m b er o f sp ec ie s b 0 200 400 600 800 1000 1200
00:00 06:00 12:00 18:00
Time of observation
N u m b e r of i n di v idua ls c 0 2000 4000 6000 8000 10000 12000 14000 16000 18000
00:00 06:00 12:00 18:00
Time of observ ation
B io m ass ( g )
Figure 3. Mean changes of number of species (a), number
of individuals (b) and biomass (c) according to observation periods in GÜAR. Vertical bars represent the range between minimum and maximum values.
Time of observation
Bioma
were determined at night and during morning observation. But a big L. amia individual (approx. 1
m total length and 13 kg) was observed during morning census. If we exclude this individual, mean value of biomass at morning observation will be slightly higher than afternoon period. The highest values of number of species and abundance were recorded during midday observations. While differences between mean value of number of species and abundance in comparisons of four observation periods were found significant (P<0.05), differences between biomass values were found insignificant (P>0.05). Distribution of species according to diet was 85.2% for carnivore, 7.4% for omnivore and 7.4% for herbivore.
All other sparid species except for D. annularis
and D. vulgaris were observed only at night while all
labrids, C. chromis, P. rouxi, S. scrofa and S. notata
were not observed during night time. Although abundance of S. umbra showed similarity during
night, morning and midday periods, it was not encountered in afternoon. S. porcus showed peak
value in afternoon, with the lowest value at night. S. cabrilla and D. vulgaris displayed a relatively
consistent pattern during all periods. Because of low abundances, diel patterns of other species are not clear.
Comparisons of Habitat Assemblages
Habitat assemblages based on number of species, abundance and biomass for overall and observation periods were compared in DAR and GÜAR. Number of species (27) was the same in both sites but compositions of species were different. Each site has 15 different and 12 common species (42 species in total). Similarity indices of fish communities in both sites were found 28.57% with Jaccard and 65.31% with Curtis. Since Bray-Curtis index is including the number of individuals into the analysis, similarity between fish communities was found high but similarity was found very low when we used Jaccard index, because this index expresses the percentage of species shared in common (Washington, 1984). GÜAR has 3 more families (13) than DAR (10). While Labridae and Sparidae were dominant with 10 and 8 species in DAR, respectively, Sparidae was dominant with 7 species in GÜAR and followed by Labridae (4), Serranidae (3) and Scorpaenidae (3).
In general, comparison of both sites according to mean values of number of species, abundance and biomass, differences was not found significant (P>0.05). Differences between mean values of number of species, abundance and biomass at night
Table 2. Fish species censused in Gümüldür-Ürkmez AR sites during all observation period. Fish species, common name and
diet are according to Fisher et al. (1987)
Species Common name Diet1 Economic
value2 number Total Biomass (kg) 1 Muraena helena Mediterranean moray Car. 3 0.1
2 Conger conger European conger Car. 1 0.03
3 Serranus cabrilla Comber Car. R 75 3.67
4 Epinephelus costae Goldblotch grouper Car. C R 5 3.9 5 Epinephelus marginatus Dusky grouper Car. C R 6 0.52
6 Apogon imberbis Cardinal fish Car. 5 0.01
7 Lichia amia Leerfish Car. R 1 13.86
8 Sciaena umbra Brown meagre Car. C 19 6.1
9 Mullus barbatus Red mullet Car. C 2 0.43
10 Mullus surmuletus Striped red mullet Car. C 9 0.36 11 Dentex dentex Common dentex Car. C R 7 4.03 12 Diplodus annularis Annular seabream Car. C R 11 0.32 13 Diplodus sargus White seabream Car. C R 6 0.59 14 Diplodus vulgaris Two-banded seabream Car. C R 216 12.09 15 Oblada melanura Saddled seabream Omn. C R 16 2.75 16 Diplodus puntazzo Sharpsnout seabream Omn. C R 9 5.46
17 Sarpa salpa Salema Her. C R 17 2.54
18 Chromis chromis Damselfish Car. 2,705 4.62
19 Coris julis Rainbow wrasse Car. R 3 0.11
20 Symphodus tinca Peacock wrasse Car. 1 0.07
21 Thalossoma pavo Ornate wrasse Car. R 42 0.64
22 Symphodus doderleini Wrasse Car. 44 0.17
23 Parablennius rouxi Black-banded blenny Her. 144 0.12 24 Tripterygion tripteronotus Black-head blenny Car. 1 0.00 25 Scorpaena porcus Black scorpionfish Car. C 72 5.33 26 Scorpaena scrofa Red scorpionfish Car. C 35 12.12 27 Scorpaena notata Small red scorpionfish Car. C 5 0.02
Total 3,460 79.95
and midday observations in both sites were not found significant (P>0.05). But for the morning data, differences between all values were found significant (P<0.05). For the afternoon data, differences between abundance values were found significant while differences in number of species and biomass were not significant (P>0.05).
Diet compositions were similar in both sites, but the ratio of carnivore species in GÜAR (85.2%) was higher than that in DAR (77.2%) and omnivore species has higher ratio in DAR (18.5%) in comparison to that in GÜAR (7.4%).
Discussion
Fish assemblages showed diel variations in both environments. This is the first study on determination of diel variations of fish assemblages at the ARs in Aegean and Mediterranean Seas. We found a similar study belonging to Santos et al. (2002) who
conducted it at the Atlantic Coast of Portugal. We can compare fish assemblages in GÜAR thanks to this study, because some characteristics of their artificial reef area have similar conditions to GÜAR site (muddy environment and 21 m depth). Fish assemblage variations during the day are similar in both studies. Numbers of species and abundance (density in Santos’ paper) have peak values at midday period and during at night observations. Sparidae is dominant family in both studies, but we determined more species than Santos’ study (27 vs. 18). This may be due to different visual census methods and biogeographically conditions.
Significant variation in diurnal abundances at the four time periods (09:00 – 12:00 – 15:00 – 18:00) had been found by Colton and Alevizon (1981) in Bahamian coral reef fish assemblage. If we consider similar time period in our study, our results support their findings.
C. chromis and S. maena have a major role in
increasing and decreasing of abundance and biomass between observation periods at DAR. This species is forming schools during day time and feed on zooplanktons and they prefer to hide into reef units and under the canopy of sea grass at night. As these two species, all labrids have a clear diel activity pattern. They prefer to hide during the night (Santos
et al., 2002) while they are active, seeking food
during the day. Helfman’s (1978) suggest is that the timing of activities is a familial characteristic in general.
C. chromis has also an important place at high
abundance at GÜAR during day time. Variation of biomass between observation periods at GÜAR is mainly due to Sparidae species. Especially existence of big D. dentex, D. sargus, D. puntazzo and S. salpa
during the night is to increase the biomass of this observation period. Because of the existence of these carnivores, small fish such as P. rouxi, T. tripteronotus, S. doderleini, T. pova and C. chromis
hide to crevices of artificial reef units.
Although difference of the fish assemblage (size, abundance and biomass) was not found significant between two environments, the similarity of community structures was found very low (28.57%). This difference may be due to location, type and quantity of surrounding substrates and isolation from similar habitats (Bohnsack et al., 1991).
E. marginatus is an endangered (EN – A2a)
species. Six individuals belonging to this species were recorded at GÜAR during study period. This species uses artificial reefs as a shelter and feeding area according to our underwater observations. Artificial reefs can be used conservation tool for this species.
This study was carried out in a short period because of some limitations (e.g. logistics, weather conditions, diving equipment). But the study had showed that fish assemblages in both environments have clear diel variations. Results should considered at the evaluation of artificial reef effectiveness. To determine diel activity patterns of fish according to the feeding habits, longer study time, hourly observation periods and stomach analysis should be taken into account as done by Hobson (1965).
Acknowledgments
This project was supported by The Scientific and Technical Research Council of Turkey (Project No: TBAG-2275). We thank to B. Rüzgar and E. Ergün for logistic support and crews of the Research Vessel (EGESÜF) O. Öner and A. Aksade. We also thank G. Metin, İ. Aydın, E. Özvatan and T. Laleli for their help during the cruise and N. Güneş and M. Bilecenoğlu for assistance with data analysis and H. Özbilgin for his help in preparing the manuscript in English.
References
Abdallah, M. 2002. Length-weight relationship of fishes caught by trawl off Alexandria, Egypt. Naga ICLARM Q., 25(1): 19-20.
Bauchot, R. and Bauchot, M.L. 1978. Coefficient de condition et indice pondéral chez les téléostéens.. Cybium, 3(4): 3-16.
Bohnsack, J.A., Johnson, D.L. and Ambrose, R.F. 1991. Ecology of artificial reef habitats and fishes. In: W. Seaman, Jr., L.M. Sprague (Eds.), Artificial Habitat for Marine and Freshwater Fisheries, Academic Press Inc. New York: 61-107.
Bohnsack, J.A., Harper, D.E., McClellan, D.B. and Hulsbeck, M. 1994. Effects of reef size on colonization and assemblage structure of fishes at artificial reefs off southeastern Florida, U.S.A. Bulletin of Marine Science, 55(2-3): 796-823.
Borton, S.A. and Kimmel, J.J. 1991. Environmental assessment and monitoring of artificial reefs. In: W. Seaman Jr., L.M. Sprague (Eds.), Artificial Habitats for Marine and Freshwater Fisheries, Academic Press Inc, New York: 177-236.
artificial units (French Mediterranean coast). ICES Journal of Marine Science, 59: 208-213.
Chauvet, C. 1991. Le corb ou brown meagre (Sciaena umbra Linnaeus, 1758) quelques éléments de sa biologie. In: C.F. Boudouresque, M. Avon and V. Gravez (Eds), Les espéces marines a' protéger en Méditerranée. GIS Posidonie publisher: 229-235 Colton, D.E. and Alevizon, W.S. 1981. Diurnal variability
in a fish assemblage of a Bahamian coral reef. Environmental Biology of Fishes, 6(3/4): 341-345. Dulcic, J. and Kraljevic, M. 1996. Weight-length
relationship for 40 fish species in the eastern Adriatic (Croatian waters). Fisheries Research, 28(3): 243-251. Dulcic, J., Kraljevic, M. and Cetnic, P. 1994. Length-weight relationship in damselfish (Chromis chromis L. 1758) from the eastern Adriatic during spawning. Acta Ichthyol. Piscat., 24(2): 147-154.
Fisher, W., Schneider, M. and Bauchot, M.L. 1987. Fiches FAO d’identification des espèces pour les besoins de la pêche. (Révision 1). Méditerranée et mer Noire.Zone de pêche 37. Volume II. Vertébrés. Publication prepare par la FAO, résultat d’un accord entre la FAO et la Commission des Communautés Européennes (Project GCP/INT/422/EEC) financée conjointement par ces deux organizations. FAO, Rome, 2: 761-1530.
Gonçalves, J.M.S., Bentes, L., Lino, P.G., Ribeiro, J., Canário, A.V.M. and Erzini K. 1997. Weight-length relationships for selected fish species of the small-scale demersal fisheries of the south and south-west coast of Portugal. Fisheries Research, 30: 253-256. Harmelin-Vivien, M., Harmelin, J.G., Chauvet, C., Duval,
C., Galzin, R., Lejeune, P., Barnabé, G., Blanc, F., Chevalier, R., Duclerc, J. and Lasserre, G. 1985. Evaluation visuelle des peuplements et papulations de poissons. Méthodes et problèmes. Revue d’ Ecologie (Terre Vie), 40: 467-539.
Helfman, G.S. 1978. Patterns of community structure in fishes: summary and overview. Environmental Biology of Fishes, 3(1): 129-148.
Hobson, E.S. 1965. Diurnal-Nocturnal activity of some inshore fishes in the Gulf of California. Copeia, 3: 291-302.
Hobson, E.S. 1972. Activity of Hawaiian reef fishes during the evening and morning transitions between daylight and darkness. Fishery Bulletin, 70(3): 715-740. Hobson, E.S., McFarland, W.N. and Chess, J.R. 1980.
Crepuscular and nocturnal activities of Californian near shore fishes, with consideration of their scotopic visual pigments and the photic environment. Fishery Bulletin, 79(1): 1-30.
Koutrakis, E.T. and Tsikliras, A.C. 2003. Length-weight relationships of fishes from three northern Aegean
estuarine systems (Greece). Journal of Applied. Ichthyology, 19: 258-260.
Lök, A., Metin, C., Ulaş, A., Düzbastılar, F.O. and Tokaç, A. 2002. Artificial reefs in Turkey. ICES Journal of Marine Science, 59: 192-195.
Magnusson, J. and Magnusson, J.V.V. 1987. ICEIDA/Cape Verde Islands Fisheries Project. Survey of demersal fish resources in the waters off Cape Verde Islands. IV. Report: summary of information on species. Icelandic International Development Agency/Marine Research Institute, Iceland, 114 pp.
Manooch, C.S., III, Potts, J.C. 1997. Age, growth, and mortality of greater amberjack, Seriola dumerilli, from the U.S. Gulf of Mexico headboat fishery.. Bulletin of Marine Science, 61(3): 671-683.
Merella, P., Quetglas, A., Alemany, F. and Carbonell, A. 1997. Length-weight relationship of fishes and cephalopods from the Balearic Islands (western Mediterranean). Naga ICLARM Q., 20(3/4): 66-68. Moutopoulos, D.K. and Stergiou, K.I. 2002. Length-weight
and length-length relationships of fish species of the Aegean Sea (Greece). Journal of Applied Ichthyology, 18(3): 200-203.
Rafail, S.Z. 1972. A statistical study of length-weight relationship of eight Egyptian fishes. Bull. Inst. Oceanogr. Fish. (Cairo), 2: 136-156.
Relini, G. 2000. The Laona artificial reef. In: A.C. Jensen, K.J. Collins and A.P.M. Lockwood (Eds), Artificial Reefs in European Seas. Kluwer Academic, The Netherlands: 129-149.
Santos, M.N., Monteiro, C.C. and Gaspar, M.B. 2002. Diurnal variations in the fish assemblages at an artificial reef. ICES Journal of Marine Science, 59: 32-35.
Seaman, W., Jensen Jr., A.C. 2000. Purposes and practices of artificial reef evaluation. In: W. Seaman, Jr. (Ed.), Artificial Reef Evaluation with Application to Natural Marine Habitats. CRC Press, New York: 1-19. Stergiou, K.I. and Moutopoulos, D.K. 2001. A review of
length-weight relationships of fishes from Greek marine waters. Naga ICLARM Q., 24(1-2): 23-39. Taskavak, E. and Bilecenoglu M. 2001. Length-weight
relationships for 18 Lessepsian (Red Sea) immigrant fish species from the eastern Mediterranean coast of Turkey. Journal of Marine Biology Association of U.K. 81(5): 895-896.
Valle, C., Bayle, J.T. and Ramos, A.A. 2003. Weight-length relationships for selected fish species of the western Mediterranean Sea. Journal of Applied Ichthyology, 19: 261-262.