Extracting salient features for network intrusion detection
using machine learning methods
Ralf C. Staudemeyer
∗†
, Christian W. Omlin
‡
∗Department of Computer Science, Rhodes University, Grahamstown, South Africa
†School of Computing, University of South Africa, Johannesburg, South Africa
‡School of Computer Science, University of the Witwatersrand, Johannesburg, South Africa
ABSTRACT
This work presents a data preprocessing and feature selection framework to support data mining and network security experts in minimal feature set selection of intrusion detection data. This process is supported by detailed visualisation and examination of class distributions. Distribution histograms, scatter plots and information gain are presented as supportive feature reduction tools. The feature reduction process applied is based on decision tree pruning and backward elimination. This paper starts with an analysis of the KDD Cup ’99 datasets and their potential for feature reduction. The dataset consists of connection records with 41 features whose relevance for intrusion detection are not clear. All traffic is either classified ‘normal’ or into the four attack types denial-of-service, network probe, remote-to-local or user-to-root. Using our custom feature selection process, we show how we can significantly reduce the number features in the dataset to a few salient features. We conclude by presenting minimal sets with 4–8 salient features for two-class and multi-class categorisation for detecting intrusions, as well as for the detection of individual attack classes; the performance using a static classifier compares favourably to the performance using all features available. The suggested process is of general nature and can be applied to any similar dataset.
KEYWORDS:network intrusion detection, feature selection, machine learning, decision trees.
CATEGORIES:•Security and privacy→Network security•Security and privacy→Intrusion detection systems• In-formation systems→Data mining •Information systems→Content analysis and feature selection•Computing methodologies→Machine learning• Computing methodologies→Supervised learning by classification•Theory of computation→Oracles and decision trees
1
INTRODUCTION
This paper covers the preprocessing and selection of im-portant features of a given dataset. Both are essential tasks for data mining and intrusion detection. From the perspective of data mining, dimension reduction aims to find the set of minimal features that best clas-sifies the training data. Some attributes may contain redundant information, while others may contain in-formation suggesting false correlations; either type can hinder correct classification. Additionally, unnecessary features add to computation time. To our knowledge, no general theory exists that captures the relationship between different attacks and provided features.
From the perspective of network intrusion detec-tion systems, there are strong reasons to reduce the number of collected features and choose features that can easily be extracted out of a high-speed data stream. Connections in today’s local area networks forward packets with tens of gigabit per second. In 10 Giga-bit Ethernet networks using the minimal frame-size of
Email:Ralf C. [email protected], Chris-tian W. [email protected]
64 bytes up-to 14.8 million frames can be transferred per second; simply put, the monitoring of data at for-warding rate on high performance networks is a major challenge. In order to perform in-depth packet analysis, it is essential to perform massive data reduction to a volume that can be processed. Keeping this in mind is important if the objective is real-time detection.
Traffic reduction can be accomplished in various ways. Prior to network data collection, filters can be applied to ignore certain types of traffic. While this may only leave traffic considered potentially interest-ing, filtering might remove important data as well. Observed traffic can also be compressed into connec-tion records that summarise the essential informaconnec-tion about individual sessions between two parties. Each connection record then contains preprocessed features; as it was done in the KDD Cup ’99 data set applied in these experiments. The so called ‘base’ features of the KDD Cup ’99 dataset require only the header infor-mation of IP packets and TCP/UDP/ICMP segments and the total size of IP packets.
memory intensive reassembling of data streams. Fur-thermore the data analysis frequently requires domain knowledge, which needs to be provided by an human expert. Extraction and analysis of content features is unlikely to be performed at a large-scale and in real-time in high speed network environments at reasonable cost.
The contributions are presented after a short lit-erature review of related work published on feature reduction of the KDD Cup ’99 datasets. This paper presents a framework that supports a data mining and network security expert in minimal feature set extrac-tion. It uses a custom network feature preprocessing framework, and custom-built training sets derived from the KDD Cup ’99 datasets. This process is supported by detailed visualisation and examination of class dis-tributions.
The feature reduction process applied is based on decision tree pruning and backward elimination. This paper concludes with presenting a number of minimal feature sets for detecting all attacks and individual attacks, using one-classifier training with very few fea-tures.
At this point we note that the KDD Cup ’99 datasets are outdated and do not represent todays network traffic characteristics. The features given are mostly of little relevance for recent attacks that in-volve client side vulnerabilities. Nevertheless it is still the best well known fully labelled intrusion detection dataset available of a decent size. We think it is still relevant for performance evaluation of machine learn-ing algorithms in the field of intrusion detection. The suggested feature reduction methods can be applied on any similar dataset to gain a set of minimal features for any traffic class given.
2
RELATED WORK
The KDD Cup ’99 dataset is the most well known intrusion detection dataset available. The traffic in the dataset is either classified (‘normal’) or as one of the four attack typesdenial-of-service(‘dos’),network probe (‘probe’),remote-to-local(‘r2l’) anduser-to-root
(‘u2r’) attacks. Various static machine learning algo-rithms have previously been evaluated on it. Given a classifier performs well on this dataset; it is fair to assume it works reasonable well on more recent data. The multitude of published results on this specific dataset is of great advantage for comparing results. In the following we list some of the more relevant publications.
The winning entries of the challenge, as sum-marised by Elkan [1], were all variants of the C5 deci-sion tree algorithm (see Quinlan [2]). After the chal-lenge a comprehensive set of other algorithms were tested on the data, mostly with comparable results, were presented by Sabhani and Serpen [3], Sung and Mukkamala [4], Chavan, Shah et al. [5] and Peddabachi-gari, Abramham et al. [6].
The majority of published results observing feature reduction on the KDD Cup ’99 datasets are trained
and tested on the ‘10%’ training set only (see Sung and Mukkamala [4], Kayacik, Zincir-Heywood et al. [7] and Lee, Shin et al. [8]). Some researchers used custom-built datasets with 11,982 records extracted from the ‘10%’ KDD Cup ’99 training set (see Chavan, Shah et al. [5], Chebrolu, Abraham et al. [9] and Chen, Abraham et al. [10]). These sets were split into 5,092 training and 6,890 test records. Due to the fact that ‘r2l’ and ‘u2r’ attacks occur very seldom in the training data and produce very few connection records per attack the results for these attacks cannot be very meaningful; even if corresponding records are manually added to the training data. Furthermore these results using only the KDD Cup ’99 training data cannot be directly compared to results using the original test set. One strong reason is the very different traffic types and distributions of these two sets.
Sung and Mukkamala [4] applied single feature deletion to the KDD Cup ’99 datasets using neural networks and support vector machines. Using the SVM classifier they extracted a 30 feature set with improved training time and, in terms of accuracy, comparable performance. With the neural network classifier using 34 important features they improved in training time and false negative rate but with a significant degra-dation of accuracy. For the SVM classifier they also reduced the number of features for the five individual traffic classes to 25 (‘normal’), 7 (‘probe’), 19 (‘dos’), 8 (‘u2r’) and 6 (‘r2l’).
Important input features, with the focus on build-ing computationally efficient intrusion detection sys-tems, were identified by Chebrolu, Abraham et al. [9]. They investigated the performance of Bayesian net-works and classification and regression trees. Both classifiers already provide methods for significant fea-ture selection: Bayesian networks use the Markov blan-ket model and classification and regression trees use the Gini impurity measure. The feature reduction using the Markov blanket model found 17 important features. Using classification and regression trees only primary splitters were considered; resulting in a 12 set with important features. The authors conclude by suggesting a hybrid model using both classifiers.
Chavan, Shah et al. [5] use a decision tree approach for feature ranking per class. For evaluation they use artificial neural networks and fuzzy inference systems. The authors reduce the number of features to 13 (‘nor-mal’), 16 (‘probe’), 14 (‘dos’), 15 (‘u2r’) and 17 (‘r2l’). In Kayacik, Zincir-Heywood et al. [7] the relevance of each feature provided in the KDD Cup ’99 intrusion detection dataset is investigated in terms of informa-tion gain. The paper presents the most relevant feature for each individual attack that occurs in the training set. A important result is that 9 features make no contribution to intrusion detection.
Chen, Abraham et al. [10] reduce the number of input features using flexible neural tree Model to 4 (‘normal’), 12 (‘probe’), 12 (‘dos’), 8 (‘u2r’) and 10 (‘r2l’).
The proposed genetic algorithm wrapper approach is contrasted against a non-linear filter. Performance was measured using a selective na¨ıve Bayes classifier. Both methods extracted a total of 21 important features with 11 features in common. The total performance of the genetic feature selection method shows a slight improvement in terms of accuracy. The proposed ap-proach was especially effective in detecting unknown attacks.
In Staudemeyer and Omlin [11] a set of 11 selected features is presented, which consists of 7 basic features and 4 higher-level features for the detection of all traffic classes. Extraction bases on information gain and the decision tree classifier. In comparison to these results for multi-class categorisation published in previous work, we present in this paper individual minimal feature sets for all four attack classes.
A principal component analysis neural network algorithm (PCANNA), that uses principal component analysis for feature reduction, is described by Lakhina and Joseph [12]. The authors of this paper use the NSL-KDD dataset, a revised version of the KDD Cup ’99 dataset as presented in Tavallaee, Bagheri et al. [13].
The number of features are reduced to 8 features for the detection of all attacks.
Olusola, Oladele et al. [14] show that 7 features are of very low to no relevance for the classification of any traffic label. Here the most relevant features were detected by using a rough set approach. The feature sets range from 1 (e.g. different kinds of network probes) to 15 (normal traffic) features.
Bol´on-Canedo, S´anchez-Maro˜no et al. [15] present feature sets ranging from 7 to 16 features. These were extracted with a combination of discretisation, filtering and classification methods to extract minimal feature sets.
From these previous experiments it can be con-cluded that the potential for feature reduction is sig-nificant. At least a quarter of the features provided by the KDD Cup ’99 datasets seem to be unimportant for classifying the observed attacks. In contrast to previous work we aim for core feature sets with as few as 4–8 features.
3
DATASETS AND CRITICISM
The choice of training data available for machine learn-ing in the field of network intrusion detection systems is very limited. One of the few, but at the same time most comprehensive, widely used datasets are the DARPA datasets. They are freely available from the website of the Information Systems Technology Group(IST) of the MIT Lincoln Laboratory.1. These datasets are
called DARPA datasets because their generation was sponsored by theDefense Advanced Research Projects Agency (DARPA ITO) and the Air Force Research Laboratory(AFRL/SNHS).
1DARPA Intrusion Detection EvaluationInformation Sys-tems Technology Group (IST). MIT Lincoln Laboratory. Web site. http://www.ll.mit.edu/mission/communications/ist/-corpora/ideval/index.html
In 1998–2000, the MIT Lincoln Laboratory con-ducted the DARPA Intrusion Detection Evaluation, which resulted in three scenario specific datasets. The two main datasets collected in 1998 and 1999 provided off-line evaluation data based on network traffic data and audit logs collected on an simulation network.
The 1998 DARPA Intrusion Detection Evaluation network was simulating an air force base local area network. Seven weeks of training data and two weeks of testing data were collected. The total collected data contains more than 200 instances of 39 mostly network-based attack types embedded into background traffic similar to that of an air force base local area network. All traffic is either classified (‘normal’) or as one of various attack types. The attack types are grouped into the four attack categories: denial-of-service(‘dos’),network probe(‘probe’),remote-to-local
(‘r2l’) anduser-to-root(‘u2r’) attacks. In addition, the data contains anomalous user behaviours such as a normal user acting like a privileged user.
The aim of ‘dos’ attacks is to prevent users access to a service. ‘TCP syn floods’ are an example of this type of attack. ‘probe’ attacks such as ‘portscans’ and ‘ipsweeps’ are used to collect information about poten-tial targets. Attackers on a remote machine using ‘r2l’ attacks try to gain user access on a machine they do not have access to. This can be achieved by, for exam-ple, dictionary attacks based on password guessing. A ‘u2r’ attack occurs when an attacker who has already achieved user access on a system tries to gain privi-leged access. Various buffer overflow attacks against network services fall in this category. Attackers often use combinations of the attack types classified above. In the majority of cases, attackers follow a ‘probe’→ ‘r2l’→‘u2r’ pattern of behavior.
The training data of the 1998 DARPA Intrusion De-tection Evaluation contains ‘tcpdump’ data collected by the ‘tcpdump’ packet sniffer and a range of log and process information for every day of the evaluation. The collected data contains information about every packet transmitted between devices of the inside and the outside network. Additional information provided by so-called ‘listfiles’ basically adds session start time, session duration, source and destination port, source and destination IP, and attack name.
The training set used for this paper contains a total of 22 different attacks types. The test data used to evaluate a trained intrusion detection system provides the same sensor data except for the ‘listfiles’ with the labelled sessions containing the attacks. The test set contains approximately 114 instances of 37 different attacks. 17 attacks are new and not part of the training set. Two attacks only appear in the training data.
competition was to classify the preprocessed connec-tion records to either normal traffic or one out of the four given attack categories (‘dos’, ‘probe’, ‘r2l’, ‘u2r’).
The seven weeks of network traffic collected in four gigabytes of compressed raw tcpdump files from the DARPA training data were preprocessed into five million labelled and categorised connection records with approximately 100 bytes each; and the two weeks of training data were processed into two million un-labelled connections records. Preprocessing of the DARPA data for the 1999 KDD Cup contest was done with the MADAMID framework described by Lee [16] and Lee and Stolfo [17]. The KDD Cup ’99 datasets are available from the UCI KDD Archive as the 1999 KDD Cup Dataset (see Hettich and Bay [18]).
A connection record summarises the packets of a communication session between a connection initiator with a specified source IP address and a destination IP address over a pair of TCP/UDP ports. The labelled connection records in the training set are categorised normal or indicate one of 22 types of attacks. As far as we know, the KDD Cup ’99 dataset is the most widely researched and publicly available intrusion detection dataset. The fully labelled connection records spanning a few weeks of network traffic and a large number of different attacks.
Each connection record contains 41 input features, 34 continuous- and 7 discrete- valued, grouped into
basic featuresandhigher-level features. Thebasic fea-turesare directly extracted or derived from the header information of IP packets and TCP/UDP segments in the tcpdump files of each session (basic features 1–9 in Table 1). This was done by using a modified version of the freely availableBro Intrusion Detection System2 presented by Paxson [19]. Each connection
record was produced when either the connection was terminated or Bro was closed. The ‘listfiles’ for tcp-dump from the DARPA training data where used to label the connection records.
The so-called content-based higher-level features
use domain knowledge to look specifically for attacks in the actual data of the segments recorded in the tcpdump files. These address ‘r2l’ and ‘u2r’ attacks, which sometimes require only a single connection or are without any prominent sequential patterns. Typical features include the number of failed login attempts or whether root access was obtained during the session (features 10–22 in Table 1).
Furthermore, there aretime-based and connection-based derived featuresto address ‘dos’ and ‘probe’ at-tacks. time-based featuresexamine connections within a time window of two seconds and provide statistics about these. To provide statistical information about attacks extending a two-second time-window, such as slow probing attacks,connection-basedfeatures use a connection-window of 100 connections. Both are fur-ther split intosame host featuresthat provide statistics about connections with the same destination host and
same service featuresthat examine only connections with the same service (features 23–41 in Table 1).
2http://bro-ids.org/
The KDD Cup ’99 competition provides the train-ing and testtrain-ing datasets in a full and a so-called ‘10%’ subset version. The ‘10%’ subset was created due to the huge amount of connection records present in the full set; some ‘dos’ attacks have millions of records. For this reason, not all of these connection records were selected. Furthermore, only connections within a time-window of five minutes before and after the entire duration of an attack were added into the 10% datasets. To achieve approximately the same distribution of in-trusions and normal traffic as the original DARPA dataset, a selected set of sequences with ‘normal’ con-nections were as well left in the 10% dataset. Training and test sets have different probability distributions.
The full training dataset contains 4,898,431 records and the ‘10%’ subset contains 494,021 records. Both contain 22 different attack types that are in the order they were used during the 1998 DARPA experiments. The full test set with 2,984,154 records is only available unlabelled; but a 311,029 record ‘10%’ subset is provided both as unlabelled and labelled test data. It is specified as the ‘corrected’ subset with a different distribution and additional attacks not part of the training set. For the KDD Cup ’99 competition the ‘10%’ subset was intended for training. The ‘corrected’ subset can be used for performance testing. It has 311,029 records containing 37 different attacks. It is to be noticed that the sample distribution of ‘probe’, ‘r2l’ and ‘u2r’ attacks varies strongly between the training sets and the test set.
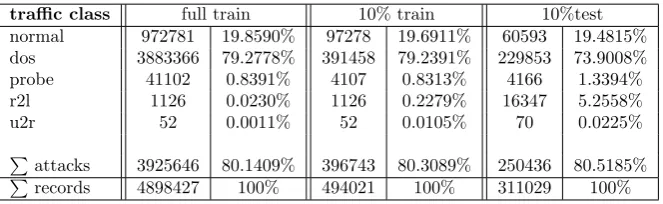
The distributions of the four different attack classes in the full training set, ‘10%’ training set and the ‘cor-rected’ test set is shown in Table 2. An aggravating factor is that the sample distribution of network probes, ’r2l’ and ’u2r’ attacks varies strongly between the
train-ing set and the test set.
A short time after the 1998 and 1999 DARPA intrusion detection system evaluations, McHugh [20] wrote a detailed critique identifying shortcomings of the provided datasets. The primary criticism of the paper was that the evaluation failed to verify that the network realistically simulated a real-world network. Mahoney and Chan [21] look more closely on the con-tent of the 1999 DARPA evaluation tcpdump data and discovered that the simulated traffic contains prob-lematic irregularities. The authors state that many of the network attributes, which have a large range in real-world traffic, have a small and fixed range in the simulation. Since the 1998 evaluation data was generated by the same framework, it can be assumed that it suffers from similar problems.
Sabhnani and Serpen [22] investigated why classi-fiers fail to detect most of ‘r2l’ and ‘u2r’ attacks in the KDD Cup ’99 datasets. They conclude that it is not possible for any classifier to accomplish an acceptable detection rate of these two attack classes. The authors admit that this might be not the case when the KDD Cup ’99 datasets are used in an anomaly detection context.
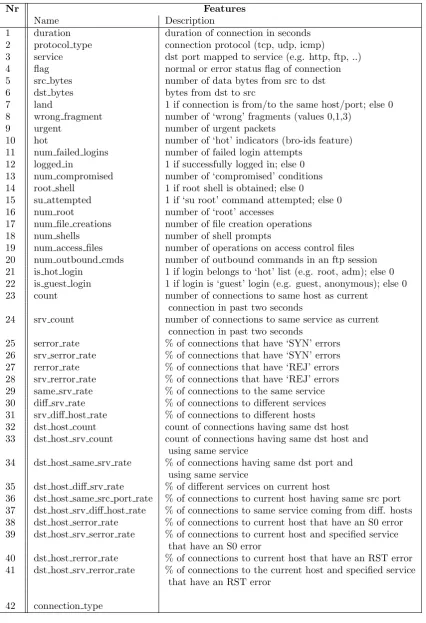
Table 1: The 41 features provided by the KDD Cup ’99 datasets.
Nr Features
Name Description
1 duration duration of connection in seconds
2 protocol type connection protocol (tcp, udp, icmp)
3 service dst port mapped to service (e.g. http, ftp, ..)
4 flag normal or error status flag of connection
5 src bytes number of data bytes from src to dst
6 dst bytes bytes from dst to src
7 land 1 if connection is from/to the same host/port; else 0
8 wrong fragment number of ‘wrong’ fragments (values 0,1,3)
9 urgent number of urgent packets
10 hot number of ‘hot’ indicators (bro-ids feature)
11 num failed logins number of failed login attempts
12 logged in 1 if successfully logged in; else 0
13 num compromised number of ‘compromised’ conditions 14 root shell 1 if root shell is obtained; else 0
15 su attempted 1 if ‘su root’ command attempted; else 0
16 num root number of ‘root’ accesses
17 num file creations number of file creation operations
18 num shells number of shell prompts
19 num access files number of operations on access control files 20 num outbound cmds number of outbound commands in an ftp session 21 is hot login 1 if login belongs to ‘hot’ list (e.g. root, adm); else 0 22 is guest login 1 if login is ‘guest’ login (e.g. guest, anonymous); else 0
23 count number of connections to same host as current
connection in past two seconds
24 srv count number of connections to same service as current connection in past two seconds
25 serror rate % of connections that have ‘SYN’ errors 26 srv serror rate % of connections that have ‘SYN’ errors 27 rerror rate % of connections that have ‘REJ’ errors 28 srv rerror rate % of connections that have ‘REJ’ errors 29 same srv rate % of connections to the same service 30 diff srv rate % of connections to different services 31 srv diff host rate % of connections to different hosts
32 dst host count count of connections having same dst host 33 dst host srv count count of connections having same dst host and
using same service
34 dst host same srv rate % of connections having same dst port and using same service
35 dst host diff srv rate % of different services on current host
36 dst host same src port rate % of connections to current host having same src port 37 dst host srv diff host rate % of connections to same service coming from diff. hosts 38 dst host serror rate % of connections to current host that have an S0 error 39 dst host srv serror rate % of connections to current host and specified service
that have an S0 error
40 dst host rerror rate % of connections to current host that have an RST error 41 dst host srv rerror rate % of connections to the current host and specified service
that have an RST error
traffic class full train 10% train 10%test
normal 972781 19.8590% 97278 19.6911% 60593 19.4815%
dos 3883366 79.2778% 391458 79.2391% 229853 73.9008%
probe 41102 0.8391% 4107 0.8313% 4166 1.3394%
r2l 1126 0.0230% 1126 0.2279% 16347 5.2558%
u2r 52 0.0011% 52 0.0105% 70 0.0225%
P
attacks 3925646 80.1409% 396743 80.3089% 250436 80.5185%
P
records 4898427 100% 494021 100% 311029 100%
Table 2: The varying distributions of the five traffic classes in the KDD Cup ’99 datasets. The distributions of network probes, remote-to-local (‘r2l’) and user-to-root (‘u2r’) attacks vary strongly between the training set and the test set.
intrusion detection system. The performance of this mainly signature-based intrusion detection system was rather poor. The authors reason that it is due to the fact that it is difficult to detect ‘dos’ and ‘probe’ attacks with a fixed signature. So the detection on the ‘r2l’ and ‘u2r’ attacks is in contrast much better. The paper emphasises the need to build a more realistic intrusion detection dataset with focus on false positive evaluation and more recent attacks. For a detailed description of the Snort IDS see Roesch [24].
Tavallaee and Bagheri et al. [13] the authors argue that although the KDD Cup ’99 datasets suffer from various problems, they are still an effective benchmark to compare different intrusion detection methods. To address some of the known issues the authors created a revised version of the datasets, called NSL-KDD. The authors changed the class distributions by cleaning the training and testing datasets from redundant records, and then adding records inversely proportional to their percentage in the original KDD data set. This was done to prevent learning algorithms to be biased towards the more frequent records.
4
CUSTOM DATA PREPARATION
The initial preprocessing of the network data collected at the 1998 DARPA Intrusion Detection Evaluation network for the 1999 KDD Cup contest was done with the MADAMID framework described in Lee [16] and Lee and Stolfo [17]. The connection records of the KDD Cup ’99 dataset contains continuous and nominal (discrete) features preprocessed in very different ways. The continuous features are in various ranges and some have very large values (up-to 700M). The number of discrete values of the nominal features range from three (‘protocol type’) to 71 (‘services’).
In our work decision trees, neural networks and support vector machines are estimated as strong candi-dates for classification of the network datasets. Neural networks require floating point numbers for the input neurons, preferably in the range [−1,1], and floating point numbers in the range [0,1] for the target neurons. All features were preprocessed to fulfil this requirement. Scaling the input values to [0,1] is possible as well, but [−1,1] works better, since any scaling that sets the mean closer to zero improves the value of the feature. Preprocessing was done by us using for this
work custom developed network feature preprocess-ing scripts. For nominal features with three distinct values, effects coding mapping from one or two input features was applied, such as protocol type: UDP = [0,1], protocol type: ICMP = [1,0], and protocol type: TCP = [−1,−1]. For nominal features with a large number of distinct values, were first mapped to or-dered numbers using a least-first ranking score. Then the numbers were scaled to the range [−1,1], for ex-ample flag: S3 (50 occurrences) = −1 and flag: SF (3744328 occurrences) = 1. The ranking order was chosen according to the number of occurrences in the test set.
The nominal target value ‘connection type’, con-taining the specific traffic label, is first mapped to one of the five connection classes (‘normal’, ‘dos’, ‘probe’, ‘r2l’, ‘u2r’), according to the categorisation script by W.Lee used in the KDD Cup ’99 contest scoring. Then each class is represented by its own output feature hav-ing a binary value, such as connection type: ‘normal’ = [1,0,0,0,0] and connection type: ‘r2l’ = [0,0,0,1,0]. Features with non-changing values from the training data, such as ‘num outbound cmds’ and ‘is host login’, were removed.
For the numeric features ‘duration’, ‘src bytes’, and ‘dst bytes’, were started with the removal of outliers before scaling the values to the range [−1,1]. This was done by reducing the maximum value of each feature to a manually defined threshold; for example, duration: Maximum 30,000 sec. Threshold values were estimated using expert knowledge on expected maximum values to be considered for ‘normal’ connections. Before nor-malisation, the natural logarithm was finally applied to the continuous features with strongly biased distri-butions having a lower bound but no upper bound. For all operations, a precision of 10−6was used.
After preprocessing, the datasets consisted of 39 input features and one output feature, where the input features were mapped to 40 inputs, and the output feature was mapped to the 5 outputs.
5
EXTRACTING SALIENT FEATURES
Dash and Liu [25]. Starting fromnattributes, there are 2n possible subsets. With an increasing number
of attributes, the exhaustive search over all attributes gets very expensive.
It is very common to use heuristic methods that only search a reduced search space. Examples of very straightforward search strategies are stepwise forward selection, stepwise backward elimination, or a combi-nation of both.
One way to find either the best or worst attribute is to perform experiments with a selected classifier. The classifier’s performance is then compared to the previous best performances. A decrease in performance is an indication of the lack of an important feature. If the performance remains unchanged, or increases after adding a feature, it is an indication that the observed feature is unimportant or irrelevant.
We can also rank features according to their im-portance. This helps to determine irrelevant or less significant attributes, which can then be deleted first. But it needs to be considered that ranking assumes at-tribute independence and, therefore, neglects possible interactions between features.
A typical evaluation measure suitable for ranking is information gain. Information gain is the underly-ing statistical property of feature evaluation used by decision trees. An observed feature with the highest information gain is considered to be the most effective for classifying presented data for a given class.
Decision tree classifiers, such as C4.5, are them-selves also well-suited to attribute selection. In the tree-like structure constructed by the learning algo-rithm, every node represents a test of an attribute. Attributes that the algorithm assumes are irrelevant are not part of the tree. In most cases, the attributes used already represent a reduced subset.
Additionally, the selected attributes are in a hier-archical order. The attribute tested by the node at the root of the tree is considered to be that which best partitions the data into classes. The attributes tested by the nodes in the last layer prior to the leaves are considered to be the worst attributes.
Furthermore, it is advisable to use domain knowl-edge for feature selection. Domain knowlknowl-edge can be provided by an expert in order to remove unimportant features. An investigation of the provided data can reveal non-changing values of features or that noise and outliers devalue the quality of certain features. Human experts can also exclude features that are known to be irrelevant or that are prone to false correlations.
For feature reduction, a custom-built training set with 10,422 instances and the original ‘10%’ KDD Cup ’99 training set was used. For testing, 10-fold cross-validation was applied or alternatively the original KDD Cup ’99 test set was used.
The custom training set was extracted from the full KDD Cup ’99 dataset to optimise training performance. One aim was to improve the attack distribution in favour of rare attack traffic patterns. The dataset contains 10,422 connection records, including all 41 features. It was sampled and randomised from up to
1,000 samples out of the 23 traffic types contained in the full dataset. All features were preprocessed as described in the previous section using our custom preprocessing scripts.
The WEKA data mining suite was applied for data visualisation and classification. WEKA provides a large number of different machine learning algorithms (see Witten and Frank [26]). For classification, the C4.5 decision tree algorithm (in WEKA specified as J4.8), na¨ıve Bayes, Bayesian networks, standard back-propagation with a multilayer perceptron feed-forward neural network (MLP) and support vector machines (SVM, in WEKA specified as SMO) were applied to the DARPA/KDD Cup ’99 training data. All classi-fiers were run with WEKA’s default parameters, unless explicitly stated otherwise.
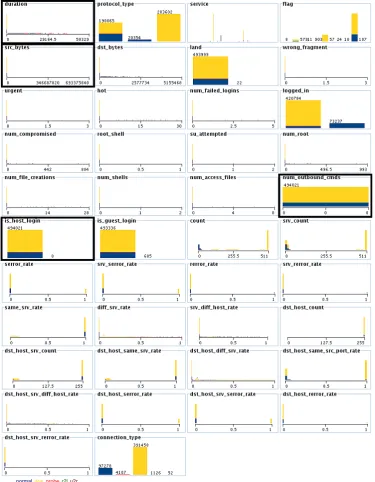
The distributions of the five different traffic classes in the training data were visualised using distribution histograms and scatter plots. It is to be noted that the resulting features do not necessary provide a com-prehensive overview of important features. Features with an obvious correlation might be missing, due to too unfavourable distributions in the dataset. For the same reason features might be considered as important that do not have an correlation with the traffic class observed.
5.1
Distribution Histograms
First and foremost, the distribution of features in the data was investigated by visualisation using histograms. In a distribution histogram, the value of the feature is plotted against how often the value exists in the data. In the histograms, outliers and skewed distributions are easily detected. This gives valuable advice on necessary preprocessing steps, such as data cleaning and neces-sary data transformations. After preprocessing the data, the histograms can reveal obvious correlations between features and target classes. The distribution histograms have been proven very valuable for deciding on and optimising the necessary preprocessing steps.
The investigation of the original training data using distribution histograms, shown in Figure 1, revealed that the features ‘num outbound cmds’ and ‘is host -login’ have no variance at all in the training data. They always have a zero value, and so do not pro-vide any information. These were removed from all datasets. The features ‘duration’, ‘src bytes’ and ‘dst -bytes’ have strongly biased distributions. Furthermore, these features contain, in comparison to their average values, some huge outliers. Connections longer than 30,000 sec. (8 h 20 m) and larger than three megabytes were threshold to this maximum value. Also for these three features, the natural logarithm was applied to all values.
Further investigation shows that some correlations between individual features and the ‘dos’ attack target class. The features 2–8, 23–26, 29–31, 33, 34 and 38–41 seem to correlate with DoS attacks.
normaldosprober2lu2r
to visually attract attention. This was addressed by using the custom-built dataset with 10,422 instances. This dataset holds a far more favourable distribution for visually investigating these rare attack types. The corresponding histogram reveals that:
DoS attacks and network probes correlate with the features 2, 4, 23–29, 33, 35, 38 and 41; network probes correlate with the features 3–5, 25, 29–31, 33–38 and 40; the features 1, 3, 5, 9–11, 15–17, 19, 22 and 37 correlate with ‘r2l’ attacks; and the features 9, 11, 14 and 16–19 correlate with ‘u2r’ attacks.
5.2
Scatter Plots
Another applied data visualisation method that reveals relationships between investigated features are scatter plots. A scatter plot is a plot of two variables against each other. A scatter plot matrix shows all pairwise scatter plots on a single page. Relationships between variables can be identified by a non-random distribu-tion of the points in the plot. Furthermore, scatter plots show the presence of outliers.
Each scatter plot provides information about the strength, shape and direction of the relationship be-tween two features. The more points are clustered along a line, the stronger is the relationship between the observed variables. The relationship is positive if the line goes from lower-left to upper-right, and nega-tive when contrariwise. The shape of the line can be linear or curved, a curve usually being quadratic or exponential.
Scatter plot matrices were build from the remaining features after removal of features with low information gain and decision tree pruning. Feature pairs showing strong correlations in the scatter plots were considered as candidates for further removal.
5.3
Decision Tree Pruning
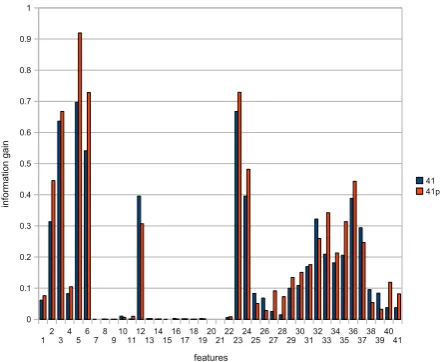
Prior to applying feature selection using decision trees, information gain for the original ‘10%’ KDD Cup ’99 training data and the training data after preprocessing was compared. The results, shown in Figure 2, confirm that the majority of features actually benefit from the preprocessing steps. The strongest beneficiaries are the features ‘src bytes’ and ‘dst bytes’. Only few features suffered slightly from normalisation. An overview of all features is presented in Table 1.
The first six basic features all improve as a result of feature preprocessing. The strongest beneficiaries are the features ‘src bytes’ and ‘dst bytes’, where the outliers were removed and the distribution was im-proved by applying the natural logarithm. Applying effects coding to the ‘protocol type’ feature also had a strong positive impact. The other three basic features, ‘land’, ‘wrong fragment’ and ‘urgent’, and most of the following content features, are of low significance for the majority of the connection records. Exceptions are the features ‘hot’, ‘num failed logins’, ‘logged in’, and ‘is guest login’.
The time-based and connection-based features all show information gain significance for the classification
Figure 2: Comparison of information gain of all fea-tures in the original and the preprocessed KDD Cup ’99 ‘10%’ training data. An overview of the features is shown in Table 1. The strongest beneficiaries are the features ‘src bytes’ and ‘dst bytes’. Some features also suffered slightly from normalisation.
of the data. The features 23–24, 27–32, 34–36 and 40– 41 even show improved significance after normalisation. In terms of information gain, the features 10, 12, 16, 19, 25–26, 32 and 37–39 suffered slightly from nor-malisation. But since this transformation was lossless, any significant negative impact on classification was not expected.
Feature selection was done by building and exam-ining post-pruned decision trees. The applied J4.8 decision tree algorithm implements subtree raising as a pruning operation. In subtree raising, the decision tree algorithm moves nodes up towards the root of the tree and discards other nodes on the way.
After the first build from the training set using all features, features from the dataset were removed that were not part of the tree. Leave-one-out reduction was continued until the removal of any feature led to significant performance loss in any of the five applied classifiers. True positive rate, false positive rate, pre-cision, accuracy and costs were used as performance metrics in each traffic class. The ROC curve was fe-quently estimated and the area under curve (AUC) value calculated using the Mann Whitney statistic. All values, except costs, were provided by WEKA. Costs were manually calculated using the suggested values provided by the KDD Cup ’99.
To limit the number of iterations, the leave-one-out approach was biased. By default, features close to the root of the tree were kept, and features close to or at leaves were removed one-by-one. The removal of features that require domain knowledge or detailed traffic data analysis to features easily extracted from network data was prefered. The classification and run-time performance of the five applied classifiers was frequently observed.
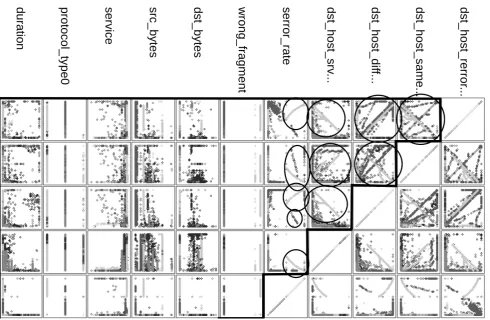
at-Figure 3: This shows the upper half of the scatter plot matrix of the 11 features in the custom training set with 10,422 instances. The features labelled from left to right are 1–5, 8, 25, 33, 35, 36 and 40, and from top to bottom are 40, 36, 35, 33 and 25.
tribute of the best-performing subset was declared as an unimportant attribute. The performance of the final minimal feature set was tested against the KDD Cup ’99 test set.
The applied feature selection algorithm, based on decision tree pruning and backward elimination, can be summarised as follows:
1. Construct a decision tree from all given training data using the fullmattributes set.
2. If all attributes are not used to construct the tree,
(a) mark the unused attributes as irrelevant at-tributesai, and
(b) construct a new set withm=m−aiattributes.
3. Build trees for all possible subsets with m−1 attributes.
4. If at least one subset is found with improved or comparable performance,
(a) mark the removed attribute of the best-performing subset as unimportant attributeau, and
(b) construct a new set withm=m−auattributes.
5. Until all subset trees withm−1 attributes have a significant performance loss,
continue with 3.
6. Test found minimal feature set against training set and test set.
6
EXPERIMENTS AND RESULTS
In this section, we present a number of minimal feature sets for detecting all attacks and individual attacks, using one classifier training with very few features.
6.1
Minimal Sets for All Attacks
Two different approaches were followed in order to find minimal sets for detecting all attacks with one trained classifier. The aim of the first approach was to extract a reduced feature set with few, if any, content features. All tested classifiers should at least maintain their performance on the reduced dataset in comparison to using all features. Only short overview of the results of the first approach is given since the resulting 11 feature set was previously published in Staudemeyer and Omlin [11]. All other results presented are novel contributions.
In the second approach is to feature reduction essential minimal features were searched, which could still compete with the well-performing classifiers of the KDD Cup ’99 challenge. This time, only the results of the best-performing classifier were considered.
6.1.1 The 11 Feature Minimal Set
were 1-3, 5, 6 and 8. Chosen higher-level features were 25, 33, 35, 36 and 40.
The scatter plot matrix in Figure 3 shows that there are strong correlations between the 5 selected higher-level features. The group of relevant scatter plots are framed with a black line starting from the upper left corner. Interesting is the clustering of data points along a line in the scatter plots of the five higher level features. The areas are highlighted with a circle. The clustering indicates strong correlations for ‘dos’ and ‘probe’ attacks between these features. This is due to the fact that not all of these 5 features are essential for all five traffic classes. The strong correlations relate to ‘dos’ and ‘probe’ attacks, which both generate large numbers of connection records per attack.
The correlations are shown by the diagonal clus-tering of data points along a line in the scatter plots between these features. At least for some attacks within these two classes, not all selected higher-level features are essential. For the remaining traffic types, there are no strong relationships affecting a noticeable number of connection records between the selected features.
6.1.2 The 8 and 4 Feature Minimal Sets
The exhaustive, feature-by-feature reduction of the second approach led to 8 important features, in which the 4 most important minimal features were identified. The 4 features are 3, 5, 35 and 40.
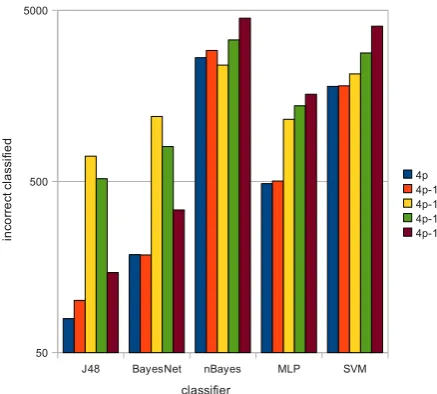
The corresponding ‘4-1’ histogram in Figure 4 shows that, in terms of misclassification, any further feature removal leads to a significant degradation of performance on the non-statistical classifiers. For train-ing, the custom training set was used, and for testtrain-ing, 10-fold cross-validation was applied.
6.2
Minimal Sets for Individual Attacks
The preprocessed ‘10%’ training dataset and the testing dataset were split into four sets, each containing all normal traffic, but only one out of the four attack traffic types (‘probe’, ‘dos’ , ‘r2l’, ‘u2r’ ). For each attack, pruned decision trees were build containing only the most relevant features.
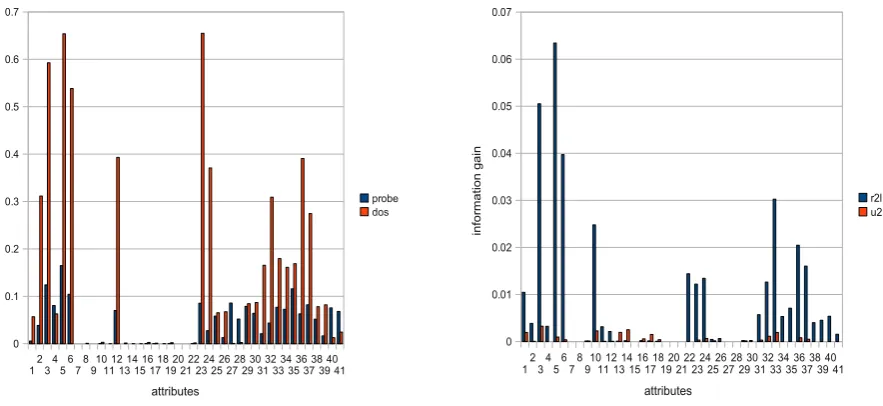
Figure 5 shows the information gain for all four attacks traffic types for all features in the preprocessed KDD Cup ’99 ‘10%’ training data. This allows us a more detailed individual analysis of the preprocessed features for each attack class.
In terms of information gain, the figures show that many attributes are not suitable for classifying all four different attack types. For network probes and ‘dos’ attacks, the first 6 basic features and most of the time- and host-based features are relevant. With the exception of the ‘logged in’ feature, content features for these attacks are of very low relevance.
For ‘r2l’ and ‘u2r’ attacks, it is noticeable that, due to the nature of these attacks, some of the relevant features are content features. The first 6 basic features and all host-based features are significant for ‘r2l’ at-tacks. Additionally, the 4 content features 10–12 and
Figure 4: Performance degradation of the 4 minimal feature dataset, removing any of the features. The minimal features are 3, 5, 35 and 40. For classifica-tion, the C4.5 decision tree algorithm, naive Bayes, Bayesian networks, standard backpropagation with a multilayer perceptron feed-forward neural network (MLP) and support vector machines were applied to
the DARPA/KDD Cup 99 training data.
22; and the 3 time-based features 23, 24 and 31, are also significant.
For ‘u2r’ attacks all features are, if any, of very low relevance. The 10 features with the highest information gain in descending order are 3, 14, 10, 13, 1, 33, 17, 32, 5 and 36.
First, all features with no or very little information gain were removed. Examples are the ‘land’ and the ‘su attempted’ features, which are of very low relevance for any attack. Then, pruned decision trees were build and all features that were not part of the pruned tree were discarded. From this set of remaining features, a scatter plot matrix was generated to visualise the remaining relationships between the features and deci-sion tree feature reduction algorithm was continued as described.
This process was applied to the datasets of each at-tack type, in order to further reduce the redundancies, until a minimal set with approximately 4–6 features was reached, where further feature removal leads to significant performance loss.
6.2.1 Detecting DoS Attacks
For ‘dos’ attacks, the features ‘land’ and ‘urgent’ were removed due to their lack of information gain. After tree pruning, the remaining 11 features are 3–6, 8, 23, 29, 36 and 38-40. The scatter plot matrix of the important features show that there are still strong correlations between some higher-level features.
Figure 5: Information gain of network probes, DoS, ‘r2l’ and ‘u2r’ attacks, observing all features in the preprocessed KDD Cup ’99 ‘10%’ training data.
The ‘5-1’ histogram shown in Figure 6b, using the ‘10%’ training set with 10-fold cross-validation, shows that the removal of any feature leads to performance loss. The histogram also shows that, just as for network probes, the feature ‘src bytes’ is the most important feature for the classification of ‘dos’ attacks. The best performing classifier (feed-forward neural network) achieved 98.12% accuracy and an outstanding AUC value of 0.979, with 1 representing perfect separation and 0.5 random guessing.
Another well-performing subset contains the fea-tures 3, 4, 29, 36, 38 and 39. A 4 feature subset, with an only slightly poorer performance, contains the features 3–5 and 23.
6.2.2 Detecting Network Probes
Observing information gain for features in the network ‘probe’ dataset, the features 7–9, 11, 13–15 and 18 were removed, because they do not contribute to the classification of network probes. After building the pruned decision tree, the remaining ‘14’ features are 2–6, 12, 29, 32–37 and 40.
These ‘14’ features are visualised in the scatter plot matrix shows that some of the higher-level features still have strong correlations, which confirms the potential for further feature reduction. After feature reduction, the remaining 6 minimal features are 2, 5, 29 and 33– 35. Observing the scatter plots between these minimal features, very few correlations affecting only a small number of connection records exist.
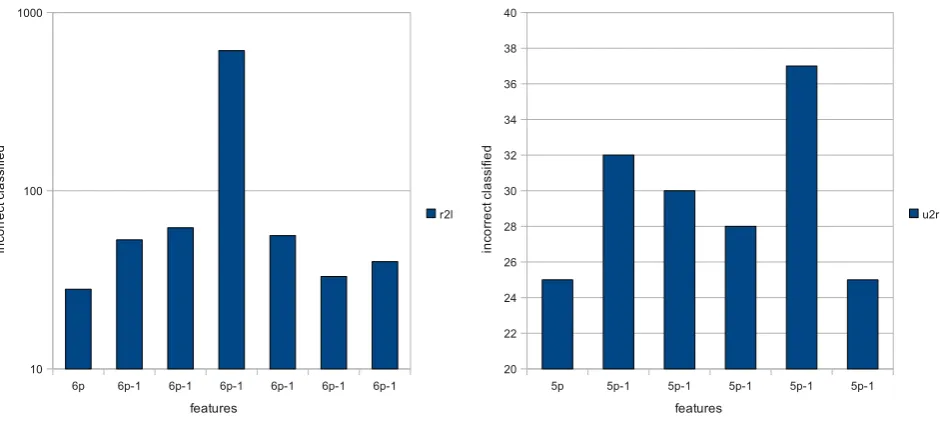
Furthermore, the ‘6-1’ histogram in Figure 6a shows that any further removal of features leads to performance degradation. The feature ‘src bytes’ is the most important for successful classification of this traffic class, and its removal causes the most significant increase of misclassification errors. For the histogram, the ‘10%’ training set with 10-fold cross-valuation was used. Again the feed-forward neural network showed
to be the an well-performing classifier on the minimal feature set. The best performing network achieved 98.81% accuracy and an outstanding AUC value of 0.997.
Another well-performing set for probe attacks containing only 2 features is that of ‘src bytes’ and ‘dst -host same srv rate’.
6.2.3 Detecting ‘r2l’ Attacks
For ‘r2l’ attacks, the features 7, 8, 15, 19, 27 and 28 have no information gain and can be discarded. The 18 features remaining after pruning are 1-3, 5, 6, 10, 12, 14, 16, 24, 32, 33, 35–39 and 41.
Due to absence of enough computing resources for an exhaustive search of this rather large set of 18 fea-ture candidates, the feafea-tures 2, 12, 14 and 16 were removed. These features have very low information gain for ‘r2l’ attacks, and which were, therefore, consid-ered as least relevant. Again, the scatter plot matrix of the remaining ‘14’ features reveals that some of the scatter plots between higher-level features have strong correlations.
After feature reduction, the 6 remaining minimal features are 1, 3, 5, 10, 24 and 33. The scatter plots between these 6 features do not show strong correla-tions. The ‘6-1’ histogram is shown in Figure 6c. This shows once again that ‘src bytes’ is the most impor-tant feature. Another well-performing minimal set of 6 features is 3, 5, 10, 24, 33 and 38.
Good results were achieved on the 6 minimal fea-ture set using the decision tree classifier with 79.45 accuracy with close to no performance degradation. Best results were on the 14 feature set with 80.62% accuracy.
6.2.4 Detecting ‘u2r’ Attacks
34, 35 and 38–41. Pruning reduces the features to 8, being 3, 5, 6, 10, 14, 17, 32 and 33. Observing the corresponding scatter plot matrix do not reveal any salient correlations, which might be related to the fact that few examples are available.
After feature reduction, the remaining minimal set containing the 5 minimal features for most detectable ‘u2r’ attacks are 5, 6, 10, 17 and 33. Figure 6d shows the ‘51’ histogram; it shows that the feature ‘num -file creations’ is the most important.
Like with DoS attacks and networks probes the simple feed-forward neural network classifier showed good performance on the minimal feature set. The best-performing network showed 99.92% accuracy and an AUC value of 0.984.
7
CONCLUSIONS
This paper investigates the potential to reduce the number of features used for classifying traffic classes. This approach started with preprocessing all features using the custom feature preprocessing framework pre-sented.
Foremost features with very little variance in the training data were removed from all datasets. For con-tinuous features, outliers were removed, normalisation was applied, and, if necessary, logarithmic scaling was performed. For nominal features, least-first ranking and effects coding was applied. Finally the target fea-tures were mapped to a traffic class, as suggested in the KDD Cup ’99 challenge.
The distributions of all features were visualised, with the calculation of information gain for each feature. This already gives a supportive, but not comprehen-sive, overview of important feature candidates. The distribution histograms and information gain of most features showed significant improvements after prepro-cessing. Using a custom training set with preprocessed instances selected also helped to visualise the distribu-tions for traffic classes with only a few instances in the original data.
The features for all traffic classes were successfully reduced with a feature selection approach based on decision tree pruning and domain knowledge. Minimal sets for the multi-class categorisation of all five classes (including normal traffic) with 11, 8 and 4 features were presented. For the individual attack classes for extracted minimal sets with 6, 5, 6 and 5 features for ‘probe’, ‘dos’, ‘r2l’ and ‘u2r’ attacks respectively.
In the ‘X-1’ histograms, any further feature re-moval leads to significant performance degradation of at least one classifier. The feature relationships of all selected features were visualised with scatter plot matrices, using our training set with instances selected. The plots reveal that very few correlations remain between the selected features.
These results show that a large number of the fea-tures evaluated are, in fact, redundant or, at least, unimportant. The number of features were drastically reduced from the initial 41 down to 4–8 minimal fea-tures for each attack class observed. An important
side-effect is that this extensive feature reduction signif-icantly decreases the computational resources required for training the classifier.
We expect our results to generalise on similar datasets. In future work we will refine the feature reduction process and apply it to recent intrusion de-tection data.
REFERENCES
[1] C. Elkan. “Results of the KDD’99 classifier learn-ing”. SIGKDD Explorations Newsletter, vol. 1, pp. 63–64, 2000.
[2] J. R. Quinlan. C4.5: programs for machine learn-ing. Morgan Kaufmann Publishers Inc., 1993. ISBN 1-55860-238-0.
[3] M. Sabhnani and G. Serpen. “Application of machine learning algorithms to KDD intrusion de-tection dataset within misuse dede-tection context”. InInternational Conference on Machine Learning, Models, Technologies and Applications (MLMTA), pp. 209–215. CSREA Press, 2003.
[4] S. Sung, A.H. Mukkamala. “Identifying impor-tant features for intrusion detection using support vector machines and neural networks”. In Proceed-ings of the Symposium on Applications and the Internet (SAINT), pp. 209–216. IEEE Computer Society, 2003.
[5] S. Chavan, K. Shah, N. Dave, S. Mukherjee, A. Abraham and S. Sanyal. “Adaptive neuro-fuzzy intrusion detection systems”. InProceedings of the International Conference on Information Technol-ogy: Coding and Computing (ITCC), vol. 1, pp. 70–74. IEEE Computer Society, 2004.
[6] S. Peddabachigari, A. Abraham, C. Grosan and J. Thomas. “Modeling intrusion detection system using hybrid intelligent systems”. Journal of net-work and computer applications, vol. 30, no. 1, pp. 114–132, 2007.
[7] H. Kayacik, A. Zincir-Heywood and M. Heywood. “Selecting features for intrusion detection: A fea-ture relevance analysis on KDD 99 intrusion detec-tion datasets”. InProceedings of the Third Annual Conference on Privacy, Security and Trust (PST). 2005.
[8] C. Lee, S. Shin and J. Chung. “Network intrusion detection through genetic feature selection”. In
Seventh ACIS International Conference on Soft-ware Engineering, Artificial Intelligence, Network-ing, and Parallel/Distributed Computing (SNPD), pp. 109–114. IEEE Computer Society, 2006. [9] S. Chebrolu, A. Abraham and J. Thomas.
“Fea-ture deduction and ensemble design of intrusion detection systems”.Computers & Security, vol. 24, no. 4, pp. 295–307, 2005.
[11] R. Staudemeyer and C. Omlin. “Feature set re-duction for automatic network intrusion detection with machine learning algorithms”. InProceedings of the Southern African Telecommunication Net-works and Applications Conference (SATNAC). 2009.
[12] S. Lakhina, S. Joseph and B. Verma. “Feature re-duction using principal component analysis for ef-fective anomalybased intrusion detection on NSL-KDD”. International Journal of Engineering Sci-ence and Technology, vol. 2, no. 6, pp. 1790–1799, 2010.
[13] M. Tavallaee, E. Bagheri, W. Lu and A. A. Ghor-bani. “A detailed analysis of the KDD CUP 99 data set”. In 2009 IEEE Symposium on Com-putational Intelligence for Security and Defense Applications, Cisda, pp. 1–6. IEEE, Jul. 2009. ISBN 978-1-4244-3763-4.
[14] A. Olusola, A. Oladele and D. Abosede. “Analysis of KDD’99 Intrusion Detection Dataset for Selec-tion of Relevance Features”. InProceedings of the World Congress on Engineering and Computer
Science, vol. I. 2010. ISBN 9789881701206. [15] V. Bol´on-Canedo, N. S´anchez-Maro˜no and
a. Alonso-Betanzos. “Feature selection and classi-fication in multiple class datasets: An application to KDD Cup 99 dataset”. Expert Systems with Applications, vol. 38, no. 5, pp. 5947–5957, May 2011. ISSN 09574174.
[16] W. Lee. A data mining framework for construct-ing features and models for intrusion detection systems. Ph.D. thesis, USA: Columbia University, 1999.
[17] W. Lee and S. Stolfo. “A framework for construct-ing features and models for intrusion detection systems”. Transactions on Information and Sys-tem Security (TISSEC), vol. 3, no. 4, pp. 227–261, 2000.
[18] S. Hettich and S. Bay. “KDD Cup 1999 Data, The UCI KDD Archive, Information and Computer Science, University of California, Irvine”. World Wide Web electronic publication, October 1999. [19] V. Paxson. “Bro: A system for detecting
net-work intruders in real-time”. Computer Networks, vol. 31, no. 23, pp. 2435–2463, 1999.
[20] J. McHugh. “Testing intrusion detection systems: A critique of the 1998 and 1999 DARPA intru-sion detection system evaluations as performed by Lincoln Laboratory”. ACM Transactions on Information and System Security, vol. 3, no. 4, pp. 262–294, 2000.
[21] M. Mahoney and P. Chan. “An analysis of the 1999 DARPA/Lincoln Laboratory evaluation data for network anomaly detection”. In Recent Ad-vances in Intrusion Detection, vol. 2820 ofLecture Notes in Computer Science, pp. 220–237. Springer Berlin / Heidelberg, 2003.
[22] M. Sabhnani and G. Serpen. “Why machine learn-ing algorithms fail in misuse detection on KDD intrusion detection data set”. Intelligent Data Analysis, vol. 8, no. 4, pp. 403–415, 2004.
[23] S. Brugger and J. Chow. “An assessment of the DARPA IDS evaluation dataset using snort”. Tech. Rep. CSE-2007-1, Department of Com-puter Science, University of California, Davis (UC-DAVIS), 2005.
[24] M. Roesch. “Snort–lightweight intrusion detection for networks”. InProceedings of the 13th USENIX conference on System administration, pp. 229–238. Seattle, Washington, 1999.
[25] M. Dash and H. Liu. “Feature selection for clas-sification”. Intelligent Data Analysis, vol. 1, no. 1-4, pp. 131–156, 1997.
(a) ‘6-1’ histogram of minimal features for network probes (b) ‘5-1’ histogram of minimal features for ‘dos’ attacks
(c) ‘6-1’ histogram of minimal features for ‘r2l’ attacks (d) ‘5-1’ histogram of the minimal features for ‘u2r’ attacks