89
METHOD DEVELOPMENT AND VALIDATION OF RP-HPLC
METHOD FOR DETERMINATION OF NEW ANTIPSYCHOTIC
AGENT RASAGILINE IN BULK AND IN PHARMACEUTICAL
FORMULATION
Suresh Kumar Nanubala* and Jayachandra Reddy P
Department of Pharmaceutical Analysis, Krishna Teja Pharmacy College, Chadalawada Nagar, Tirupati, Andhra Pradesh – 517 501, India.
ABSTRACT
A simple, precise, rapid, reproducible, accurate and stability indicating reverse phase HPLC method has been developed for the determination of new antipsychotic agent Rasagiline in bulk and in pharmaceutical formulation. An enable develosil ODS mg-5, C18, 150x4.6mm, I.D- 5µm particle size column was used with variable wavelength UV detector. The mobile phase consisting of pH 7.0 Buffer and Acetonitrile in the ratio of 60:40V/V was used. The flow rate was 1ml/min and the effluent was monitored at 210nm. The retention time of the drug was 4.306 minutes. The method was linear over the concentration range of 0.5-150µg/ml. the method precision for the determination of assay was below 2% RSD. The percentage recovery of Rasagiline was 98.2 – 102.1%. The validation of method was carried out utilizing ICH guidelines.
Keywords: Rasagiline, RP- HPLC, Development, Validation, Rasagiline tablets.
INTRODUCTION
Rasagiline (1-11) is an irreversible inhibitor of monoamine oxidase used as a monotherapy in early Parkinson's disease or as an adjunct therapy in more advanced cases [1-5]. It is selective for MAO type B over type A by a factor of fourteen. It was developed by Teva euroscience, initially investigated by Prof. Moussa Youdim and Prof. John Finberg of the Faculty of Medicine, Technion – Israel Institute of Technology. Parkinson's disease is caused by the progressive impairment or deterioration of neurons (nerve cells) in an area of the brain known as the substantia nigra. When functioning normally, these neurons produce a vital brain chemical known as dopamine. Dopamine serves as a chemical messenger allowing communication between the substantia nigra and another area of the brain called the corpus striatum [6-9].
Rasagiline mesylate is a chemical inhibitor of the enzyme monoamine oxidase type-B which has a major role in the inactivation of biogenic and diet-derived
amines in the central nervous system. Rasagiline is a propargylamine-based drug indicated for the treatment of idiopathic Parkinson's disease. It is designated chemically as: 1H-Inden-1-amine, 2, 3-dihydro-N-2-propynyl-, (1R)-, methanesulfonate.
The empirical formula of rasagiline mesylate is (C12H13N) CH4SO3 and its molecular weight is 267.34. Rasagiline is freely soluble in water and ethanol and sparingly soluble in isopropyl alcohol. It is a chiral compound with one asymmetric carbon atom in a five member ring with an absolute with R-configuration which is produced as single enantiomer [10-11].
Figure 1. Chemical structure of Rasagiline mesylate
Corresponding Author: - N Suresh Kumar Email: [email protected]
International Journal of
Medicinal Chemistry & Analysis
www.ijmca.com
e ISSN 2249 - 7587
90
It is not official in any pharmacopoeia and till now, few liquid chromatographic (LC) procedures have been Reported for the determination of Rasagiline and its metabolites in biological fluids. However, there are limited publications on the LC analysis of Rasagiline in bulk and pharmaceutical dosage forms7-20. Hence, an LC rocedure was developed to serve as a rapid and reliable method for the determination of Rasagiline bulk and pharmaceutical dosage forms. In the proposed method, well separated and eluted with in 8 min. Finally the method was thoroughly validated for the assay of Rasagiline mesylate Tablets [12, 13].
MATERIALS AND METHODS Table 1. Instrumentation
Equipment Configuration/Model Make
HPLC
Detector – DWD-2487 Injector – Rheodyne
Empower software
WATERS
Column C18, 150x4.6mm, 5µm Develosil ODS MG-5 Precision
balances D – 4323 10040 Shimadzu
pH meter LI/613 Elico
Sonicator --- Spino tech
Table 2. Reagents and Chemicals
Chemicals Manufacturers Grade
Methanol Qualigens HPLC
potassium dihydrogen orthophosphate
anhydrous
Merck HPLC
Sodium hydroxide Merck HPLC
Acetonitrile (ACN) Merck HPLC
Milli Q Water Milli Q HPLC
Table 3. Chromatographic parameter
Instrument Waters HPLC
Column Develosil ODS MG-5 C18,
150x4.6mm, 5µm
Wavelength 210nm
Column Temperature 40oC
Flow rate 1.0 ml / min
Injection volume 20 μl
Mobile phase Buffer : Acetonitrile (60:40)
Preparation of Mobile Phase
Mix 600 ml of above buffer and 400 ml of Acetonitrile and degas by filtering through 0.45 membranes.
Diluent
pH 7.0 buffer and acetonitrile mixed in the ratio 1:1(v/v) mixed well and filtered through 0.45μm nylon membrane filter.
Determination of retention time
Preparation of Rasagline standard solution
Weigh accurately about 79mg of Rasagiline working standard was transferred in to a 100 mL volumetric flask and to that 70 ml of diluent was added and sonicated to dissolve and diluted to volume with the diluent. Further 5 mL of the resulting solution was taken into 25 mL volumetric flask and made up to volume with the diluent. Solution was filtered through 0.45μm nylon membrane filter.. 20μl of this solution was injected and chromatogram was recorded.
Test Solution
The number of tablets equivalent to 10 mg of Rasagiline were weighed and transferred in to a 100 mL volumetric flask and about 70 ml of the diluent was added and swirled the flask to disintegrate, sonicated for 20 min and diluted to the volume with the diluent. The solution was filtered through 0.45μm nylon membrane filter prior to use.and 20μl of this solution was injected and chromatographic conditions described above and chromatogram recorded.
Amount of drug in each injection of Rasagline
Spl. Area Std dilution Potency = x x x 100
Std Area Spl dilution 100
Acceptance criteria: 90-100% w/w
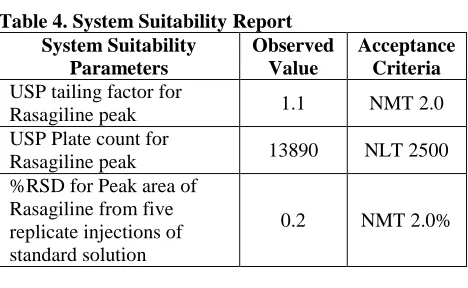
Table 4. System Suitability Report System Suitability
Parameters
Observed Value
Acceptance Criteria
USP tailing factor for
Rasagiline peak 1.1 NMT 2.0
USP Plate count for
Rasagiline peak 13890 NLT 2500
%RSD for Peak area of Rasagiline from five replicate injections of standard solution
0.2 NMT 2.0%
VALIDATION [14-23]
Validation of analytical method for the assay of Rasagiline
Validation of analytical method is a process to establish that the performance characteristics of the developed method meet the requirement of the intended analytical application.
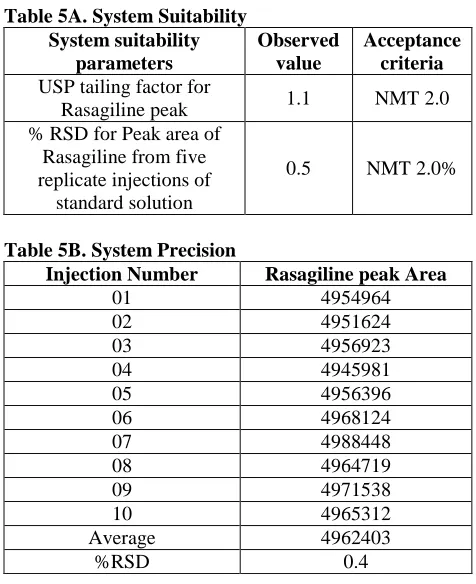
1. System Precision and System Suitability
91
in limits. The RSD for peak areas of ten replicate injections of standard was found to be 0.4% for Rasagiline peak. The results are summarized in Table 5A & 5B.
Table 5A. System Suitability System suitability
parameters
Observed value
Acceptance criteria
USP tailing factor for
Rasagiline peak 1.1 NMT 2.0
% RSD for Peak area of Rasagiline from five replicate injections of standard solution
0.5 NMT 2.0%
Table 5B. System Precision
Injection Number Rasagiline peak Area
01 4954964
02 4951624
03 4956923
04 4945981
05 4956396
06 4968124
07 4988448
08 4964719
09 4971538
10 4965312
Average 4962403
%RSD 0.4
2. Specificity
a) Placebo Interference
A study to establish the interference of placebo was conducted. Assay was performed on Placebo in triplicate equivalent to about the weight of placebo in portion of test preparation as per test method. Chromatograms of placebo solutions showed no peaks at the retention time of Rasagiline peak. This indicates that the excipients used in the formulation do not interfere in estimation of Rasagiline in Rasagiline Tablets. The results are summarized in Table 6.
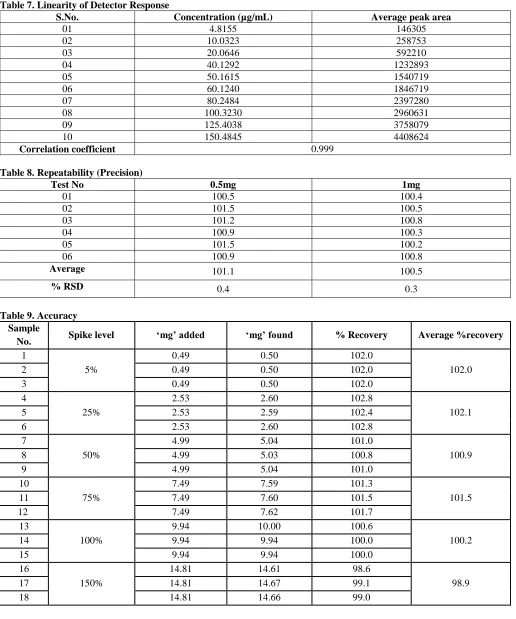
3. Linearity of Detector Response
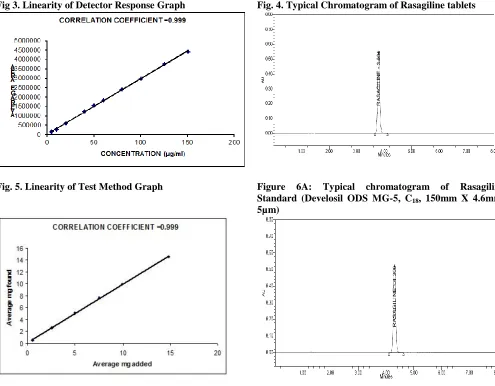
Linearity of detector response was established by plotting a graph to concentration versus average area and determining the correlation coefficient. A series of solutions of Rasagiline standard were prepared in the concentration range of about 4.8 μg/ml to 150.5 μg/ml on X-axis versus response on Y-axis. The detector response was found to be linear with a correlation coefficient of 0.999.The results are summarized in Table 7.
4. Precision of Test Method Repeatability
The precision of test method was conducted for 1mg tablets individually by assaying six samples of
Rasagiline tablets. The average % assay of Rasagiline in Rasagiline tablets was found to be 100.5% with a RSD of 0.3% for 1mg strength. The results were summarized in Table 8.
5. Accuracy
The study of recovery of Rasagiline from spiked placebo was conducted. Samples were prepared by mixing placebo with Rasagiline raw material equivalent to about 5%, 25%, 50%, 75%, 100%and 150% of the target concentration of Rasagiline Tablets 1mg. Sample solutions were prepared in triplicate for each spike level and assayed as per test method. The percentage recovery was found to be within limits. The results are summarized in Table 9.
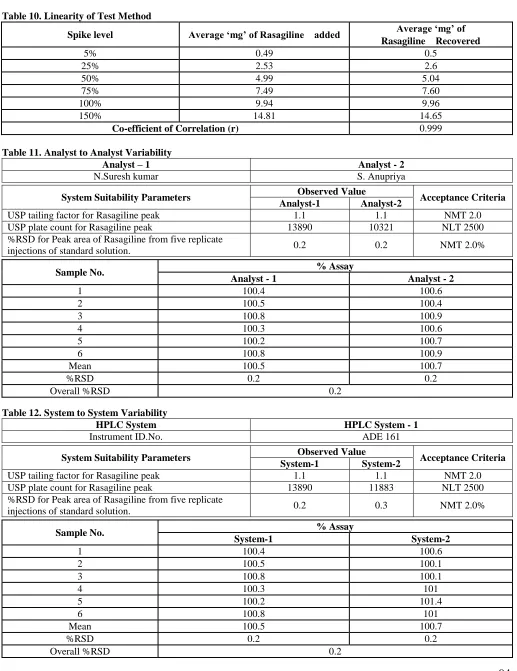
6. Linearity of Test Method
A graph is plotted to ‘average mg of Rasagiline added’ versus ‘average mg of Rasagiline recovered’ in Accuracy (Recovery) section. The correlation coefficient was found to be 0.999. From the above study, it was established that the method is linear from 5% to 150% of the target concentration shown in Table 10 and Figure 5.
7. Ruggedness
a) Analyst to Analyst Variability
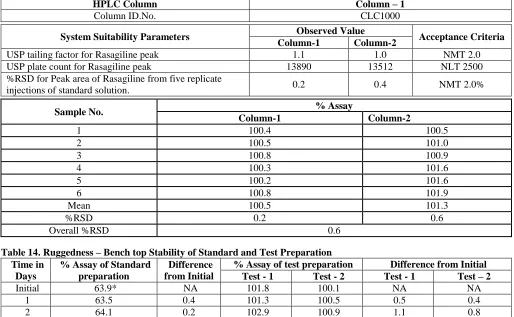
Analyst to analyst variability study was conducted by two analysts by assaying six different test preparations of Rasagiline Tablets 10 mg. The average % assay obtained by both the analysts was found to be 100.5% and 100.7% with a relative standard deviation of 0.2% and 0.2 % respectively. The system suitability parameters were evaluated as per the test method by both the analysts and found to be with in the limits. The results are summarized in Table 11. Comparison of results obtained by both the analysts’ shows that the assay method is meeting intermediate precision acceptance criteria.
SYstem to System Variability
System to system variability study was conducted by two system by assaying six different test preparations of Rasagiline Tablets 1 mg. The average % assay obtained by both the system was found to be 100.5% and 100.7% with a relative standard deviation of 0.2%and 0.2 % respectively. The system suitability parameters were evaluated as per the test method by both the system and found to be within the limits. The results are summarized in Table 12. Comparison of results obtained by both the analysts’ shows that the assay method is meeting intermediate precision acceptance criteria.
Column to Column Variability
92
assay obtained by both the system was found to be 100.5% and 101.3% with a relative standard deviation of 0.2% and 0.6% respectively. The system suitability parameters were evaluated as per the test method by both the system and found to be with in the limits. The results are summarized in Table 13. Comparison of results obtained by both the analysts’ shows that the assay method is meeting intermediate precision acceptance criteria.
b) Bench Top Stability of Test Preparation and Standard Preparation
A study to establish the stability of Rasagiline in test preparation and standard preparation on bench top was conducted at initial, 1 day and 2 days. The assay of Rasagiline in test preparation and standard preparation were estimated against freshly prepared standard each time. The difference in % assay of Standard and Test preparations from initial to 1 day and 2 days was calculated and the results are summarized in Table 14. From the above study, it was established that the test preparation and the standard preparations are stable for a period of 2 days on bench top.
C) Refrigerator Stability of Test Preparation and Standard Preparation
A study to establish the stability of Rasagiline in test preparation and standard preparation in refrigerator was conducted over a period of 2 days. The % assay of Rasagiline in test preparation and standard preparation was estimated at initial, 1 day, 2 days against freshly prepared standard at each time. The difference in % assay of standard and test preparations from initial to 1 day and 2 days were found to be within the limits. The results are summarized in Table 15. From the above study, it was established that the test preparation and standard preparation are stable for a period of 2 days in the refrigerator.
8. Robustness
a) Effect of Variation in Mobile Phase Composition (Acetonitrile)
A study to establish the effect of variation in mobile phase composition was conducted. Three mobile phases were prepared having 90%, 100% and 110% of the method organic phase composition (Acetonitrile). Standard and test solutions prepared as per test method
were injected into HPLC system. The system suitability parameters and % assay were evaluated with the mobile phases as per test method and found to be within limits. The results are summarized in Table 16. From the above study, it was established that the allowable variation in organic phase composition (Acetonitrile) in mobile phase is from 90% to 110%.
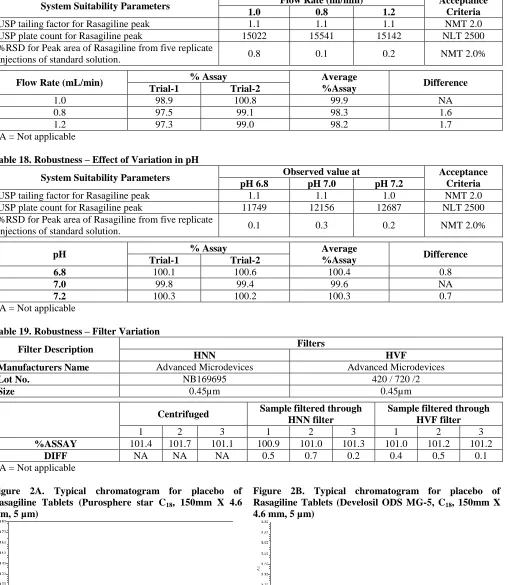
a) Effect of Variation in Flow Rate
A study was conducted to determine the effect of variation in flow rate. Standard and test preparations were prepared as per test method was injected into the HPLC system with flow rate 0.8 mL/min, 1.0 mL/min and 1.2 mL/min. The system suitability parameters and difference from average assay values were evaluated as per test method for the flow rates and found to be with in limits. The results are summarized in Table 17. From the above study, it was established that the allowable variation in flow rate is from 0.8 mL/min to 1.2 mL/min.
Effect of Variation in pH of Buffer in Mobile Phase
A study to establish the effect of variation in pH of buffer in mobile phase was conducted. Three mobile phases were prepared having buffer of pH 6.8, pH7.0 and pH 7.2. Standard and test solutions prepared as per the test method were injected into the HPLC system using three mobile phases. The system suitability parameters and % Assay were evaluated as per the test method and found to be with in the limits. The results are summarized in Table 18. From the above study, it was established that the allowable variation in pH of Buffer in mobile phase is from 6.8 and 7.2.
Effect Of Using Different Filters (Filter Validation)
A study to establish the effect of using different filters in test solution and standard was conducted. Standard and test solutions prepared as per the test method were prepared and divided into three portion one portion centrifuged, second portion filtered through HNN filter and third portion filtered through HVF filter followed by injected into the HPLC system using three different condition. The system suitability parameters and % Assay were evaluated as per the test method and found to be within the limits. The results are summarized in Table 19. From the above study, it was established that both HNN and HVF filter suitable for filtration.
Table 6. Placebo Interference
Sample No % Interference
0.5 mg 1 mg
1 NIL NIL
2 NIL NIL
3 NIL NIL
93
Table 7.Linearity of Detector ResponseS.No. Concentration (µg/mL) Average peak area
01 4.8155 146305
02 10.0323 258753
03 20.0646 592210
04 40.1292 1232893
05 50.1615 1540719
06 60.1240 1846719
07 80.2484 2397280
08 100.3230 2960631
09 125.4038 3758079
10 150.4845 4408624
Correlation coefficient 0.999
Table 8. Repeatability (Precision)
Test No 0.5mg 1mg
01 100.5 100.4
02 101.5 100.5
03 101.2 100.8
04 100.9 100.3
05 101.5 100.2
06 100.9 100.8
Average 101.1 100.5
% RSD 0.4 0.3
Table 9. Accuracy Sample
No. Spike level ‘mg’ added ‘mg’ found % Recovery Average %recovery
1
5%
0.49 0.50 102.0
102.0
2 0.49 0.50 102.0
3 0.49 0.50 102.0
4
25%
2.53 2.60 102.8
102.1
5 2.53 2.59 102.4
6 2.53 2.60 102.8
7
50%
4.99 5.04 101.0
100.9
8 4.99 5.03 100.8
9 4.99 5.04 101.0
10
75%
7.49 7.59 101.3
101.5
11 7.49 7.60 101.5
12 7.49 7.62 101.7
13
100%
9.94 10.00 100.6
100.2
14 9.94 9.94 100.0
15 9.94 9.94 100.0
16
150%
14.81 14.61 98.6
98.9
17 14.81 14.67 99.1
94
Table 10. Linearity of Test MethodSpike level Average ‘mg’ of Rasagiline added Average ‘mg’ of
Rasagiline Recovered
5% 0.49 0.5
25% 2.53 2.6
50% 4.99 5.04
75% 7.49 7.60
100% 9.94 9.96
150% 14.81 14.65
Co-efficient of Correlation (r) 0.999
Table 11. Analyst to Analyst Variability
Analyst – 1 Analyst - 2
N.Suresh kumar S. Anupriya
System Suitability Parameters Observed Value Acceptance Criteria
Analyst-1 Analyst-2
USP tailing factor for Rasagiline peak 1.1 1.1 NMT 2.0
USP plate count for Rasagiline peak 13890 10321 NLT 2500
%RSD for Peak area of Rasagiline from five replicate
injections of standard solution. 0.2 0.2 NMT 2.0%
Sample No. % Assay
Analyst - 1 Analyst - 2
1 100.4 100.6
2 100.5 100.4
3 100.8 100.9
4 100.3 100.6
5 100.2 100.7
6 100.8 100.9
Mean 100.5 100.7
%RSD 0.2 0.2
Overall %RSD 0.2
Table 12. System to System Variability
HPLC System HPLC System - 1
Instrument ID.No. ADE 161
System Suitability Parameters Observed Value Acceptance Criteria
System-1 System-2
USP tailing factor for Rasagiline peak 1.1 1.1 NMT 2.0
USP plate count for Rasagiline peak 13890 11883 NLT 2500
%RSD for Peak area of Rasagiline from five replicate
injections of standard solution. 0.2 0.3 NMT 2.0%
Sample No. % Assay
System-1 System-2
1 100.4 100.6
2 100.5 100.1
3 100.8 100.1
4 100.3 101
5 100.2 101.4
6 100.8 101
Mean 100.5 100.7
%RSD 0.2 0.2
95
Table 13. Column to Column VariabilityHPLC Column Column – 1
Column ID.No. CLC1000
System Suitability Parameters Observed Value Acceptance Criteria
Column-1 Column-2
USP tailing factor for Rasagiline peak 1.1 1.0 NMT 2.0
USP plate count for Rasagiline peak 13890 13512 NLT 2500
%RSD for Peak area of Rasagiline from five replicate
injections of standard solution. 0.2 0.4 NMT 2.0%
Sample No. % Assay
Column-1 Column-2
1 100.4 100.5
2 100.5 101.0
3 100.8 100.9
4 100.3 101.6
5 100.2 101.6
6 100.8 101.9
Mean 100.5 101.3
%RSD 0.2 0.6
Overall %RSD 0.6
Table 14. Ruggedness – Bench top Stability of Standard and Test Preparation Time in
Days
% Assay of Standard preparation
Difference from Initial
% Assay of test preparation Difference from Initial
Test - 1 Test - 2 Test - 1 Test – 2
Initial 63.9* NA 101.8 100.1 NA NA
1 63.5 0.4 101.3 100.5 0.5 0.4
2 64.1 0.2 102.9 100.9 1.1 0.8
* Potency of working standard as Rasagiline on as is basis. NA = Not Applicable
Table 15. Ruggedness – Refrigerator stability Of Standard and Test Preparation Time in
Days
% Assay of Standard preparation
Difference from Initial
% Assay of test preparation Difference from Initial
Test - 1 Test - 2 Test - 1 Test - 2
Initial 63.9* NA 101.8 100.1 NA NA
1 64.4 0.5 102.1 100.7 0.3 0.6
2 63.3 0.6 101.0 101.3 0.8 1.2
* Potency of working standard as Rasagiline on as is basis. NA = Not Applicable
Table 16. Robustness - Effect of Variation In Mobile Phase Composition (Acetonitrile)
System Suitability Parameters Organic phase ratio (Acetonitrile) Acceptance Criteria
100% 90% 110%
USP tailing factor for Rasagiline peak 1.1 1.0 1.1 NMT 2.0
USP plate count for Rasagiline peak 15094 14852 14438 NLT 2500
%RSD for Peak area of Rasagiline from five replicate
injections of standard solution. 0.5 0.3 0.1 NMT 2.0%
Organic phase ratio (Acetonitrile)
% Assay Average
%Assay Difference
Trial-1 Trial-2
100% 100.5 100.9 100.7 NA
90% 99.6 100.7 100.2 0.5
110% 100.0 99.4 99.3 1.4
96
Table 17. Robustness - Effect of Variation In Flow RateSystem Suitability Parameters Flow Rate (ml/min) Acceptance
Criteria
1.0 0.8 1.2
USP tailing factor for Rasagiline peak 1.1 1.1 1.1 NMT 2.0
USP plate count for Rasagiline peak 15022 15541 15142 NLT 2500
%RSD for Peak area of Rasagiline from five replicate
injections of standard solution. 0.8 0.1 0.2 NMT 2.0%
Flow Rate (mL/min) % Assay Average
%Assay Difference
Trial-1 Trial-2
1.0 98.9 100.8 99.9 NA
0.8 97.5 99.1 98.3 1.6
1.2 97.3 99.0 98.2 1.7
NA = Not applicable
Table 18. Robustness – Effect of Variation in pH
System Suitability Parameters Observed value at Acceptance
Criteria
pH 6.8 pH 7.0 pH 7.2
USP tailing factor for Rasagiline peak 1.1 1.1 1.0 NMT 2.0
USP plate count for Rasagiline peak 11749 12156 12687 NLT 2500
%RSD for Peak area of Rasagiline from five replicate
injections of standard solution. 0.1 0.3 0.2 NMT 2.0%
pH % Assay Average
%Assay Difference
Trial-1 Trial-2
6.8 100.1 100.6 100.4 0.8
7.0 99.8 99.4 99.6 NA
7.2 100.3 100.2 100.3 0.7
NA = Not applicable
Table 19. Robustness – Filter Variation
Filter Description Filters
HNN HVF
Manufacturers Name Advanced Microdevices Advanced Microdevices
Lot No. NB169695 420 / 720 /2
Size 0.45µm 0.45µm
Centrifuged Sample filtered through HNN filter
Sample filtered through HVF filter
1 2 3 1 2 3 1 2 3
%ASSAY 101.4 101.7 101.1 100.9 101.0 101.3 101.0 101.2 101.2
DIFF NA NA NA 0.5 0.7 0.2 0.4 0.5 0.1
NA = Not applicable
Figure 2A. Typical chromatogram for placebo of Rasagiline Tablets (Purosphere star C18, 150mm X 4.6
mm, 5 µm)
Figure 2B. Typical chromatogram for placebo of Rasagiline Tablets (Develosil ODS MG-5, C18, 150mm X
97
Fig 3. Linearity of Detector Response Graph Fig. 4. Typical Chromatogram of Rasagiline tabletsFig. 5. Linearity of Test Method Graph Figure 6A: Typical chromatogram of Rasagiline Standard (Develosil ODS MG-5, C18, 150mm X 4.6mm,
5µm)
Figure 6B: Typical chromatogram of Rasagiline Tablets Test preparation (Develosil ODS MG-5, C18, 150mm X 4.6mm,
5µm)
RESULTS AND DISCUSSION
As there is no official method for the estimation of Rasagiline in pharmacopoeia, hence it was felt necessary to develop a sensitive method for estimation of Rasagiline and literature review doesn’t show any effective and precise method determination in this dosage formulation.
98
Thus the present proposed system provides shorter analysis time and conserves mobile phase system. The method was validated based on United States pharmacopoeia and ICH parameters. The parameters are System Precision and System Suitability, Specificity, Linearity, Precision, Accuracy, ruggedness and robustness.
Specificity
The specificity of the method was confirmed by injecting the placebo and observed that there was no interference due to placebo. These chromatograms are shown in fig. 8A & 8B and in Table 6.
Acceptance criteria: No interference from placebo shall be observed at the retention time of main peak.
Linearity of Detector Response
The data regarding linearity of Rasagiline are given in table 8 and calibration graph are shown in fig. 9. Chromatograms are shown in fig. 10. From the linearity studies the specified range was determined for Rasagiline 4.8155 – 150.4845 µg/mL and Correlation coefficient was found to be 0.999.
Acceptance Criteria: The Correlation coefficient should be not less than 0.999.
Precision
The precision of the method was determined by
replicate injections standard solution. The percentage of RSD of assay was to be 0.3 for Rasagiline which was with in the acceptance criteria of 2%. Thus the proposed method was found to be providing high degree of precision and reproducibility. The chromatograms are shown in fig. 10and data are reported in table 8.
Acceptance criteria:
1. The relative standard deviation of % assay results should be not more than 2.0%.
2. The assay of Rasagiline should be not less than 97.0% and not more than 103.0%.
Accuracy
The validation of the proposed reverse phase HPLC method was further verified by recovery studies. The percentage recovery was found to be within 98.9 – 102.1 %w/w of Rasagiline. This serves a good index of accuracy and reproducibility of the proposed method showed in Table 10.For Linearity of Test Method, a graph is plotted to ‘average mg of Rasagiline added’ versus ‘average mg of Rasagiline recovered’ in Accuracy (Recovery) section. The correlation coefficient was found to be 0.999. From the above study, it was established that the method is linear from 5% to 150% of the target concentration shown in Table 10 and Figure 11.
Acceptance criteria: The average recovery of Rasagiline at each spike level should be not less than 97.0% and not more than 103.0%.
Acceptance criteria: Coefficient of correlation should be not less than 0.999.
Ruggedness
a) Analyst to Analyst Variability
The ruggedness of the method was determined by performing by the same assay by different analyst and performing the assay a different day to check the reproducibility. The average % assay obtained by both the analysts was found to be 100.5% and 100.7% with a relative standard deviation of 0.2% and 0.2 % respectively. The system suitability parameters were evaluated as per the test method by both the analysts and found to be within the limits. The results are summarized in Table 11.
Acceptance criteria:
1. The Assay of Rasagiline should be not less than 97.0% and not more than 103.0%.
2. The relative standard deviation of % assay results should be not more than 2.0%.
System to System Variability
System to system variability study was conducted by two system by assaying six different test preparations of Rasagiline Tablets 1 mg. The average % assay obtained by both the system was found to be 100.5% and 100.7% with a relative standard deviation of 0.2%and 0.2 % respectively. The system suitability parameters were evaluated as per the test method by both the system and found to be with in the limits. The results are summarized in Table 12.
Acceptance criteria:
1. The Assay of Rasagiline should be not less than 97.0% and not more than 103.0%.
2. The relative standard deviation of % assay results should be not more than 2.0%.
Column to Column Variability
Column to column variability study was conducted by two column by assaying six different test preparations of Rasagiline Tablets 1 mg.
The average % assay obtained by both the system was found to be 100.5% and 101.3% with a relative standard deviation of 0.2% and 0.6% respectively. The system suitability parameters were evaluated as per the test method by both the system and found to be with in the limits. The results are summarized in Table 13.
Acceptance criteria:
1. The Assay of Rasagiline should be not less than 97.0% and not more than 103.0%.
2. The relative standard deviation of % assay results should be not more than 2.0%.
99
A study to establish the stability of Rasagiline in test preparation and standard preparation on bench top was conducted at initial, 1 day and 2 days. The assay of Rasagiline in test preparation and standard preparation were estimated against freshly prepared standard each time. The difference in % assay of Standard and Test preparations from initial to 1 day and 2 days was calculated and the results are summarized in Table 14.
Acceptance Criteria: The % assay of Rasagiline in standard and test preparation should not differ by more than 2.0 from initial value.
C) Refrigerator Stability of Test Preparation and Standard Preparation
A study to establish the stability of Rasagiline in test preparation and standard preparation in refrigerator was conducted over a period of 2 days. The % assay of Rasagiline in test preparation and standard preparation was estimated at initial, 1 day, 2 days against freshly prepared standard at each time. The difference in % assay of standard and test preparations from initial to 1 day and 2 days were found to be within the limits. The results are summarized in Table 15.
Acceptance Criteria: The % assay of Rasagiline in standard and test preparation should not differ by more than 2.0 from initial value.
Robustness
a) Effect of Variation in Mobile Phase Composition (Acetonitrile)
A study to establish the effect of variation in mobile phase composition was conducted. Three mobile phases were prepared having 90%, 100% and 110% of the method organic phase composition (Acetonitrile). Standard and test solutions prepared as per test method were injected into HPLC system. The system suitability parameters and % assay were evaluated with the mobile phases as per test method and found to be within limits. The results are summarized in Table 16. From the above study, it was established that the allowable variation in organic phase composition (Acetonitrile) in mobile phase is from 90% to 110%.
Acceptance criteria:
1. All the system suitability parameters shall meet the requirements as per the test method.
2. The Average %Assay values should not differ by more than 2.0 when compared with that of the test method values.
3. %Assay should be NLT 97.0% and NMT 103.0%.
b) Effect of Variation in Flow Rate
A study was conducted to determine the effect of variation in flow rate. Standard and test preparations were prepared as per test method was injected into the HPLC system with flow rate 0.8 mL/min, 1.0 mL/min and 1.2 mL/min. The system suitability parameters and
difference from average assay values were evaluated as per test method for the flow rates and found to be within limits. The results are summarized in Table 17.
From the above study, it was established that the allowable variation in flow rate is from 0.8 mL/min to 1.2 mL/min.
Acceptance criteria:
1. All the system suitability parameters shall meet the requirements as per the test method.
2. The Average %Assay values should not differ by more than 2.0 when compared with that of the test method values.
3.%Assay should be NLT 97.0% and NMT 103.0%.
EFFECT OF VARIATION IN pH OF BUFFER IN MOBILE PHASE
A study to establish the effect of variation in pH of buffer in mobile phase was conducted. Three mobile phases were prepared having buffer of pH 6.8, pH7.0 and pH 7.2. Standard and test solutions prepared as per the test method were injected into the HPLC system using three mobile phases. The system suitability parameters and % Assay were evaluated as per the test method and found to be within the limits. The results are summarized in Table 18.
From the above study, it was established that the allowable variation in pH of Buffer in mobile phase is from 6.8 and 7.2.
Acceptance criteria:
1. All the system suitability parameters shall meet the requirements as per the test method.
2. The Average %Assay values should not differ by more than 2.0 when compared with that of the test method values.
3. %Assay should be NLT 97.0% and NMT 103.0%
EFFECT OF USING DIFFERENT FILTERS (Filter Validation)
A study to establish the effect of using different filters in test solution and standard was conducted. Standard and test solutions prepared as per the test method were prepared and divided into three portion one portion centrifuged, second portion filtered through HNN filter and third portion filtered through HVF filter followed by injected into the HPLC system using three different condition. The system suitability parameters and % Assay were evaluated as per the test method and found to be within the limits. The results are summarized in Table 19.
From the above study, it was established that both HNN and HVF filter suitable for filtration.
Acceptance Criteria:
The difference of % assay result from centrifuged sample to filtered samples should be not more than 2.0.
CONCLUSION
100
method was developed with mobile phase system of Buffer : Acetonitrile (60:40) v/v with flow rate 1.0 ml/min on Develosil ODS MG-5 C18, 150x4.6mm, 5µm particle size with UV Visible detector 210nm gave a satisfactory chromatogram with Rasagiline. The peaks of Rasagiline are found well separated at 3.804min. The developed method is validated for various parameters as per ICH
guidelines like accuracy, precision, linearity, specificity, ruggedness and robustness. The results obtained are within the acceptance criteria. The proposed method is applied for determination of Rasagiline in marketed formulation. Hence the proposed method is found to be satisfactory and could be used for the routine analysis of Rasagiline in tablet dosage form.
REFERENCES
1. World Health Organization. The International pharmacopoeia and related activities Quality assurance of pharmaceuticals. A compendium of guidelines and related materials. World Health Organization Publication Geneva,1997, P (119-124) I.A.
2. Rascol O, Brooks DJ, Melamed E, et al. Rasagiline as an adjunct to levodopa in patients with Parkinson's disease and motor fluctuations (LARGO, Lasting effect in Adjunct therapy with Rasagiline Given Once daily, study): a randomised, double-blind, parallel-group trial. Lancet, 365(9463), 2005, 947–54.
3. Parkinson Study, Group. A randomized placebo-controlled trial of rasagiline in levodopa-treated patients with Parkinson disease and motor fluctuations, the PRESTO study. Arch. Neurol, 62(2), 2005, 241–8.
4. http,//www.healthcareilluminated.com/articles/20203-parkinson-s-drug-may-also-treat-restless-leg-syndrome
5. Oldfield V, Keating GM, Perry CM. Rasagiline, a review of its use in the management of Parkinson's disease. Drugs, 67(12), 2007, 1725–47.
6. Youdim MB and Weinstock M. Molecular basis of neuroprotective activities of rasagiline and the anti-Alzheimer drug TV3326 [(N-propargyl-(3R) aminoindan-5-YL)-ethyl methyl carbamate]. Cell Mol Neurobiol, 21(6), 2001, 555–73. 7. Youdim MB, Amit T, Falach-Yogev M, Bar Am O, Maruyama W, Naoi M. The essentiality of Bcl-2, PKC and
proteasome-ubiquitin complex activations in the neuroprotective-antiapoptotic action of the anti-Parkinson drug, rasagiline. Biochem Pharmacol, 66(8), 2003, 1635–41.
8. Maruyama W, Akao Y, Carrillo MC, Kitani K, Youdium MB, Naoi M. Neuroprotection by propargylamines in Parkinson's disease, suppression of apoptosis and induction of prosurvival genes. Neurotoxicol Teratol, 24(5), 2002, 675– 82.
9. Lecht S, Haroutiunian S, Hoffman A, Lazarovici P. Rasagiline – a novel MAO B inhibitor in Parkinson's disease therapy. Ther Clin Risk Manag, 3(3), 2007, 467–74.
10. Naoi M, Maruyama W, Youdim MB, Yu P, Boulton AA. Anti-apoptotic functions of propargylamine inhibitors of type-B monoamine oxidase. Inflammopharmacology, 11(2), 2003, 175.
11. C Warren Olanow, Olivier Rascol, et al. A Double-Blind, Delayed-Start Trial of Rasagiline in Parkinson's Disease". New
England Journal of Medicine, 361(13), 2009, 1268–78.
12. Lloyd R Snyder and John W Dolan. High-Performance Gradient Elution, The Practical Application of the
Linear-Solvent-Strength Model. Wiley Interscience, 2006, ISBN 0471706469.
13. Validation of analytical procedure / Methodology as per ICH Hormnised Tripartite guidelines 1996,Q2A having reached step 4 of the ICH process at the ICH steering committee meeting on 27 October 1994, 1-8.
14. SOP validation studies, Indian Pharma guidance Academy. Nagpur, 1996, P- 1-3.
15. United States of pharmacopoeia, 26th ed US Pharmacopoeia convention, Rock Ville M.D. 2003, 1151.
16. National Institute of pharmaceutical Education and Research, Punjab. Government of India Ministry of External affairs under the ITEC and SSAAP programmer, Assessment of Quality drugs and pharmaceuticals validation of Analytical Methods, Punjab, 1999.
17. Hdjico Stas E. Validation of Analytical methods. Quality Assurance in Analytical Chemistry training and teaching, 1st ed Springer private Limited, International Springer group, New Delhi, 2004, P-201-19.
18. Balikak B, Shetty SM. Scope and importance of analytical chemistry In pandey M. College – Analytical chemistry. 5th ed. Himalaya publishing House. Ramdoot,12B, Bombay, 1987, P1-7.
19. AV Kasture, SG Wadodkar, KR Mahadik, HN More. Pharmaceutical Analysis (volume 2) Instrumental methods (7th edition), 4–9.
20. Still WC, Kahn M, Mitra AJ. Org. Chem, 43(14), 1978, 2923-2925.
21. Pirkle WH and Pochapsky TC. "Advances in Chromatography" eds. Giddings JC, Grushka E and Brown PR, Marcel Dekker Inc. NY, 1987, 27, 73-127.
22. DR Taylor and K Maher. Chiral Separations by High-Performance Liquid Chromatography. J. Chromatogr. Sci, 30, 1992, 67-85.
23. G Gubitz. Separation of Drug Enantiomers by HPLC Using Chiral Stationary Phases- A Selective Review.