Analysis of saline activator solution effects on sperm quality
indices of Barbus sharpeyi by Image J software
Kalbassi M. R.
*1; Lorestani R.
1;
Ghafle Maramazi J.
2Received: November 2011 Accepted: November 2012
Abstract
Regarding low fertilization rate of Barbus sharpeyi, one of the main Barbus species in south
of Iran, saline activator solutions (SAS 1 and 2) were used for increasing of sperm activation and its sperm quality indices were assessed by using Image J software as a fish sperm adapted
tools. SAS1 (45mM NaCl, 5mM KCl, 30mM Tris, 188
±
2.3 mOsmol/kg) and SAS2 (50mMNaCl, 30mM KCl, 30mM Tris, 189
±
1.7 mOsmol/kg) were added to a mixture of 12 malesemen comparing with distilled and tap water and their effects on VCL, VSL, ALH, Linearity, %motility, spermatozoa path, % A, B and C spermatozoa type, fertilization,
hatching and deformity rate were analyzed in triplicate. Results showed that SAS2 had the
highest VCL (21.37
±
0.36 µm/s), VSL (11.6±
0.3 µm/s) and motility percentage (85.75±
1.56%) among treatments. The highest A type spermatozoa percentage was recorded for SAS1
(47.16
±
3.15 %) and SAS2 (43.89±
4.54%). The lowest C type spermatozoa percentage wasrecorded using SAS2 (14.24
±
1.56 %). Also, the highest fertilization rate was achieved fromSAS2 (79.5
±
0.37%) and SAS1 (77.74±
4%) respectively. Furthermore the lowest larvaldeformity rate (13.77
±
1.03%) was shown due to the use of SAS2. Final conclusion confirmedthat SAS1 and SAS2 have positive and significant effects (P < 0.05) on extending the time
length of sperms movement, VCL and VSL of B. sharpeyi which consequently resulted in
better efficiency of propagation of this species in south of Iran.
Keywords: Sperm, Saline activator solution, Fertilization, Barbus sharpeyi, Iran
_____________________________
1- Faculty of Marine Sciences and Natural Resourse, Tarbiat Modares University, P.O.BOX: 46414, Noor, Iran. 2- South Iran Aquaculture Research Center, P.O.BOX: 866/61645, Ahvaz, Iran.
*Corresponding author's email: [email protected]
Introduction
Barbus sharpeyi is considered as one of the 300 species of barbus-fishes family (Al Mukhtar et al., 2006) and an important fish species in Khuzestan Province of Iran (Mohamadian et al., 2009). In recent years, several reasons such as market value, illegal fishing, pollution of wetlands, lack of efficient methods for larval production and reconstructing natural stocks (Pyka et al., 2001; Al Mukhtar, 2009) resulted in depletion of population and categorized it as an endangered species (Al Mukhtar et
al., 2009). Geographical distributions of B.
sharpeyi are limited to the Iran, Iraq, Turkey, Nile, Victoria and Naser River (Coad, 1995; Kahkesh et al., 2010), which could be a reason for its limited available studies on the reproduction.
Although natural habitat of this species in Iran is Shadegan and
Hoor-el-Azim wetlands where B. sharpeyi forms
the highest percentage of carp fish (AL Mukhtar et al., 2006), Maremzi et al.
(2000) reported that B. sharpeyi
distribution in most water bodies of Khuzestan Province.
Despite of propagation of B.
sharpeyi in Iran, the fertilization rate and efficiency of reproduction have been reported unsatisfactory (Pyka et al., 2001). Among different species of barbels in
Khuzestan, B. sharpeyi shows the lowest
fertility rate and so study of sex gametes and identifying the causes of their lower
fertilization rate until hatching and
applying ways to increase the quality of
sex gametes of B. sharpeyi, can be a
valuable step to increase the fertilization rate of this species.
In most hatchery centers the quality of eggs and larva are considered important, while the quality of sperm and eggs affect fertilization success and survival of larvae (Rurangwa et al., 2004). In some species, low sperm quality can be considered as a limiting factor of their breeding (Bozkurt, 2006).
Since the availability of sperm with high quality is essential for achieving the high fertilization rate and larval quality (Verma et al., 2009), implementation of
this study can be worthwhile for
completing basic information of gamete
biology and increasing reproduction
efficiency in B. sharpeyi.
The sperm quality is determined in
accordance with general mobility
parameters; sperm concentration and egg fertilization success rate (Alavi et al., 2006; Krol et al., 2006; Cejko et al., 2008).
The most important qualitative
characteristic of spermatozoa is motility (Lorestani et al., 2006; Kalbassi and Lorestani, 2007) and studies on fish sperm motility have been limited to about 20 species, while many species of fish exist, that lack comprehensive studies on their sperms (Cosson, 2004; Utarabhand and Watankul, 1998). It seems that the increasing duration of sperm motility has a strong positive correlation with ability of fertilization (Utarabhand and Watankul, 1998; Rurangwa et al., 2004).
Since 1990, researchers used computer assessment sperm quality analysis method
(CASA) for assessing different
spermatozoa movement parameters and its
methodology in ichthyology and
aquaculture has been taken from human clinical fertility (Elofsson et al., 2003; Alavi and Cosson, 2005; Pavlov, 2006). Based on CASA method, the optimum conditions are performed for artificial fertilization, selecting high-quality males, long-term sperm storage experiments, study of water pollution and environmental
effects on male population
(Kime et al., 2001; Ebrahimi, 2005). However, due to the complexity, high cost and unavailability of CASA system, its usage is not possible in most laboratories, but sperm analysis with Image J software has not considerable finance and is easy to work (Pavlov, 2006; Fauvel et al., 2010). Image J software is an open source
software for calculating the most
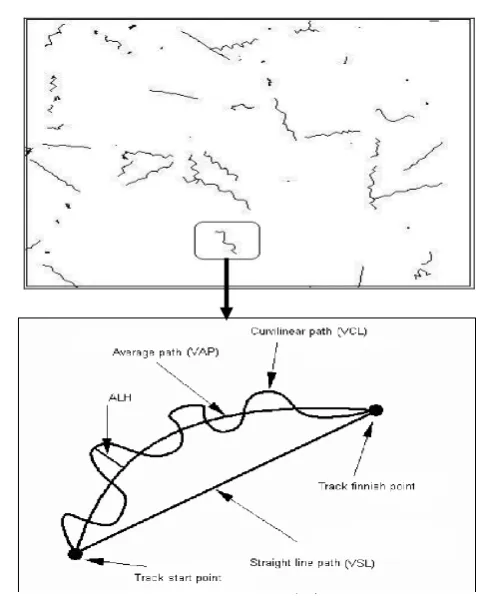
spermatozoa motility parameters (Fig. 1) (Wilson Leedy and Ingermann, 2007; Cabrita et al., 2008).
Figure 1: Spermatozoa movement scheme
The aim of this study was to compare the effects of saline activator solutions, distilled water and tap water on various
parameters of spermatozoa motility in B.
sharpeyi, such as VCL (Curvilinear Velocity Length ), VSL (Straight Line
Velocity), ALH (Lateral Head
Displacement),Linearity (VSL/VCL×100),
% motility, A, B and C spermatozoa types,
duration of sperm motility and
Spermatozoa path. Also, effects of aforementioned parameters were evaluated on fertilization, hatching and deformity rate.
Materials and methods
This experiment was carried out at the center of endemic fish propagation, Khuzestan province, south of Iran, from beginning of March until June 2010.
Twelve male B. sharpeyi (4+ years old)
with total weight 916±234.15 g and total length 43.40±4.33 cm were used as semen
donors. Also four female B. sharpeyi (5+
years old) with total weight 1577±208.06 g and total length 49.75±2.62 cm were used as oocyte donors. The broodstock was held
in 1.5×1×8 m raceways at 23 oC.
Hormone injection
The fish were anaesthetized by 100 mg/L
MS222 and the males and females were
injected intraperitonealy at volume of 1 ml/kg. The spermiation of males was stimulated with injection of 10 µg
LHRHaII and 2.5 mg metoclopramide per
kg-1 of body weight. Also females received
4 mg per kg-1 b.w carp pituitary extract
and 12 hr after the second injection;
ovulation was checked by gently
massaging the abdomen.
Sperm dilution
The sperm samples were pooled and pre diluted by 100 micro liter fresh sperm: 30 ml immobilizing solution (IMS: 150 mM NaCL, 20 mM Tris–HCl, pH 8.5; 366±7.3
mosM) and were kept at refrigerator temperature until Image J analysis. Pre diluted sperm samples were activated by second dilution step in 50 volume
activating solution: 50 volume
immobilized spermatozoa (Jing et al., 2009).
Sperm activators
Activator solutions were used for studying with the Image J software and performing
in vitro fertilization which consist of the
Saline Activator Solution 1 (SAS1: 45 mM
NaCL, 5 mM KCl, 30 mM Tris–HCl, pH 8.2; 188 mOsmol/kg), Saline Activator
Solution 2 (SAS2: 50 mM NaCL, 30 mM
KCl, 30 mM Tris–HCl, pH 8.5; 189 mOsmol/kg), distilled water and hatchery water. Osmotic pressure of activation and dilution solutions was measured by using a vapor pressure osmometer (OSMOMAT 030 Japan).
Study of sperm motility with Image J software
Effects of the activating solutions on some sperm motility factors such as VCL, VSL, Linearity, % motility, ALH, path of spermatozoa movement and percentage of A, B and C spermatozoa types were analyzed by Image J software in three replicates. Image J equipment included a microscope (SAIRAN Company) with video camera (Samsung, SCC-B2007P, China) connected to a computer system (512 GB of RAM, processor 3.8 full Co. AMD) and the objective lens 10X Olympus (USA). Also a sperm chamber (code: MS090056, India) were used for
microscopic observation. This chamber produced a thin microscopic space (10µm
depth) and spermatozoa cells were
arranged to one layer for better analysis.
Amount of 100 micro liters diluted sperm were placed in the chamber of sperm meter and then 100 micro liters of
activator solutions (SAS1, SAS2, Distilled
Water or Hatchery Water) were added. For Each activator, at least three video clips were recorded. The first minute of all video clips were cut to 12 pieces of 5 seconds part, by VCD Cutter software and were converted to row frames by Image J software. Each second of clips consisted of 30 frames. Image J software gives specific codes to each spermatozoid cell and follow position of all spermatozoid cells from one frame to the next one. The
motility parameters of B. sharpeyi
spermatozoa were analyzed based on the method of Pavlov (2006); Wilson Leedy and Ingermann (2007) and Fauvel et al. (2010).
Also, on the basis of Lahnsteiner et al. (1996) method, spermatozoa were categorized to 3 types: A (with a velocity more than 20 µm/s), B (velocity between 5 to 20 µm/s) and C (with a velocity less than 5 µm/s). During the present study, 21600 frames, 720 pictures of movement path and motility characteristics of 20860 spermatozoa cells were analyzed with Image J software.
Fertilization protocols
In each treatment 10 ml of pooled fish oocytes (from 4 females) mixed with 10
micro liters of pooled fresh sperm (from 12 males) and 1 cc activating solutions
(SAS1, SAS2, Distilled Water or Hatchery
Water) were added and fertilized in triplicate.
Adhesiveness of eggs was removed with continuous stirring for 0.5 h in the hatchery tap water and then was rinsed twice in a 5% solution of tannic acid for 20 s for the final elimination of stickiness (Horva´th et al., 2007). For incubation of fertilized eggs, a special zuger-type incubator with a capacity of 2 L and 9 cm in diameter were designed and eggs were transferred to it until hatching were recorded. The average water flow in incubators was 543.33± 38.44 ml/min.
After 12 h following fertilization, the embryonic development stages of eggs were calculated. For this purpose about 500 eggs in each replication were taken out of the incubator with siphoning. Then, eggs with a nervous belt were assumed as a fertilized egg. After hatching, the numbers of obtained larvae were counted for calculating hatching and deformity rate (Pyka et al., 2001).
Statistical Analysis
Normality of variance was tested by the Kolmogorov–Smirnov and all data were shown as mean± SE (SEM). One-way ANOVA was used to determine the effects
of different activators on motility
parameters, incubation survival, hatching and deformity percentage of larvae. Means were separated by Duncan's New Multiple
Range Test, and were considered
significantly at P<0.05. Statistical analysis was conducted using SPSS software version 16.0.
Results
The peculiarities location defined by Image J software with plotted based upon
the calculated x, y coordinates from the videotape was achieved with the use of hatchery water (A), distilled water (B),
SAS1 (C) and SAS2 (D), were shown in
Figure 2.
a
b
c
d
Figure 2: Image of all video frames in 1 second of video taken at 30 frame per second in hatchery water (a), Distilled water (b), SAS1 (c) and SAS2 (d).
As seen in the Figure 2 the higher percentage of sperm linearity movement in SAS 1 and 2 revealed their better potential for fertilization than the sperm movement in tap and distilled water.
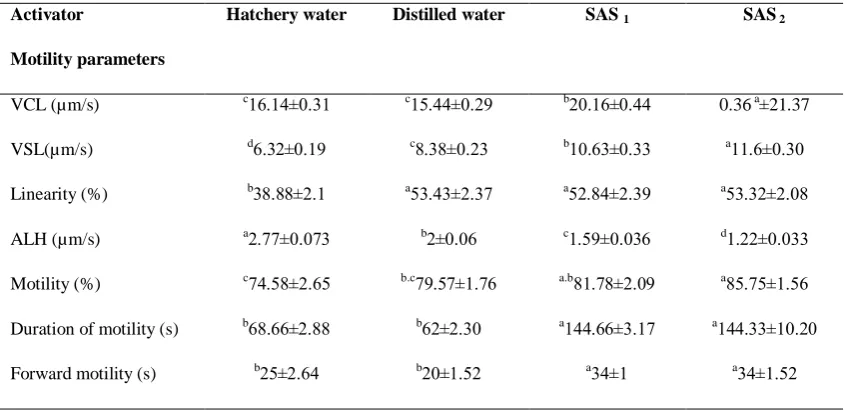
The results of spermatozoa analysis in B. sharpeyi with the Image J software were shown in Table 1. The VCL amount was from 5.44±0.29 to 21.37±0.36 µm/s. There were significant differences among groups in VCL and the highest VCL was
related to SAS 2 (P < 0.05, Table 1). There
were no significant differences between VCL of distilled and tap water (P > 0.05, Table 1). They created the lowest VCL rate, but had significant differences with
SAS1 and SAS2 (P < 0.05, Table 1). The
Lowest and highest VSL amounts were
detected in tap water and SAS2 ranging
from 6.32±0.19 to 11.6±0.3 µm/s,
respectively. Also we observed significant differences (P < 0.05, Table 1) between
VSL amounts of SAS1 (10.630.33± µm/s)
and SAS2 (11.6±0.3µm/s). The lowest
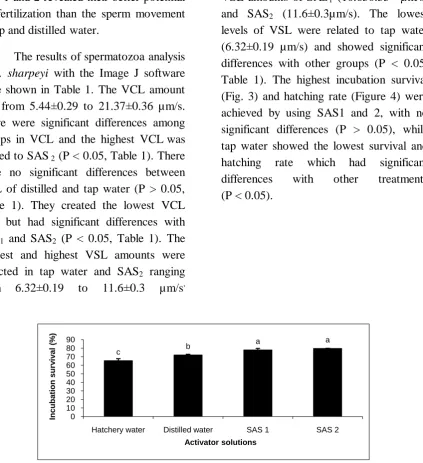
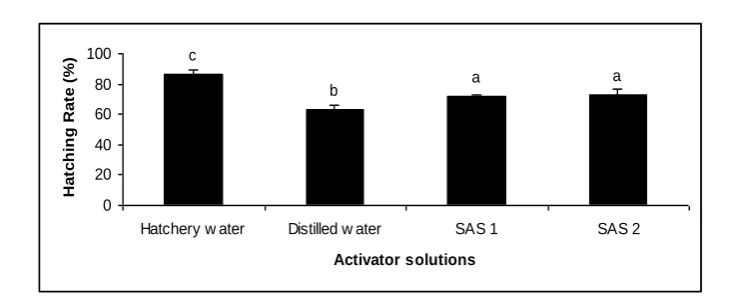
levels of VSL were related to tap water (6.32±0.19 µm/s) and showed significant differences with other groups (P < 0.05, Table 1). The highest incubation survival (Fig. 3) and hatching rate (Figure 4) were achieved by using SAS1 and 2, with no significant differences (P > 0.05), while tap water showed the lowest survival and
hatching rate which had significant
differences with other treatments
(P < 0.05).
c b
a a
0 10 20 30 40 50 60 70 80 90
Hatchery water Distilled water SAS 1 SAS 2
Incu
bat
ion
surv
iv
al
(%
)
Activator solutions
Figure 3: Effect of different activator solutions on (%) incubation survival of B. sharpeyi
c
b a a
0 20 40 60 80 100
Hatchery w ater Distilled w ater SAS 1 SAS 2
Activator solutions
Ha
tc
h
in
g
Ra
te
(
%
)
Figure 4: Effect of different activator solutions on (%) hatching rate of B. sharpeyi
However, significant differences were detected among treatments regarding larval deformity (P < 0.05, Fig. 5).
Application of SAS2 caused the lowest
larval deformity (13.77±1.03 %), whereas usage of distilled water led to high levels of larval deformity (21.071±1.09 %). spermatozoa linearity movement results showed that there were no significant
differences among SAS1, SAS2 and
distilled water (P > 0.05, Table 1), but tap
water had the lowest linearity movement
(38.88±2.1 %) showing significant
differences with other groups (P < 0.05, Table 1). Significant differences were distinguished relating to ALH values among treatments (P < 0.05, Table 1). The lowest (1.22±0.033µm/s) and highest (2.77± 0.073µm/s) amounts of ALH were
belonged to SAS2 and tap water,
respectively.
Figure 5: Effect of different activator solutions on (%) deformity rate of B. sharpeyi
We also detected significant differences concerning motility percentages among activators (P < 0.05, Table 1). The results showed that the highest (85.75±1.56) and
lowest (74.58±2.65) percentages of
spermatozoa motility were found in SAS2
and tap water, respectively.
The highest total duration of sperm
motility and forward motility were
achieved by using SAS1 144.66±3.17
second) and SAS2 (2...11±2..1 second)
(P > 0.05, Table 1). Also, the lowest total
duration of sperm motility and forward motility were assessed using distilled and tap water (Table 1).
Table 1: Effect of different activator solutions on motility parameters of B. sharpeyi (µm/s)
SAS 2
SAS 1
Distilled water Hatchery water
Activator
Motility parameters
0.36 a±21.37 b1..22±....
c24...±..10 c22.2.±..12
VCL (µm/s)
a22.2±..1. b2..21±..11
c8.18±..11 d2.11±..20
VSL(µm/s)
a41.11±1..8 a41.8.±1.10
a41..1±1.12 b18.88±1.2
Linearity (%)
d2.11±...11 c2.40±...12
b1±...2 a1.22±...21
ALH (µm/s)
a84.24±2.42 a.b82.28±1..0
b.c20.42±2.22 c2..48±1.24
Motility (%)
a2...11±2..1. a2...22±1.22
b21±1.1. b28.22±1.88
Duration of motility (s)
a1.±2.41 a1. ±2
b1.±2.41 b14±1.2.
Forward motility (s)
A frame by frame analysis of the videotapes showed that most of cells in tap water possessed agitated motion (with a VCL less than 3 µm/s, Table 2, Fig. 2a) compared with other treatments. The highest C type spermatozoa were achieved with application of tap water (Table 2).
The highest a type spermatozoa
percentage were evaluated in
SAS1(.2.22±1.24) and SAS2 (.1.80±..4.)
with no significant difference (P > 0.05, Table 2). Also, the lowest C type spermatozoa percentage was recorded in
SAS2 (2..1.±2.42) showing significant
differences (P < 0.05, Table 2).
Table 2: Effect of different activators on A, B and C spermatozoa type of B. sharpeyi (%)
SAS 2
SAS 1
Distilled water Hatchery water
Activator
Sperm Type
a.1.80±..4. a.2.22±1.24
b1..0.±4.12
3.76 b±31.73
A (%)
a.2..4±..22 a1..21±...4
a.8.22±1.24 a.1.8.±2.82
B (%)
c2..1.±2.42 b.c28.28±1..2
a.b1...1±2.22 a14..2±1.24
C (%)
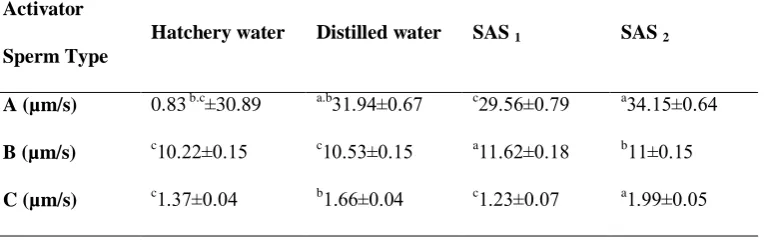
The highest VCL and VSL amounts in A and C type spermatozoids were related to
SAS2 (Tables 3 and 4). There were no
significant differences (P > 0.05, Table 3) regarding VCL amounts of C type
spermatozoids between SAS2 (1.40±....0
µm/s) and distilled water (1.41±....1
µm/s). Maximum amounts of VCL, VSL and Linearity movement of A type spermatozoa in different treatments were shown in Table 5.
Table 3: Effect of different activators on VCL of A, B and C type of spermatozoa in B. sharpeyi (µm/s)
SAS 2
SAS 1
Distilled water Hatchery water
Activator
Sperm Type
a14.2.±...4 b11.12±..44
b11.22±...8 b11.22±..4.
A (µm/s)
b21..8±..22 a21.2.±..11
c22..0±..21 b21.20±..24
B (µm/s)
a1.40±....0 c1..0±...01
a1.41±....1
b1.22±....
C (µm/s)
Table 4: Effect of different activators on VSL of A, B and C type of spermatozoa in B. sharpeyi (µm/s)
SAS 2
SAS 1
Distilled water Hatchery water
Activator
Sperm Type
a1..24±..2. c10.42±..20
a.b12.0.±..22
0.83 b.c±30.89
A (µm/s)
b22±..24
a22.21±..28 c2..41±..24
c2..11±..24
B (µm/s)
a2.00±...4
c2.11±...2
b2.22±....
c2.12±....
C (µm/s)
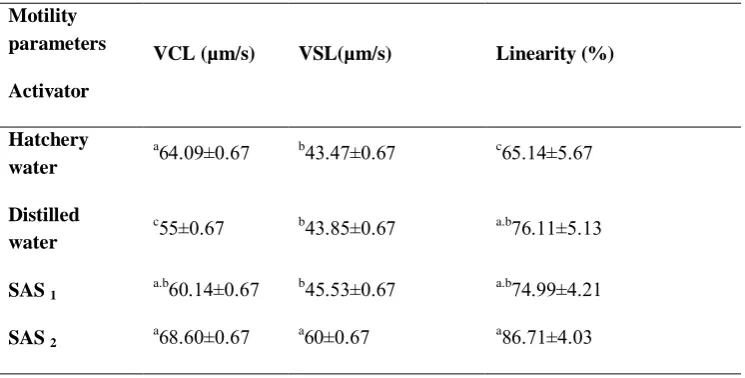
Table 5: Effect of different activators on maximum VCL, VSL and Linearity between A type spermatozoa of B. sharpeyi (µm/s)
Linearity (%) VSL(µm/s)
VCL (µm/s) Motility
parameters
Activator
c24.2.±4.22 b.1..2±..22
a2...0±..22
Hatchery water
a.b22.22±4.21 b.1.84±..22
c44±..22
Distilled water
a.b2..00±..12 b.4.41±..22
a.b2..2.±..22
SAS 1
a82.22±...1
a2.±..22
a28.2.±..22
SAS 2
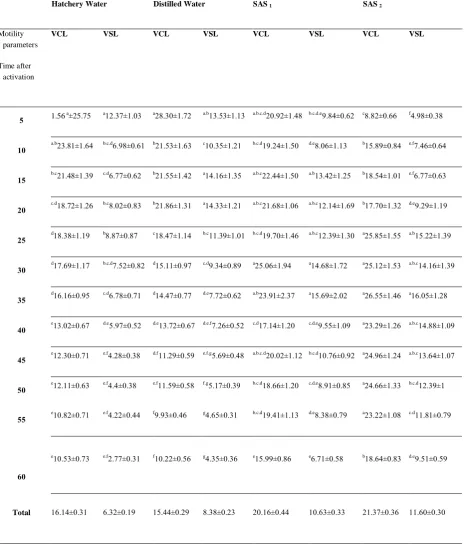
VCL and VSL amounts of B. sharpeyi
spermatozoa at various times after sperm activation by different solutions were shown in Table 6.
Table 6: Effect of activator solutions on VCL and VSL of B. sharpeyi spermatozoa at different times after sperm activation during their movement along (µm/s)
SAS 2
SAS 1
Distilled Water Hatchery Water VSL VCL VSL VCL VSL VCL VSL VCL Motility parameters Time after activation
f..08±..18 c8.81±..22
b.c.d.e0.8.±..21 a.b.c.d1..01±2..8
a.b21.41±2.21 a18.1.±2.21
a21.12±2..1
1.56 a±25.75
5
e.f2..2±..2. b24.80±..8.
d.e8..2±2.21 b.c.d20.1.±2.4.
c2..14±2.12 b12.41±2.21
b.c.d2.08±..22 a.b11.82±2.2.
01
e.f2.22±..21 b28.4.±2..2
a.b21..1±2.14 a.b.c11...±2.4.
a2..22±2.14 b12.44±2..1
c.d2.22±..21 b.c12..8±2.10
05
d.e0.10±2.20 b22.2.±2.11
a.b.c21.2.±2.20 a.b.c12.28±2..2
a2..11±2.12 b12.82±2.12
b.c8..1±..81 c.d28.21±2.12
01
a.b24.11±2.10 a14.84±2.44
a.b.c21.10±2.1. b.c.d20.2.±2..2
b.c22.10±2..2 c28..2±2.2.
b8.82±..82 d28.18±2.20
05
a.b.c2..22±2.10 a14.21±2.41
a2..28±2.21 a14..2±2.0.
c.d0.1.±..80 d24.22±..02
b.c.d2.41±..81 d22.20±2.22
01
a22..4±2.18 a12.44±2..2
a24.20±1..1 a.b11.02±1.12
d.e2.21±..21 d2...2±..22
c.d2.28±..22 d22.22±..04
05
a.b.c2..88±2..0 a11.10±2.12
c.d.e0.44±2..0 c.d22.2.±2.1.
d.e.f2.12±..41 d.e21.21±..22
d.e4.02±..41 e21..1±..22
01
a.b.c21.2.±2..2 a1..02±2.1.
b.c.d2..22±..01 a.b.c.d1...1±2.21
e.f.g4.20±...8 d.f22.10±..40
e.f..18±..18 e21.1.±..22
05
b.c.d21.10 ±2 a1..22±2.11
c.d.e8.02±..84 b.c.d28.22±2.1.
f.g4.22±..10 e.f22.40±..48
e.f...±..18 e21.22±..21
51
c.d22.82±..20 a11.11±2..8
d.e8.18±..20 b.c.d20..2±2.21
g..24±..12 f0.01±...2
e.f..11±.... e2..81±..22
55
d.e0.42±..40 b28.2.±..81
e2.22±..48 e24.00±..82
g..14±..12 f2..11±..42
e.f1.22±..12 e2..41±..21
01 ..1. ± 22.2. ..12 ± 12.12 ..11 ± 2..21 .... ± 1..22 ..11 ± 8.18 ..10 ± 24... ..20 ± 2.11 ..12 ± 22.2. Total
Results showed that in tap water the
highest VCL (14.24±2.42 µm/s) and VSL
(21.12±2..1 µm/s) were calculated at 5
seconds after sperm activation. Also 5 seconds after sperm activation in distilled water, the highest amount of VCL was
recorded (18.1.±2.21 µm/s), but the
lowest rate of VCL (0.01±...2 µm/s) was
observed 55 seconds after sperm
activation. The highest amount of VCL
(18.1.±2.21 µm/s) was calculated at 5
seconds after sperm activation. We also detected the highest VSL in distilled water
between 15 (2..22±2.14 µm/s) to 20
(2..11±2.12 µm/s) seconds after sperm
activation, whereas the lowest rate
(..14±..12 µm/s) was assessed after 60
seconds.
Also, the highest VCL (14..2±2.0.
µm/s) and VSL (24.20±1..1 µm/s) values
were recorded at 30 and 35 seconds after
activation of sperm in SAS1, respectively.
The results showed that SAS2 had the
highest VCL (12.44±2..2 µm/s) and VSL
values (22..4±2.18 µm/s) at 35 seconds
after sperm activation.
Discussion
Initial investigations of fertilization rate in
barbus fish of Iran, indicated that Barbus
sharpeyi had the lowest fertilization success, which also reported by Pyka et al. (2001). Also so far, there is no
comprehensive published information
about the effect of saline activator solutions on different sperm parameters of
B. sharpeyi. Present study provided useful
information about completing the in vitro
fertilization of B. sharpeyi. In some
species, environmental conditions cause stress in broodstock fish, thus optimum conditions for achieving sexual maturity and reproduction process may not be provided, and consequently, hormone application for inducing sexual maturity is mandatory )Metwally and Fouad, 2008(. It seems that this factor could be one of the
causes of low fertilization rate in B.
sharpeyi.
In fishes, period of sperm motility, velocity and duration of forward motility are affected by various parameters such as temperature, pH, ions (including sodium, potassium, calcium and ...), osmolality, dilution rate, season of stripping (Bobe and Labbé, 2009; Mylonas et al., 2010) and structure of spermatozoa (Psenicka et al., 2009). Understanding the effect of above-mentioned parameters would be useful to obtain the best method of artificial insemination (Alavi et al., 2007; Rosengrave et al., 2008).
Our results showed that spermatozoa activation with distilled and tap water caused more whirling movements, lower
VSL and VCL values (Figure 2 and Table
1), which can be occurred due to deformity of spermatozoa flagella with the unsuitable activators (Cosson et al., 1999). Also, Le Comber et al. (2004) reported that VSL of spermatozoa can be decreased through activation by distilled water.
However, presence of immotile
spermatozoa can affect motility ability of
normal spermatozoa and fertilization
capability (Aas et al., 1991). Also different
investigations of fish reproductive materials, especially fish sperm, showed that usage of saline activator solutions caused the protection of sperm flagella structure and increased the time of motility, thus researchers used these solutions instead of tap water for activating spermatozoa (Billard, 1992; Cosson et al., 1999; Kalbassi and Lorestani, 2007). Application of the saline
activator solutions including SAS1 and
SAS2 increased Linearity movement, VCL
and VSL values, which consequently led to elevation of incubation survival (Fig. 3), hatching (Fig. 4) and deformity rates (Fig. 5).
After activation of fish
spermatozoa, their movements will be started immediately in the straight path with very low curvature, but during the final stages of sperm motility or when sperm is in risk of contamination, or also when activation of spermatozoa with
unsuitable activators is performed,
spermatozoa path is more curved and consequently form concentric circles, in this regard, linearity and percentage of motile cells are assessed as indicators of fertilization ability (Rurangwa et al., 2004). In freshwater fish with external fertilization, spermatozoa are released into a hostile environment where they become generally activated, and survive for a short period of 1 to2 minutes (Holt and Van Look, 2004). In the present study, the duration of spermatozoa motility was recorded from 1 to 3 minutes after activation with the different activators (Table 1). Also, VCL and VSL values in
tap and distilled water strongly decreased through the time following activation, which is in accordance with results of Ravinder et al. (1997), while slower
decrease was detected by applying SAS1
and SAS2 (Table 6).
Alavi et al. (2009) reported that
qualitative parameters of Barbus barbus
spermatozoa declined suddenly after
activation; also, the highest period of motility was recorded under osmotic pressure of 215 to 235 mos.kg, but
activation of spermatozoa by SAS1 and
SAS2 under osmotic pressure of 188 to
189 mos.kg created the optimal conditions for extending the duration and forward
motility of B. sharpeyi spermatozoa
(Table 1).
In species with large egg size, any factor which causes a small decrease of spermatozoa motility can lead to fertility rate reduction (Kim et al., 2001). Results of incubation survival and hatching rate with use of tap water showed the lowest rates among treatments (Fig. 3 and 4). That can be related to the high level of C type spermatozoa percentage and low levels of VCL, VSL and A type spermatozoa (Tables 1 and 2). Also, VCL, VSL, duration of spermatozoa motility and percentage of motile cells were the lowest and that may relate to the higher consumption of energy and deformity of spermatozoa tail by tap and distilled water (Perchec et al., 1995, Cosson et al., 1999).
The lowest percentage of motile cells were obtained with use of tap water
for activation of spermatozoa compared with other treatments (Table 1), that also can lead to decline of fertilization rate in
B. sharpeyi. Among all treatments, tap water had the highest ALH (Table 1) and
sinusoidal path (Fig. 2), while SAS2 had
the lowest sinusoidal motion and the highest VCL, VSL, Linearity and motility
percentage. On the other hand, SAS2
caused the highest and lowest percentage
of A and C type spermatozoa,
respectively. Also, these factors may cause
the better state of SAS2 including
increasing the chances of fertilization and declining larval deformity rate. VCL and VSL amounts in tap water and VSL in distilled water reached their maximum levels at 5 seconds after spermatozoa activation and then declined rapidly (Table 6). Whereas, VCL had the highest rate during 25 to 55 seconds after activation of
sperm in SAS2 and remained constant
throughout that time. VCL and VSL in
SAS2 were about 1.5 and 4 times more
than those in tap water in 60 seconds after sperm activation, respectively. VCL and
VSL in SAS1 were more than in distilled
and tap water at the same time (Table 6). In common carp, VCL and percentage of mobile spermatozoa were equal to 139
µm/s and 98% in distilled water,
respectively (Linhart et al., 2005), but present study showed that VCL and motile
spermatozoa percentage in B. sharpeyi
were lower than that of common carp. VCL and VSL were almost the same in most freshwater fish (salmon, carp and cat fish) and average VCL was approximately
110 µm/s after the activation of
spermatozoa (Kim and Tveiten, 2002).
The velocity of spermatozoa is often low in marine fishes, for example, average of velocity is 75 µm/s in Atlantic Cod (Trippel and Nilson, 1992).
Asturiano et al. (2004) reported that VCL, VSL and percentage of
spermatozoa motility in Anguilla anguilla
were equal to 40, 12 µm/s and 40% respectively. Our results showed that the maximum VCL, VSL, and Linearity were
related to the application of SAS2 equaling
to 68.60, and 60 µm/s and 86.71%, respectively (Table 5). Christ et al. (1996) noted that VCL, VSL and motility percentage of common carp were 145, 60 µm/s and 60% respectively. Maximum VSL and motility percentage in A type
spermatozoa of B. sharpeyi in present
study were in accordance with findings of Christ et al. (1996) (Table 5).
Assessment methods of sperm quality based on computer-assisted sperm analysis (CASA) developed since 1980 and so far various ways for the sperm quality evaluation has been used and each of them
has advantages and disadvantages,
however, their settings and preparation of the software is based on human sperm quality assessment protocol (Kime et al., 2001; Pavlov, 2006; Liu et al., 2007).
Comparing to mammalian
spermatozoa, fish spermatozoa has not acrosome, but has a more complex path and motility period of less than one minute and so fish sperm analysis using CASA
methods requires adaptations for each species (Wilson Leedy and Ingermann, 2007). The most important advantage in the study of sperm quality with Image J software is its easy download way through
the website
http://rsb.info.nih.gov.ij.plugins.casa.html and it also can be used and planned based on conditions and characteristics of spermatozoa in different aquatic species (Wilson Leedy and Ingermann, 2007; Cabrita et al., 2008). A movie section used for computer analysis of sperm is different from 0.5 sec (Burness et al., 2005) to 1 minute (Trippel, 2003), but the best data usually will be achieved during 5 to 20 seconds after spermatozoa activation (Kim et al., 2001).
In conclusion, the experienced
saline activator solutions were able to affect the different sperm quality indices
and fertilization rate of B. sharpeyi. In this
regard, application of SAS1 and SAS2
could be recommended for improvement of propagation of this species in south of Iran. Also, due to high cost, complexity and hard accessibility of CASA software for most researchers, assessment of fish sperm quality with Image J software is recommendable.
Acknowledgments
The authors extend their thanks to Dr. Moghainami and Mr. Savari for providing facilities of this study. Also, we thank Dr. Pavlov, Dr. Coad, Dr. Al Mukhtar and the PhD student A. Banan for their useful guidance and help.
References
Aas, G. H., Refstie, T. and Gjerde, B., 1991. Evaluation of milt quality of Atlantic salmon. Aquaculture, 95: 125-132.
Alavi, S. M. H. and Cosson, J., 2005.
Sperm motility in fishes: (I) Effects of temperature and pH.
Cell Biology International, 29: 101-110.
Alavi, S. M. H., Mojazi Amiri, B., Cosson, J., Karami, M., Abd Alhay, H. A., Pourkazemi, M. and Akhoundzadeh, M. A., 2006. Determination of some seminal plasma indices, sperm density and sperm motility in the
Persian sturgeoun, Acipenser
persicus. Iranian Journal of Fisheries Science, 5 (2):1-18.
Alavi, S. M. H., Rodina, M., Policar, T. and Linhart, O., 2009.
Relationship between semen
characteristics and body size in
Barbus barbus L. (Teleostei: Cyprinidae) and effects of ions and osmolality on sperm motility. Comparative Biochemistry and
Physiology, Part A: Molecular
and Integrative Physiology, 153 (4): 430-437.
Alavi, S. M. H., Rodina, M., Policar, T., Kozak, P., Penicka, M. and Linhart, O., 2007. Semen of
Perca fluviatilis L.: Sperm
volume and density, seminal
plasma indices and effects of dilution ratio, ions and osmolality
on sperm motility.
Theriogenology 68: 276-283.
Al Mukhtar, M. A., 2009. Propagation
Planning and Hatchery
Construction for Bunnei (Barbus
Sharpeyi, Gunther 1874) in
Basra-Iraq. Mediterranean Aquaculture
Journal 2(2): 18-25.
Al Mukhtar, M. A., Saleh, J. H., Jaber, A. A. and Hatam, A., 2009. Artificial propagation and
fingerlings production of Barbus
sharpeyi (Gunther 1874) in Basrah during the spring of 2006.
Iraqi Journal of Agriculture,
(Special Issue), Volume 14,
Nomber 5: 187-193.
Al Mukhtar, M. A., Al Noor, S. S. and Saleh, J. H., 2006. General Reproductive Biology of Bunnei (Barbus sharpeyi Gunther, 1874) in Al Huwaizah Marsh,
Basra-Iraq. Turkish Journal of Fisheries
and Aquatic Sciences 6: 149-153.
Asturiano, J. F., Pérez, L., Garzón, D. L., Marco-Jiménez, F., Peñaranda, D. S., Vicente, J. S. and Jover, M., 2004. Physio-chemical characteristics of seminal and development of media and methods for the cryopreservation
of European eel sperm. Fish
Physiology and Biochemistry, 30, 283–293.
Billard, R., 1992. Reproduction in rainbow trout: Sex differentiation, dynamics of gametogenesis, biology
and preservation of gametes.
Aquaculture 100: 263-298.
Bobe, J. and Labbé, C. 2010. Egg and
sperm quality in fish. General and
Comparative Endocrinology, 165 (3): 535-548.
Bozkurt, Y., 2006. The relationship
between body condition, sperm
quality parameters and fertilization
success in rainbow trout
(Oncorhynchus mykiss). Journal of Animal and Veterinary Advances 5 (4): 284-288.
Burness, G., Moyes, C. D. and Montgomerie, R., 2005. Motility, ATP levels and metabolic enzyme activity of sperm from Bluegill (Lepomis macrochirus), Comparative Biochemistry Physiology, 140:11-17.
Cabrita, E., Robles, V., Sarasquete C. and Herráez, P., 2008. Basic
principles of fish spermatozoa
cryopreservation. In: Methods in Reproductive Aquaculture: Marine and Freshwater Species. Cabrita, E, Robles, V, Herráez, MP (Eds). CRC Press, Boca Raton, pp. 237-249.
Cejko, B. I., Kucharczyk, D., Targonska, K., Kubiak, D., Sarosiek, B. and Glogowski, J., 2008. Quality parameters and selected biochemical
markers of ASP, Aspius aspius (L.),
Semen obtained after hormonal
stimulation with ovaprim or ovopel.
Archives of Polish Fisheries, 16 (2): 179-188.
Christ, S. A., Toth, G. P., McCarthy, H. W., Torsella J. A. and Smith, M. K., 1996. Monthly variation in sperm motility in common carp assessed
using computer-assisted sperm
analysis (CASA). Journal of Fish
Biology, Volume48: 1210–1222.
Coad, B. W., 1995. Freshwater fishes of
Iran. Acta Science, National Academy
of Science Brno, 29 (1):1-64.
Cosson, J., 2004. The ionic and osmotic factors controlling motility of fish
spermatozoa. Aquaculture
International 12: 69-85.
Cosson, J., Billard, R., Gibert, C., Dreanno, C. and Suquet, M., 1999.
Ionic factors regulating the motility of
fish sperm. In the male gamete. From
basic to clinical application, C. Gagnon, (Ed). Cache Rive Press: 161-186.
Ebrahimi, M., 2005. Using computer assisted sperm analysis (CASA) to monitoring the effects of zinc and cadmium pollution on fish sperm.
Iranian Journal of Fisheries Science. 4 (2): 81-100.
Elofsson, H. K., Van Look, K., Borg, B. and Mayer, I., 2003. Influence of salinity and ovarian fluid on sperm
motility in the fifteen-spined
stickleback. Journal of Fish Biology,
63: 1429–1438.
Fauvel, C., Suquet, M. and Cosson, J., 2010. Evaluation of fish sperm
quality. Journal of Applied
Ichthyology, 26: 636–643.
Holt, W. V. and Van Look, K. J. W.,
2004. Concepts in sperm
heterogeneity, sperm selection and
sperm competition as biological
foundations for laboratory tests of
semen quality. Society for
Reproduction and Fertility, Vol.
127:527-535.
Horváth, A., Miskolczi, E., Mihalffy, S. O. K., Szabo, K. and Urbanyi, B., 2007. Cryopreservation of common
carp (Cyprinus carpio) sperm in 1.2
and 5.0 ml straws and occurrence of haploids among larvae produced with
cryopreserved sperm. Cryobiology,
Volume, 54: 251–257.
Jing, O., Huang, C., Bai, C., Tanguay, R. and Dong, Q., 2009. Optimization of activation, collection, dilution, and storage methods for zebrafish sperm. Aquaculture, 290: 165–171.
Kahkesh, F. B., Yooneszadeh
Feshalami, M., Amiri, F. and Nickpey, M., 2010. Effect of Ovaprim, Ovatide, HCG, LHRH-A2,
LHRHA2+CPE and Carp Pituitary in
Benni (Barbus sharpeyi) Artificial
Breeding. Global Veterinaria 5 (4):
209-214.
Kalbassi, M.R. and Lorestani, R., 2007.
Effect of different diluents solutions on the duration of sperm motility in
rainbow trout (Oncorhynchus mykiss).
Journal of Agricultural Science and Natural Resources, 13(6), 132-142.
Kim, D. E. and Tveiten, H., 2002.
Unusual motility characteristics of
sperm the Spotted Wolffish. Journal
of Fish Biology, 61: 1549-1559.
Kime, D. E., Van Look, K. J. W., McAllister, B. G., Huyskens, G., Rurangwa, E. and Ollevier, F., 2001. Computer-assisted sperm
analysis CASA as a tool for
monitoring sperm quality in fish.
Comparative Biochemistry and
Physiology, Part C 130, 425-433.
Krol, J., Glogowski, J., Demska-Zakes, K. and Hliwa, P., 2006. Quality of semen and histological analysis of
testes in Eurasian perch Perca
fluviatilis L. during a spawning
period. Czech Journal of Animal
Science, 51, (5): 220–226.
Lahnsteiner, F., Berger, B., Weismann, T. and Patzner, R. A., 1996. Motility
of spermatozoa of Alburnus alburnus
(Cyprinidae) and its relationship to
seminal plasma composition and
sperm metabolism. Fish Physiology
and Biochemistry, 15, 167-179.
Le Comber, S. C., Faulkes, C. G., Van Look, K. J. W., Holt, W. V. and Smith, C., 2004. Recovery of sperm activity after osmotic shock in the three-spined stickleback: implications
for pre-oviposition ejaculation.
Behaviour, Volume 141:1555–69.
Linhart, O., Rodina, M., Gela, D., Kocour, M. and Vandeputte, M., 2005. Spermatozoal competition in
common carp (Cyprinus carpio): what
is the primary determinant of
competition success? Reproduction,
130: 705–11.
Lorestany, R., Ahmadi, M. R. and Kalbassi, M. R., 2006. Effect of male
age in Rainbow Trout (Oncorhynchus
mykiss) on duration of sperm motility, spermatocrit and eyed egg rate
production. Iranian Scientific
Fisheries Journal, 15 (1): 119-128.
Liu, Q. H., Li, J., Xiao, Z. Z., Ding, F. H., Yu, D. D. and Xu, X. Z., 2007.
Use of computer-assisted sperm
analysis (CASA) to evaluate the quality of cryopreserved sperm in red
seabream (Pagrus major).
Aquaculture, 263:20–25.
Marammazei, J.G., Mustafa, A. and Al
Mukhtar, M.A., 2000. The
occurrence, feeding and reproduction
of three Barbus spp. In: Shadigan
Marsh. The First National Scientific
Conference on Barbus spp. (ed. by
South of Iran Aquaculture Research Center), pp. 50.
Metwally, M. A. A. and Fouad, I. M., 2008. Some Biochemical Changes Associated with Injection of Grass
Carp (Ctenopharyngodon idellus)
with Oviaprim and Pregnyl for Induction of Artificial Spawning.
Global Veterinaria, 2 (6): 320-326.
Mohamadian, T., Kouchenin, P., Niko, S., Sheykh Aleslami, M., Bita, S., Eskandari, G. R. and Abhari Seh Gonbad, H., 2009. Comparison of the effectiveness GnRH hormone (OVA-FACT) and carp pituitary extract on
reproduction indexes of Barbus
shaepeyi. Scientific Research Iranian Veterinary Journal, 5 (2 (23): 70-80.
Mylonas, C. C., Fostier, A. and Zanuy, S., 2010. Broodstock management and hormonal manipulations of fish
reproduction. General and
Comparative Endocrinology, 165: 516-534.
Pavlov, D.A., 2006. A Method for the
Assessment of Sperm Quality in Fish.
Journal of Ichthyology, Vol. 46, No. 5: 391-398.
Perchec, G., Jeulin, C., Cosson, J., Andre, F. and Billard, R., 1995.
Relationship between sperm ATP
content and motility of carp
spermatozoa. Journal of Cell Science,
108: 747-753.
Psenicka, M., Vancova, M., Koubek, P., Tesitel, J. and Linhart, O., 2009.
Fine structure and morphology of
sterlet (Acipenser ruthenus L. 1758)
spermatozoa and acrosin localization.
Animal Reproduction Science, 111 (1): 3-16.
Pyka, J., Bartel, R., Szczerbowski, J. A. and Epler, P., 2001. Reproduction of
gattan (Barbus xanthopterus Heckel),
shabbout (Barbus grypus Heckel) and
bnni (Barbus sharpeyi Gunther) and
rearing stocking material of these
species. Archives Polish Fisheries,
Vol. 9: 235-246.
Ravinder, K., Nasaruddin, K.,
Majumdar, C. and Shivaji, S., 1997.
Computerized analysis of motility,
motility patterns and motility
parameters of spermatozoa of carp
following short-term storage of
semen. Journal of Fish Biology,
50:1309–28.
Rosengrave, P., Taylor, H.,
Montgomerie, R., Metcalf, V., McBride, K. and Gemmell, N. J., 2008. Chemical composition of seminal and ovarian fluids of chinook
salmon (Oncorhynchus tshawytscha)
and their effects on sperm motility traits. Comparative Biochemistry and Physiology, Part A: Molecular and Integrative Physiology, 152 (1): 123-129.
Rurangwa, E., Kime, D. E., Ollevier, F. and Nash, J. P., 2004. The measurement of sperm motility and factors affecting sperm quality in
cultured fish. Aquaculture, 234:1–28.
Trippel, E. A., 2003. Estimation of male reproductive success of Marine fishes.
Journal of Northwest Atlantic Fishery Science, 33: 81-113.
Trippel, E. A. and Neilson, J.D., 1992.
Fertility and sperm quality of virgin and repeat-spawning Atlantic Cod (Gadus morhua) and associated
hatching success. Canadian Journal of Fisheries and Aquatic Sciences, 49: 2118-2127.
Utarabhand, P. and Watanakui, V., 1998. Effects of ion content and pH
medium on motility of tilapia
(Oreochromis niloticus) sperm.
Journal of Sciences Society Thailand, 24: 1-10.
Verma, D. K., Routray, P., Dash1, C., Dasgupta, S. and Jena, J. K., 2009.
Physical and Biochemical
Characteristics of Semen and
Ultrastructure of Spermatozoa in Six
Carp Species. Turkish Journal of
Fisheries and Aquatic Sciences 9:67-76.
Wilson-Leedy, J. G. and Ingermann R. L., 2007. Development of a novel CASA system based on open source
software for characterization of
zebrafish sperm motility parameters.
Theriogenology, 67: 661–672.