IDENTIFICATION OF ROAD CRASH BLACK-SITES USING
GEOGRAPHICAL INFORMATION SYSTEM
Rouzbeh Shad1, Shahriar Rahimi2
1 Civil Department, Engineering Faculty, Ferdowsi University of Mashhad, Iran 2 Civil Department, International Campus, Ferdowsi University of Mashhad, Iran
Received 24 May 2017; accepted 20 July 2017
Abstract: It is a crucial task to reduce road crashes by performing analyses and taking appropriate countermeasures to save lives. It has been a major issue for many people and government to reduce the amount of road collisions especially in Iran, since it could be a great threat to this country. Identification of crash black-sites is one of the most important fields in road safety studies. Many highway agencies have been using Geographical Information System (GIS) for analyzing crash data. The GIS based application integrates the information collection capabilities with the visualization. In this paper, Incident features like location, date, type of vehicle involved, and number of persons injured or died are imported in the GIS database. Then, Kernel density is to apply on the prepared data. The main objective is to specify road crash black-spots considering all types of traffic crashes based on their severity using Kernel Density through GIS environment. The results show that more severe crashes take place further from the cities than accidents with only property damages. Also, overlaying all crash types using the suggested SI (severity index) method will generate crash black-sites map which policy makers can use to determine accident-prone zones and take appropriate interventions.
Keywords: GIS, accident-prone zones, severity index, kernel density, road safety.
1 Corresponding author: [email protected]
1. Introduction
Every day over 3400 people die on the world’s roads and tens of millions of people are injured or disabled every year. Road traffic crashes claim more than 1.2 million lives each year and have a huge effect on health and development. In addition to deaths on the roads, up to 50 million people suffer nonfatal injuries each year as a result of road trauma, while there are additional indirect health consequences that are associated with this epidemic. Road traffic injuries are currently estimated to be the ninth leading cause of death globally, and are predicted to become the seventh
action to combat this global challenge has been insufficient (WHO, 2015).
Iran’s share of road crashes is more critical than most countries. It has been estimated that the cost of traffic accidents in Iran was about 7 percent of the country’s GDP in 2013. According to official reports in Iran
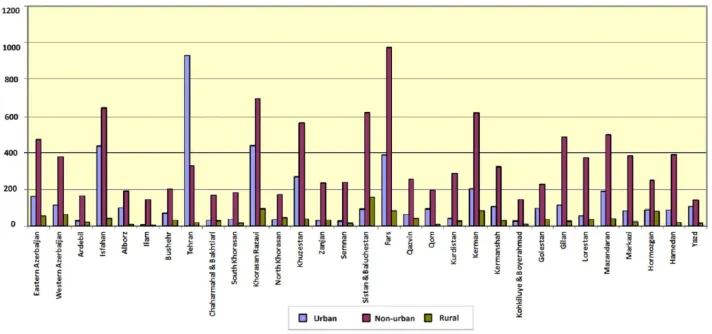
from March 2014 to March 2015 (1 Iranian year) traffic accidents fatalities was 16872 people, from which 10951 people (64.9% of the total fatalities) have been killed in non-urban road crashes. Following figure (see Fig. 1) shows accident fatalities per province in Iran from March 2014 to March 2015 (1 year period) )RMTO, 2015(.
Fig. 1.
Crash Counts in Provinces of Iran Based on the Road’s Type Source:(RMTO, 2015)
One of the most important problems that traffic officials face is where and how to implement precautionary measures and provisions so that they can have the most significant feedback for traffic safety (Erdogan et al., 2008). Site ranking is essential in designing engineering programs to improve safety of a road network. The sites with potential for safety treatments are also known as sites with promise, crash black-sites or hotspots (Huang et al., 2009; Sorensen and Elvik, 2007).
By identifying road crash black-sites, using Geographical Information Systems (GIS) and appending value added data, a more
potent understanding can be gained, with regards to indicators of casual effects. GIS is a technology for modeling, processing and managing land base and related information (Longley et al., 2005). After identification of incident black-sites, vital improvements could be applied to the selected areas with limited highway budgets. This improves road safety and ensures cost effectiveness in resource allocation.
consider road trauma in site ranking, because the cost of road crashes could be hugely different at different levels of severity. This means that, for instance, a road segment with higher frequency of fatal accidents may be considered more hazardous than a road segment with more serious or slight injury accidents but, fewer fatal accidents therefore it is crucial to estimate crash frequency for each severity category (Hu et al., 2010).
Geographic information system (GIS) has been identified as a system of linking a large number of various databases. GIS is also a potential tool for generating maps which present a clear and immediate impression of the crash distribution on the road network, identifying those areas that have incident concentrations (Alam and Ahsan, 2013). According to the spatial nature of disparate databases needed for traffic safety analysis, the GIS would be a good choice to integrate them. In order to integrate crash information with other relevant data like roadway characteristics, GIS provides a platform to facilitate data integration, analysis and demonstration of results. (Kumaresan et al., 2009).
The main objective of this paper is to discuss Kernel Density Estimation (KDE advantages) and then determine traffic crash clusters in GIS using this method. Later; an equation is developed that can consider and model all severity types of traffic crashes (Severity Index) based on each accident severity. Using SI results (Severity Index equation) each kernel maps for each accident severity is overlaid in GIS environment in order to determine crash black-sites in the study area.
The paper is organized as follows: Firstly in the next section a summary of pervious
researches considering the same criteria is provided; and then the methodology employed in this paper is described. This includes both accident frequency based on severity to determine black-sites, introducing the study area, describing the SI model and description of statistics used in this paper. It is then followed by the description of the modeling results. Discussion is then provided and finally conclusions are drawn.
2. Literature Review
safety index through the combination of the following indicators: severity of crashes and crash costs. In addition to the road network classification, the use of the model allows to evaluate the spatial coverage of incidents in order to indicate the centrality and distribution of the areas with the highest occurrence of road crashes.
(Prasannakumar et al., 2011) with the evaluation of spatial characteristics of the crash data by Moran’s I method demonstrated that crash datasets, as a whole, are classified as clustered in nature. Kernel estimation is able to determine black-sites from huge datasets, hence present an analytical adequate result. The benefits of these surface representations specifically of traffic crashes are that they can provide a more realistic continuous model of crash black-sites patterns indicating density changes which are often difficult to produce using geographically constrained boundary based models like the road network. The major benefit for this specific technique is indicating the extent of risk of an incident, defined earlier. Generally in defining a cluster, the surrounding buffer is ignored which will basically impose an amount of exposure to incident for those who enter it. This amount of exposure would not be considered employing the clustering methods (Anderson, 2007). Also (Çela et al., 2013) used the Network Kernel function to determine whether or not there was a tendency towards clustering in the whole crash dispersion. In addition to approving the patterns of the number of crashes, the Network Kernel function was used to find where the concentrations were actually created. Spatial clusters can be additionally used for pattern discovery in Geographical Information System (Turton and Openshaw, 2001). (Pino-Díaz et al., 2012) developed a
flexible procedure to evaluate proximity in terms of both time and space of the happening of crashes. On dense networks with dispersed traffic, 2D clustering methods based only on proximity function better than linear techniques. Edge effects are restricted to the boundary of the study area (Steenberghen et al., 2004). Some critiques of KDE dispute the fact that it considers discrete phenomenon as a continuous area. However this paper is also concerned with the extent of risk in an area (the risk of crash occurrence). Geographically crashes will happen over a given surface not just at a single point because crash reasons can be traced to the whole effective area. KDE provides an approach which considers this concept of extent of crash risk. However one major disadvantage resumes, which relates to indicating the statistical importance of the resulting concentrations (Anderson, 2009).
3. Methodology
3.1. Kernel Density in GIS
The use of GIS environment for the identification of crash ‘black-sites’ includes: 1- the implementation of crash locations on a map and 2- the determination of statistically significant spatial concentrations of crashes.
around a specified accumulation in which there is an increased probability for an event to happen according to spatial dependency. On the other hand, by using kernel density function, a desired spatial unit of analysis can be determined and be homogenous for the whole surface which makes comparison and finally classification possible. Kernel density estimation procedure includes placing a symmetrical area over each point and then calculating the distance from the point to a reference location based on a mathematical function and then summing the value for all the areas, including those at which no accidents of the indicator variable were recorded, for that certain location. This process is repeated for successive points (Sun et al., 2012). Hence this process grants the ability to place a kernel over each event, and the sum of these individual kernels gives the density estimate for the distribution of road crashes (Fotheringham et al., 2000).
The impact of placing these kernels or humps over the incidents is to produce a continuous and smooth area (Potoglou, 2008). Density can be measured by two methods; simple and kernel (Anderson,
2009). Kernel density estimation method, applied to point distribution on a plane, is the Network Kernel Method that calculates the density in a linear unit which estimates the density points on a network based on formula (Fotheringham et al., 2000):
(1)
where f (x, y) is the density estimate at the location (x, y); n is the number of incidents, h is the kernel size or bandwidth, K is the kernel function, and di is the distance between the location (x, y) and the location of the ith incident.
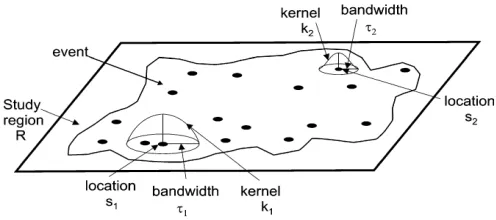
The kernel approach separates the whole research area into specified number of cells. The kernel method draws a circular neighborhood around each feature point (accidents), instead of contemplating a circular neighborhood around each cell like the simple method. Then a mathematical equation is used that goes from 1 at the position of the feature point to 0 at the neighborhood boundary (see Fig. 2).
Fig. 2.
This process calculates the density of incident points around each output grid cell. The density (D) of a cell is determined as the value (number of accidents (n) multiplied by weight) of crashes per unit area.
In this paper after a number of tests using Point Density in Spatial Analyst Tools in
GIS environment, bandwidth of 500 m and cell size of 1 km were selected.
3.2. Structure
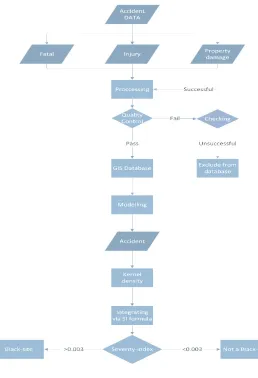
As it can be seen in Fig. 3 the process of this research is summarized in a flowchart to provide a better understanding of data, process, and objectives of this paper.
3.3. Severity Index Model
Since the crash severity is categorized in nature (ranging from non-injury or property damage to fatal), it appears essential to choose discrete ordered response models for evaluating crash severity data. Samples of previous researches employing ordered response models include (Eluru et al., 2008; Quddus et al., 2009). Crash data for Khorasan Razavi province of Iran from police reports were collected and included in the GIS database from March 2010 to March 2015 (5 year) based on accident counts and severity in 3 category (Fatal, Injury & property damage). DATA considering various types of injury accidents severities was not available to include in modeling. There weren’t any major changes in roads geometrics over the years. Also roads built after 2010 are excluded from modeling process. For determining black-sites in study area, a density function for each severity level in GIS processing with the search radius of 500 meter is to be used. Finally, density maps overlay according to the following Severity-Index formula (See Eq. (2)) )Ayati and Vahedi, 2008(:
(2)
To consider crash severity in black-sites identification, three crash severity classes (property damage, injury, and fatal) are included in Severity-Index formula (See Eq. (2)). Each category has its own coefficient in Eq. (2). Coefficients demonstrate the impact of each category on the creation of black-sites. It’s reasonable that as the severity increases the coefficient should also increase. Thus, for fatal accidents 16, for injury accidents 3, and for property damage accidents 1 is considered as coefficient in Eq. (2). The road segment with SI over 60 is considered as a black-site. The limit 60 is indicated according to 1000 meter segment length, through consulting and field work suggested by )Ayati and Vahedi, 2008(.
The most vital stage of the research is detailed registration of crash data. In this study, 110150 accidents data from March 2010 to March 2015 (3075 Fatal, 31987 Injury & 75088 property damage accidents), obtained from the Khorasan Razavi province Police Department is to be used. Accidents statistics are shown in Table 1.
Table 1
The Number of each Crash Type per Year
1stYear
2ndYear
3rdYear
4th Year
5thYear
19083 14657
14550 14014
12784 Property
damage
7621 6513
5614 6953
5286 Injury
770 682
521 568
534 Fatal
3.4. Study Area
Fig. 1 and Table 1 stress the necessity to initiate immediate actions for Khorasan Razavi province with the second rank of
tourists coming from abroad, traffic density increases drastically. Mashhad in Khorasan Razavi province is the second largest and most populated city of the country. Khorasan Razavi province has 111 Km of freeways, 1015 Km of expressways, 1240 Km of main arterial roads and 3960 Km of secondary arterial roads. 8927 million person-kilometer travel have been made from/to and 4831 million person-kilometer travel have been made through the province. 15556 million Ton-kilometer goods have been delivered from/to and 8528 million Ton-kilometer goods have been delivered through the province. According to statistics in 2015, with 760 losses of lives in traffic accidents the state is second in the rank of total accident rates after Tehran, second in the rank of
mortality rates after Fars, second in the rank of injuries after Tehran.
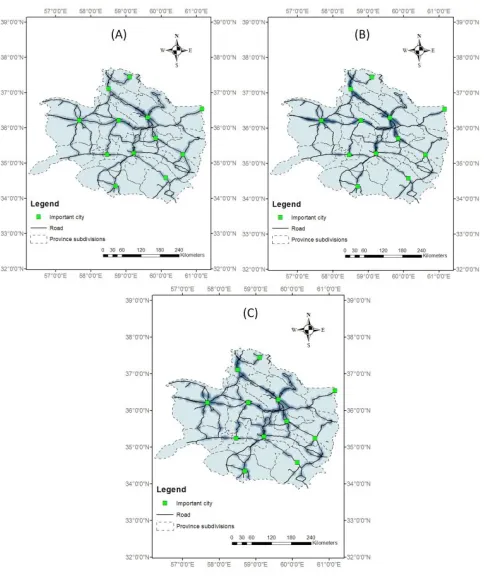
The region has been one of the most important transport areas with neighbor countries for a long time, thus it has above average heavy vehicle ratio than other provinces in Iran which increase traffic crashes severity. Having a smooth topography (mostly flat plains with few foothill areas) and straight routes enables high-speed traffic. Thus, in addition road trauma is inevitable, and the severity of crashes and losses is at a very disturbing level. Fig. 4 shows the study area and its roads on the map and it demonstrates the concentration of important cities in the province.
Fig. 4.
Study Area (Khorasan Razavi Province, Iran)
4. Results and Discussion
4.1. Accidents Frequency
Crash data provides a good infrastructure for the prevention of road trauma. In this
fatal, injury, and property damage) density values for each class is calculated with a 500 meter bandwidth for mentioned time period
(5 years) and study area (Khorasan Razavi province) based on the kernel function (see Fig. 5).
Fig. 5.
Crash Density Maps
Fig. 5 indicates the density values for each category in the processing extent (Study area). Fig. 5. A,B,C, respectively, shows
density for property damage, injury, and fatal accidents. Fig. 5.A shows nearby cities the number of non-injury crashes increases dramatically because closer to cities traffic increases and thus the probability of incident. Also, uncontrolled road exits and entrances, uncontrolled roadside access, and pedestrians on the road, are another reasons for property damage crashes increase
(Rodrigues et al., 2015) showed it is possible to categorize segments of the road network according to levels of road safety based on crash Severity Indexes and to implement a broad set of evaluation over a large study area. Also, this approach can be applied to approve the planning of counter measures intended to improve road safety of a certain area considering economic restraints. As mentioned above, this paper concludes the same results, that kernel density estimation is an appropriate tool to model crashes in Geographical Information System. Mainly because not only it determine accidents clusters in road network but also indicates accidents risks in surrounding areas. This can be employed in policy making for creating safer road side for pedestrians or businesses alongside the road.
4.1. Black-sites Determination
Identification of black-sites is a process to detect high density crash locations within the
road network. However, for practical reasons the black-site definition is stated very simply. Crash black-site evaluation intends to help the determination of areas with unusual high concentration of crash occurrence. There is a wide range of data in the previous researches as to what a crash black-site is and how it is identified or predicted spatially and numerically. According to (Hauer, 1996) some researchers use crash occurrence frequency, some rank areas by crash rate while others use a combination of these two. Nevertheless, the most commonly used approach to indicate whether a location has a safety problem is based on the road crash history and determination of the “black-site”. Also, the whole crash prevention procedure is often referred to black-sites improvement. In this paper, to consider both frequency and severity of collisions in black-sites determination, accident density maps in each category is overlaid within GIS process using Severity-Index formula (Eq. (2)).
Fig. 6 demonstrates crashes black-sites (red zones in the map) calculated based on Severity-Index formula (Eq. (2)). Red zones (known as very high risk) in Fig. 6 indicate black-sites or areas where SI exceeds the upper limit of 60. Yellow areas indicate high risk zones where SI -index is approximately 45-60. Green areas or medium risk zones are where SI-index is approximately 30-45. White areas show zones with low risk of road crash (Severity-index is below 20). The reason that there is no risk free area in the map is, that travel is an inherently risky activity, because movement creates kinetic energy, and if there is an accident and collision, the energy exchange can be damaging to both humans and property. As it can be seen in Fig. 5 most black-sites are within the distance of 20-30 kilometer of cities. There various reasons for this concentration of black-sites in the entrance of cities. Most important reasons are that these areas have many uncontrolled access, intersections, and crossroads for farms, factories, villages, and small cities. The other reasons for accidents in these black-sites are usually based on human errors, mostly because of driver’s weariness. To determine driver’s fatigue, a series of emotive phrases such as: “we are almost there” and “just a little bit further” are usually deemed.
From the data evaluated in (Alam and Ahsan, 2013), the most hazardous area identified is a 2.7 kilometer long segment which was from 11.0 kilometer to 13.7 kilometer from city’s midpoint. At the starting of this segment of the road there was a petrol pump and at the end of the segment a spinning mill was found. In a city’s road network with high density traffic, crash locations are generally based on proximity aspects. In these environments, 2D clusters may propose causal relationships. A sample is the detection of
crash concentrations near access roads. These indications are very similar to this paper results as discussed above. The majority of these determined black-sites were cross roads for villages and small cities. The first urgent measure for these locations is to increase traffic road signalization and then to make safe intersection arrangements or increasing the number of lanes within the road segment.
5. Conclusions
The issue of ranking potential crash locations or detecting black-sites is perhaps a difficult problem. From the policy making point of view, a solution to this issue can have a substantial impact on society, not only because it can reduce the crashes on a particular site but, at the same time, it can prevent budgets to be allocated to the wrong locations. With a proper set up of a GIS, traffic agencies can retrieve, analyze and demonstrate crash data and spatial attributes of this data. This system has a lot of benefits such as quick access for gathering information, data storage, integrity, and output. Using the Geographical Information System (GIS) is useful in displaying of the crash locations on the map. At the same time, because of the loss of lives and the loss of large amount of resources, the researches aiming to prevent the traffic accidents are very popular in developing countries. In this situation, it is very important to forecast the probability of the occurrence of accidents. Traffic accident analysis is a very complex topic due to existence of many factors affecting accidents spatially. Traffic accident reports must be more detailed and formatted properly for spatial and statistical analysis.
determines casual indicators more likely to be present at certain clusters, therefore being able to compare across time and space. The kernel density estimation method enabled an overarching visualization and manipulation of the accidents based on density which was used in turn to create the basic spatial unit for the black-site clustering method. The classification of road accident black-sites in road safety, still remains an important and yet under developed theme.
Results of this paper conclude that exploring and taking advantage of a GIS toolset revealed to be a valuable tool to define and validate the proposed model. On one hand, it was possible to classify segments of the road network in accordance with levels of road safety based on accident Severity Indexes and to apply a large set of analysis over a wide study area. On the other hand Kernel Density Estimation tool in GIS offers a method which takes into account the spread of accident risk. Therefore, KDE is an appropriate method to model accidents. Also GIS is capable of overlaying models of accidents with different severity based in their given coefficient. Final determined traffic accidents black-sites on non urban areas indicated that these places were usually uncontrolled road sides, intersections, and crossroads located within the distance of 20-30 kilometer of city’s centers.
References
Alam, M.; Ahsan, H.M. 2014. Identification and Characterization of Hazardous Road Locations on Dhaka-Chittagong National Highway, Global Journal of Research In Engineering 13(4): 17-26.
Anderson, T. 2007. Comparison of spatial methods for measuring road accident ‘hotspots’: a case study of London, Journal of Maps 3(1): 55-63.
Anderson, T.K. 2009. Kernel density estimation and K-means clustering to profile road accident hotspots,
Accident Analysis & Prevention 41(3): 359-364.
Ayati, E.; Vahedi, J.R. 2007. Developing Bridge Safty Index Model for Iran, Engineering Faculty Journal of Ferdowsi University of Mashhad 19: 135-51.
Bailey, T.C.; Gatrell, A.C. 1995. Interactive spatial data analysis. Essex: Longman Scientific & Technical. USA. 413 p.
Bhalla, P.; Tripathi, S.; Palria, S. 2014. Road Traffic Accident Analysis of Ajmer City Using Remote Sensing and GIS Technology. In Proceedings of the International Archives of Photogrammetry, Remote Sensing and Spatial Information Sciences, 40(8): 1455-1462.
Çela, L.; Shiode, S.; Lipovac, K. 2013. Integrating GIS and spatial analytical techniques in an analysis of road traffic accidents in Serbia, International Journal for Traffic and TransportEngineering 3(1): 1-15.
Chainey, S.; Ratcliffe, J. 2013. GIS and crime mapping. John Wiley & Sons. USA. 442 p.
Eluru, N.; Bhat, C.R.; Hensher, D.A. 2008. A mixed generalized ordered response model for examining pedestrian and bicyclist injury severity level in traffic crashes, Accident Analysis & Prevention 40(3): 1033-1054.
Erdogan, S.; Yilmaz, I.; Baybura, T.; Gullu, M. 2008. Geographical information systems aided traffic accident analysis system case study: city of Afyonkarahisar,
Accident Analysis & Prevention 40(1): 174-181.
Fotheringham, A.S.; Brunsdon, C.; Charlton, M., 2000.
Quantitative Geography: Perspectives on Spatial Data Analysis. SAGE Publications. Ireland. 267 p.
Hauer, E. 1996 Identification of sites with promise,
Hu, S.R.; Li, C.S.; Lee, C.K. 2010. Investigation of key factors for accident severity at railroad grade crossings by using a logit model, Safety science 48(2): 186-194.
Huang, H.; Chin, H.; Haque, M. 2009. Empirical evaluation of alternative approaches in identifying crash hot spots: naive ranking, empirical Bayes, and full Bayes methods, Transportation Research Record: Journal of the Transportation Research Board (2103): 32-41.
Kumaresan, V.; Vasudevan, V.; Nambisan, S. 2009. Development of a GIS-based Traffic Safety Analysis System. In Proceedings of the Annual ESRI International User Conference, 13-17.
Longley, P.; Goodchild, M.F.; Maguire, D.; Rhind, D. 2010. Geographic information systems and science. John Wiley & Sons. USA. 526 p.
Pino‐Díaz, J.; Jiménez‐Contreras, E.; Ruíz‐Baños, R.; Bailón‐Moreno, R. 2012. Strategic knowledge maps of the techno‐scientific network (SK maps), Journal of the Association for Information Science and Technology 63(4): 796-804.
Potoglou, D. 20 08. Vehicle-t y pe choice and neighbourhood characteristics: An empirical study of Hamilton, Canada, Transportation Research Part D: Transport and Environment 13(3): 177-186.
Prasannakumar, V.; Vijith, H.; Charutha, R.; Geetha, N. 2011. Spatio-temporal clustering of road accidents: GIS based analysis and assessment, Procedia-Social and Behavioral Sciences 21: 317-325.
Quddus, M.A.; Wang, C.; Ison, S.G. 2009. Road traffic congestion and crash severity: econometric analysis using ordered response models, Journal of Transportation Engineering 136(5): 424-435.
RMTO. 2015. Statistical Yearbook of Road Maintenance and Road Transportation Organization. Ministry of Roads and City Planning. Iran.
Rodrigues, D.S.; Ribeiro, P.J.G.; da Silva Nogueira, I.C. 2015. Safety classification using GIS in decision-making process to define priority road interventions, Journal of Transport Geography 43: 101-110.
Sorensen, M.; Elvik, R. 2007. Black Spot Management and Safety Analysis of Road Networks. Institute of transport economics. Norway. 118 p.
Steenberghen, T.; Dufays, T.; Thomas, I.; Flahaut, B. 2004. Intra-urban location and clustering of road accidents using GIS: a Belgian example, International Journal of Geographical Information Science 18(2): 169-181.
Sun, Y.; Chang, H.; Miao, Z.; Zhong, D. 2012. Solution method of overtopping risk model for earth dams, Safety science 50(9): 1906-1912.
Turton, I.; Openshaw, S. 2001. 2 Methods for automating the geographical analysis of crime incident data, Mapping and Analysing Crime Data: Lessons from Research and Practice
11-26.
Wang, C.; Quddus, M.A.; Ison, S.G. 2011. Predicting accident frequency at their severity levels and its application in site ranking using a two-stage mixed multivariate model, Accident Analysis & Prevention
43(6):1979-1990.