Engineering
Volume 2, 2018, Pages 43–55
SUMO 2018- Simulating Autonomous and Intermodal Transport Systems
Monaco SUMO Traffic (MoST) Scenario:
A 3D Mobility Scenario for Cooperative ITS
Lara CODEC ´
A
1and J´
erˆ
ome H ¨
ARRI
1EURECOM - Communication Systems Department 06904 Sophia-Antipolis, France
[codeca, haerri]@eurecom.fr
Abstract
Cooperative Intelligent Transportation Systems (C-ITS) are a viable solution when it comes to the optimization of the ever-growing population moving in the cities. C-ITS studies have to deal with telecommunications issues and location errors due to the urban environment, while keeping into account realistic mobility patterns. A detailed and state of the art scenario is complex to generate and validate. There is a trade-off between precision and scalability. Additionally, precise information may be problematic to obtain or use due to privacy issues. There are some general-purpose freely-available scenarios, but none of them provides a 3D environment with intermodal traffic. Nonetheless, the 3D environment is a requirement to have reliable C-ITS simulations in a realistic setting, and the importance of intermodal mobility cannot be overlooked in planning the future of smart cities. The Monaco SUMO Traffic (MoST) Scenario aims to provide a state of the art 3D playground with various kind of vehicles, vulnerable road users and public transports to test C-ITS solutions. This paper presents the data requirements, characteristics, possible use cases, and finally, the limitations of MoST Scenario.
Keywords 3D Traffic Scenario, Intermodal Transport Planning, Cooperative Intelligent Transportation Systems
1
Introduction
Our cities are complex systems in constant evolution. The information that is collected from various sources is enhancing our view and understanding of their dynamics. C-ITS are using mobility information from vehicles and vulnerable road users to improve traffic and the quality of life in the cities and their surroundings. This objective requires understanding not only of traffic flows theory and telecommunications, but also human behavior and social interactions.
telecommunication simulators, and their possible interaction. In literature we can find surveys such as [1] and [2] that are able to provide a good overview on the different mobility and network simulators available to the scientific community, with their pros and cons, depending on the task at hand.
To appeal at the largest audience, we chose Simulator of Urban MObiltiy (SUMO) [3] as mobility simulator because its community is very active on Intelligent Transportation Systems (ITS) topics and it provides a socket interface that allows easy communication with other sim-ulators. For example, OMNet++ and NS3 are network simulators widely used in the Vehicular Ad Hoc Network (VANET) community, and they both can be interfaced with SUMO using respectively Vehicles in Network Simulation (VEINS) [4] and iTETRIS [5].
1.1
C-ITS Requirements
An interactive mobility scenario for C-ITS has to provide a complete playground that inte-grates different aspects. We need a multidimensional environment to work on geo-location and telecommunication aspects. It has to be highly populated, with congested traffic patterns to work on alternative and intermodal mobility optimizations. Last but not least, it has to be scalable and controllable.
An environment able to provide all the above-mentioned features is the Principality of Monaco. The city itself covers an area of 2 km2 and the greater area (composed of French cities adjacent to Monaco) is about 70 km2. The size of the city provides a small and more controllable environment, reasonable to model with a microscopic mobility simulator.
Some of the reasons why this kind of interactive mobility playground is important, are available at [6], but here we will discuss them further, explaining how the MoST Scenario is implemented and can be used.
Mobility Traffic patterns in Monaco follow the typical behavior seen in many European capitals. Most of the people that work in the city are commuters and they live in the greater area, for both economical and logistic reasons. In the morning, there is a directional traffic congestion converging to city, and during the evening, the city experience a congested traffic outflow. Monaco is a well-organized city. In order to accommodate all the commuters, it provides many parking areas with a fairly developed public transports network. Nonetheless, the infrastructures in place are not able to alleviate traffic congestion during rush hours. Hence, Monaco city presents a perfect playground to study city-scale advanced parking management solutions, intermodal and alternative transport modes applications.
Territory Monaco is built on the mountains’ slope, facing the Mediterranean sea. Like many coastal cities close to a mountain region, it has a layered topology full of tunnels and bridges. These features present a multidimensional environment more realistic compared to a flat surface. This kind of topology allows the study of precise positioning and three-dimensional propagation models, and their impact on C-ITS. Additionally, these multidimensional features, in conjunction with realistic emission models, can be useful in studying eco-routing based on different factors, such as energy consumption and/or environmental impact.
Crowd Simulator [7]), that given their complexity, would not be otherwise scalable over an entire city.
In the following sections, we are going to provide detailed information on the MoST Scenario, its features, possible use cases, and the road ahead, with the future work. The MoST Scenario is freely available to the community under GPLv3 license. It can be downloaded from
https://github.com/lcodeca/MoSTScenario.
2
Related Works
Discussing the state of the art on the mobility scenarios, we decided to focus only on the one available for SUMO.
Cologne One of the most cited mobility scenario for sumo is the TAPAS Cologne [8] Scenario, which includes road networks imported from OpenStreetMap (OSM) and two possible traffic demands: one from 6:00 to 8:00 in the morning, and the other over 24 hours. Unfortunately, this scenario is cumbersome and requires additional work to improve the network quality, to verify how routes are mapped onto both the network and the traffic demand. Additionally, the buildings definition is not meant for a network simulator, making it not directly usable in C-ITS simulations.
Bologna A realistic traffic scenario from the city of Bologna [9,10], and built in the iTETRIS [5] framework, provides a very good starting point for the community, but it has some limita-tions. The traffic demand is only defined over one hour, and the size of the scenario, which is relatively small, provides only one neighborhood. In this setting, the elevation does not matter, given that the modeled area is flat.
Austria On a completely different scale, the ITS Austria West scenario [11] presents a real life traffic monitoring system that uses a mesoscopic version of SUMO [12]. This scenario is a very good example of the effort required to build and maintain a large scale traffic scenario. The project monitors an infrastructure with around 245,000 nodes and 320,000 edges with a total length of 27,000 km. They have five different traffic information sources providing floating car data and a traffic demand model for the simulation of 1.2 million routes and 1.6 million vehicles. Unfortunately this scenario is not freely available to the community as it relies on proprietary information. Nonetheless, it is a very good example of the performances capabilities of SUMO.
At the best of our knowledge, MoST Scenario is the first freely-available mobility scenario with elevation information for streets and buildings, and fully functional intermodal mobility for pedestrian.
3
Monaco SUMO Traffic Scenario Features
The initial dataset is extracted from OSM and it provides many of the data required to build the scenario. OSM is a collection of crowd-sourced information and the accuracy is not always consistent [15]. A more detailed version of the geographical information is extracted from the Institut G´eographique National (IGN)1 BD TOPOR database under the ISNPIRE licence2. Here we can find detailed data concerning altitude and the land registry. This information is integrated with the street topology and the Points Of Interest (POIs) dataset to obtain a reliable multidimensional model of the city.
This initial dataset is then integrated and refined using data provided by public websites from the Monaco and France. Public transports are gathered from OSM, Compagnie des Autobus de Monaco (CAM)3, and Provence-Alpes-Cˆote d’Azur (PACA) Mobilit´e4, where it can be found location and schedule for buses and trains, and the location of the electric bicycle stations with their availability.
In the data extracted from OSM we find the location of parking lots, train stations, bus stops, taxi stands, and bicycle sharing points; these POIs will be used to build the main infrastructure for multimodality and public transportation. The location of additional POIs (e.g.: museums, tourist attractions and parks, shops and restaurants, offices and facilities, and schools) is used to improve the realism of the activity-based mobility we are going to generate. The Monaco Parking website5 provides location, capacity, schedule, prices and availability for many of the parking lots in the city.
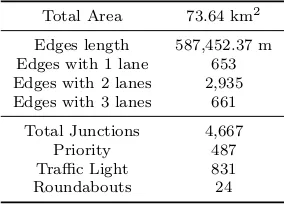
Total Area 73.64 km2
Edges length 587,452.37 m Edges with 1 lane 653 Edges with 2 lanes 2,935 Edges with 3 lanes 661
Total Junctions 4,667 Priority 487 Traffic Light 831 Roundabouts 24
Motorway 16,817.64 m (5,458.85 m) Primary 44,824.26 m (4,665.59 m) Secondary 90,782.24 m (5,778.83 m) Tertiary 67,571.56 m (2,787.15 m)
Service 3,789.67 m Residential 278,468.31 m
Pedestrian 21,867.88 m Steps 17,946.28 m
Railway 26,694.11 m
Table 1: MoST Scenario network topology.
3.1
Network Topology
The above-mentioned information have been processed and merged in an OSM-like file in order to be handled with tools such as JOSM [16] andnetconvert[17]. In Table1we present a sum-mary of the static network information. The MoST Scenario covers an area of approximatively
1https://geoservices.ign.fr
2Since May 9, 2011, the INSPIRE directive requires the release of data for research purposes, in accordance
with the requirements of the CE Regulation n 976/2009
3
http://cam.mc
73 km2, it includes all the road types from motorway to residential, and model both pedestrian paths and stairways (steps).
Intersections In order to have a working SUMO simulation, the intersections were checked manually for correctness using an iterative process with JOSM, netconvert and SUMO to ensure that they did not represent an unrealistic bottleneck for the traffic flows. Additionally, the default size for roads and sidewalks had to be reduced in order to be closer to reality. Concerning the tunnels, we introduced new categories in OSM in order to tag them and import them in SUMO. Even if this information is not important for SUMO, it is very important for the telecommunication simulator.
In the Principality of Monaco the vast majority of intersections is priority based, with a limited number of Traffic Light Systems (TLS) in place. Nonetheless, in the scenario it has been necessary to regulate most of the intersections with a TLS to simulate a more realistic interaction between pedestrian and vehicles. In SUMO, vehicles always stop to let the pedestrians waiting at the zebra crossroad to pass, creating unrealistic congestion when it comes to dense scenarios. In reality, there will be a mutual understanding between vehicles and pedestrians, and their crossing will happen in waves. In simulation, this behavior is better modeled with a TLS regulated intersection.
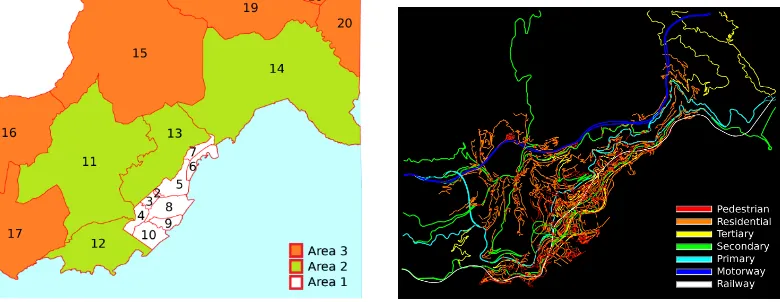
Figure 1: Traffic Assignment Zones (TAZ) col-ored by areas.
Figure 2: MoST Scenario road topology col-ored by priority.
Areas The MoST Scenario is divided in various Traffic Assignment Zone (TAZ)6, and they coincide with the administrative boundaries of the territory in question. In Figure 1 all the TAZ are numbered and they are colored by logical areas (from 1 to 3). The reference for the TAZ enumeration is in Table 2. Area 1 is the Principality of Monaco, Area 2 is composed by the French villages on the border, and Area 3 is composed by the French villages further away. Figure2 shows the topology of MoST Scenario with the streets colored by priority. For example, the motorway (in blue) runs in the outskirts of the urban area, and the railway (in white) goes through all the villages, following the coastline.
6In this context, a traffic assignment zone is a geographical area used to model the traffic patterns and the
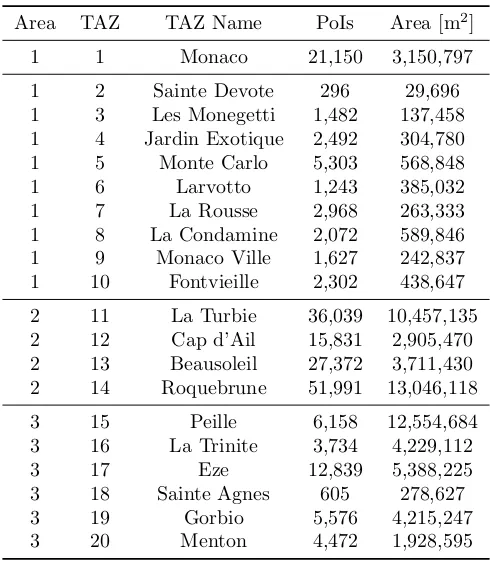
Based on Figures1 and2we can discuss and understand the topology in detail. In Area 1 we find the Principality of Monaco, with all its neighborhoods. In Table2 it is possible to find the number of Points of Interest (PoIs) extracted from the datasets associated with each TAZ and the area it covers. In Area 2 we find the French villages on the border with Monaco. Areas 1 and 2 are the most detailed and close to reality. Area 3 is fundamental to model the traffic patterns in in the area, but its level of detail is limited. Only the main roads are represented to allow the correct inflow (outflow) to (from) the inner areas and the proper definition of the public transports. In both Areas 1 and 2 we can find the pedestrian areas, but the stairways definition can be found mainly in Area 1.
Area TAZ TAZ Name PoIs Area [m2]
1 1 Monaco 21,150 3,150,797
1 2 Sainte Devote 296 29,696
1 3 Les Monegetti 1,482 137,458
1 4 Jardin Exotique 2,492 304,780
1 5 Monte Carlo 5,303 568,848
1 6 Larvotto 1,243 385,032
1 7 La Rousse 2,968 263,333
1 8 La Condamine 2,072 589,846
1 9 Monaco Ville 1,627 242,837
1 10 Fontvieille 2,302 438,647
2 11 La Turbie 36,039 10,457,135
2 12 Cap d’Ail 15,831 2,905,470
2 13 Beausoleil 27,372 3,711,430
2 14 Roquebrune 51,991 13,046,118
3 15 Peille 6,158 12,554,684
3 16 La Trinite 3,734 4,229,112
3 17 Eze 12,839 5,388,225
3 18 Sainte Agnes 605 278,627
3 19 Gorbio 5,576 4,215,247
3 20 Menton 4,472 1,928,595
Table 2: TAZ definition and weights.
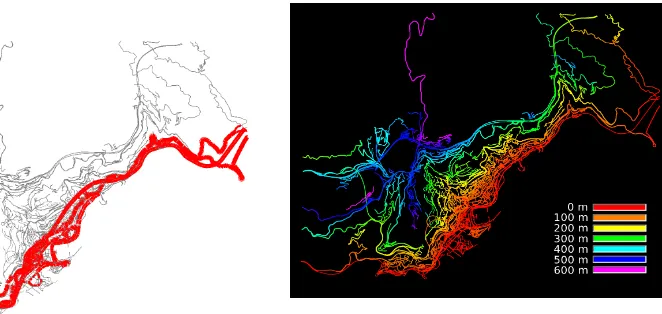
Public Transports Public transports and parking lots are defined for the entire scenario. This allows to model the intermodal traffic in detail, following the P+R (Park and Ride) paradigm already available in many cities. In the MoST Scenario we have 176 bus stops covered by 24 routes, and 12 train stations, covered by 2 routes. The coverage of the public transports is shown in Figure3, in red. It is easy to notice that only the coastline is served by public transports, and this is a well-known issue in this area. In the scenario we defined 131 parking lots, and for each of them, we computed which are the three closest alternatives in case a parking lot is full.
Figure 3: Public Transports coverage (in red).
Figure 4: Network topology colored by eleva-tion.
common knowledge that they reduce the pollution and help us save money on fuel. Nonetheless, it is complicated to find a study on the efficiency of hybrid (or electric) vehicles when it comes to city with mountain-like elevation and slopes. Additionally, when it comes to smart and interconnected cities planning, telecommunications tend to be a given. In the study of C-ITS, it is well known that elevation, slopes and obstacles pose challenging issues that are complicated to study in simulation, due to models complexity and lack of data. For these reasons, in the MoST Scenario there are about 15,000 buildings with their shape and elevation, 96 bridges and a total of 74 tunnels. The elevation map has been extracted from BD TOPOR database,
and averaged out in the tunnels and where the information was missing. Figure 4 shows the elevation of the streets in the scenario. As expected, streets near the coast are at sea-level, but the slope change rapidly from 0 to 600 meters.
3.2
Traffic Demand
The MoST Scenario provides, by default, a mobility for the morning rush hour. The traffic patterns are characterized by inbound traffic congestion directed to the Principality of Monaco. Due to the lack of live traffic data and real traffic counters, we generated a synthetic traffic demand based on statistical information on the population, and a simplified activity-based mobility generation model [18].
We identified the TAZ as shown in Table2, and in order to compute their absolute weight, we divided the number of PoIs (4thcolumn) by the area (5th column) in question. The Origin-Destination (OD) matrices are defined over the three areas and for each different type of trans-port. For example, it can be defined such as 2500 trucks from Area 3 to Area 1; hence, the real weight of a TAZ must be normalized in the pool of origin (or destination) area in question.
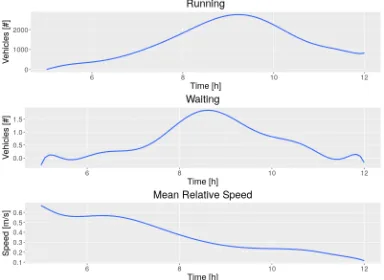
Figure 5: Traffic Demand by vTypes. Figure 6: Simulation results summary.
(a) Route length distribution. (b) Time lost distribution.
Figure 7: Route length and time loss distribution of all the vehicles in the simulation.
Figure7 shows route length and time loss distribution of all the vehicles in the simulation. More precisely, the distribution of the route length is shown in Figure7(a). where the two bells shaped curve represents the traffic internal to the Principality of Monaco (less than 5 km) and the traffic coming from France (Area 2 and 3). The distribution of the time lost by each vehicle is presented in Figure7(b). Here we can notice that the vast majority of the vehicles has to endure delays due to the traffic congestion that are shorter than 20 minutes.
Figure 8 shows the impact of intermodal mobility for pedestrians. More precisely, Figure
(a) Walking length distribution. (b) Route length distribution of the public transport rides.
(c) Public transports waiting time distribution.
Figure 8: Route length distribution and average speed distribution of all the vehicles in the simulation.
represent the morning rush hour timetable. This decision is reflected in the distribution of the waiting time, where the vast majority of the people has to wait less than 15 minutes.
(a) Elevation. (b) Route.
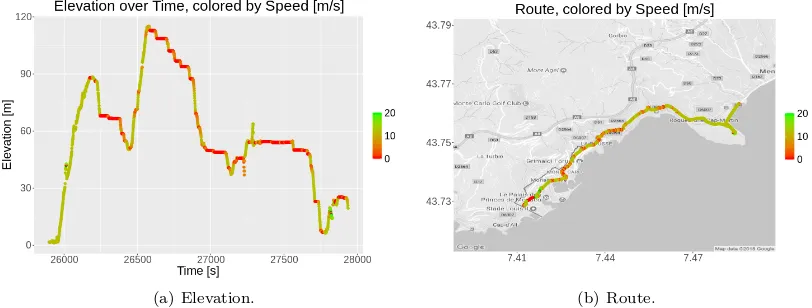
Figure 9: Vehicle: Variation of elevation and speed over time.
Figure9shows some information on the route of a vehicle. We randomly selected a passenger vehicle to show the variation in its elevation and speed (Figure9(a)) and its route (Figure9(b)) as an example of a possible trip that can be found in the MoST Scenario. In this case, its elevation varies from a minimum of 1.27 m to a maximum of 115.0 m, with a median of 54.10 m. Its maximum speed reached is 25.75 m/s, with a mean of 5.11 m/s. The total route length is 10,434.68 m and its time lost due to traffic7is 1260.19 s.
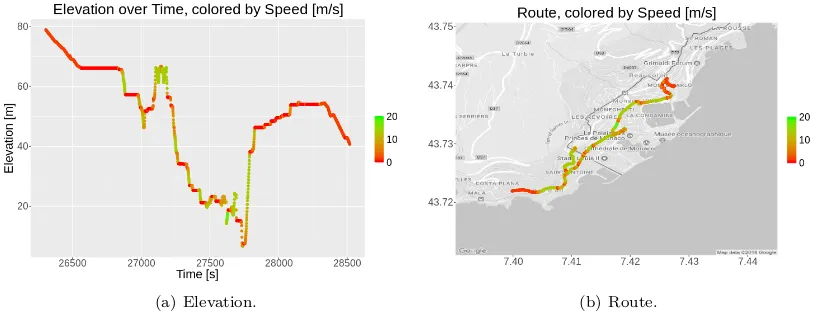
We randomly selected a person to show the behavior of intermodal planning and we pre-sented it in Figure10. Elevation and speed patterns are shown in Figure10(a) and the route in Figure10(b). This is an example of a possible person trip that can be found in the MoST Scenario. In this case, its elevation varies from a minimum of 6.06 m to a maximum of 78.9 m, with a median of 53.07 m. Here is interesting to notice the variation in the speed, and it easily noticeable where the person was on a bus, thanks to the elevated speed (in green) visible in both Figures10(a)and10(b), and where the person was walking (in red). In this example,
(a) Elevation. (b) Route.
Figure 10: Person: Variation of elevation and speed over time.
the person:
• walked 322.35 m,
• waited 270 s for the bus, • rode it for 56 s (334.62 m)
• waited for another bus for 87 s • rode it for 1339 s (4876.21 m)
• and finally walked for 240.5 m to reach the desired destination.
Figures10and9are meant to provide an example of what kind of trips are available in the mobility provided by MoST Scenario. In the following section, we are going to discuss a tool meant to easily generate other mobility traces.
3.3
Mobility Generator
Given the impossibility at the moment to validate the traffic mobility, we wanted to have and provide a tool able to easily generate various traffic demands. Starting from a population and an OD definition, it generates the SUMO trip definition for the mobility. These definitions should be validated withduarouter, a tool provided by SUMO.
A snippet of traffic demand definition is shown in Listing1. Starting from the population size (line 2), a percentage (line 5) of it is given to eachvTypeorvTypeDistribution, and more precisely, it is divided among the OD defined (line 6,composition). This imply that the sum of all theperc (line 11 and 17) must be 1, and for eachvType, the sum of all thepercentages (line 5) must be 1. The possible options depend on the vehicle (or person) in question. It is possible to have person trips based on public transports (line 14) or just walking (line 8). Concerning the vehicles, it is possible to set the destination to a parking lot, and keep them there until the end of the simulation.
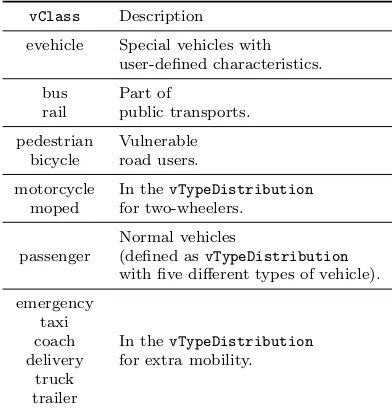
The range of vehicles (and persons) supported by this scenario is the one provided by SUMO and specified in Table3.
. . .
” p o p u l a t i o n ” : 2 0 0 0 0 , ” d i s t r i b u t i o n ” : {
” p e d e s t r i a n ” : {
” p e r c e n t a g e ” : 0 . 3 0 , ” c o m p o s i t i o n ” : {
” 1 ” : {
” withPT ” : f a l s e , ” from ” : ” Area1 ” , ” t o ” : ” Area1 ” , ” p e r c ” : 0 . 3
}, ” 2 ” : {
” withPT ” : t r u e , ” from ” : ” Area2 ” , ” t o ” : ” Area1 ” , ” p e r c ” : 0 . 7
} }, . . .
Listing 1: Simplified example of a traffic demand definition.
vClass Description
evehicle Special vehicles with user-defined characteristics.
bus Part of
rail public transports.
pedestrian Vulnerable bicycle road users.
motorcycle In thevTypeDistribution
moped for two-wheelers.
Normal vehicles
passenger (defined asvTypeDistribution
with five different types of vehicle).
emergency taxi
coach In thevTypeDistribution
delivery for extra mobility. truck
trailer
Table 3: vTypeandvClasses definition.
motorways and/or external edges). Finally, the traffic demand must be defined over a time interval (defined in seconds) and the rush hour is defined specifying mean and standard deviation of a normal distribution.
4
Use Cases and Future Work
MoST is a general-purpose traffic scenario. Its aim is to be a simple and reliable tool to support scientific research. Our plan is to use it to work on intermodal mobility planning and optimization, eco-routing for hybrid vehicles, parking optimization for P+R solutions and we want to explore the impact of elevation on C-ITS.
(a) Simple, only three classes. (b) Larger standard deviation. (c) Smaller standard deviation.
Figure 11: Examples of various traffic demands.
Figures11(b)and11(c)are an example of a traffic demand with different standard deviations in the departure times. Given that the size of the population is still the same, this kind of variation in the traffic demand can be used to study the impact of varying the departure time on the traffic congestion and travel times while respecting constraints (such as the arrival time).
This 3D intermodal traffic scenario is still in active development and the future work will be driven by the community that is using it and their necessity.
The primary enhancement will focus on intermodal mobility integration. At the moment only buses and trains are considered as public transports. In the future, we want to include taxis and shared rides. Additionally, the only means of parking available at the moment are the parking lots. We would like to find a reliable source for the location of car parks along the road and integrate them in the scenario.
Another enhancement concerns the vulnerable road users and the integration of the two-wheelers in the traffic. The MoST Scenario is not bicycles friendly at the moment, and it is due to lack of information. We decided to have pedestrians and cyclists share the pedestrian paths, but we would like to gather precise information to increase the realism. Additionally, we want to work on the two-wheelers model to explore this option when it comes to intermodal traffic.
Last but not least, we are actively looking for real and precise traffic information from the area in order to generate and validate a realistic mobility that reflects the Principality of Monaco and its surroundings.
5
Conclusions
We presented the Monaco SUMO Traffic (MoST) Scenario in details, starting with the dataset used in the generation, through the decisions made to have a scenario that works out of the box, and finally we presented a tool to generate various traffic demands starting from the one provided. The MoST Scenario provides a state of the art 3D playground with various kind of vehicles, vulnerable road users and public transports to work on Cooperative Intelligent Transportation Systems (C-ITS) solutions.
The MoST Scenario covers an area of approximatively 70 km2, that includes three logical areas and 20 Traffic Assignment Zone (TAZ). It provides the location of Points of Interest (PoIs), shape and location for the buildings, and elevation of buildings and streets. Public transports are based on buses and trains, with more than 150 stops and more than 20 routes. The scenario is provided with mobility traces that represents a morning rush hour with intermodal traffic, and a tool is available to easily modify the traffic demand to obtain the desired traffic conditions.
The MoST Scenario is the first freely-available mobility scenario with elevation information for streets and buildings, and fully functional multimodal mobility for pedestrian. The scenario is available to the community under GPLv3 license, and it can be downloaded from
https://github.com/lcodeca/MoSTScenario.
Acknowledgements
References
[1] J´eˆome H¨arri, Fethi Filali, and Christian Bonnet. Mobility models for vehicular ad hoc networks: a survey and taxonomy. Communications Surveys & Tutorials, IEEE, 11(4):19–41, 2009. [2] Francisco J Martinez, Chai Keong Toh, Juan-Carlos Cano, Carlos T Calafate, and Pietro Manzoni.
A survey and comparative study of simulators for vehicular ad hoc networks (VANETs). Wireless Communications and Mobile Computing, 11(7):813–828, 2011.
[3] Daniel Krajzewicz, Jakob Erdmann, Michael Behrisch, and Laura Bieker. Recent Development and Applications of SUMO - Simulation of Urban MObility. International Journal On Advances in Systems and Measurements, 5(3&4):128–138, December 2012.
[4] Christoph Sommer, Reinhard German, and Falko Dressler. Bidirectionally coupled network and road traffic simulation for improved IVC analysis. Mobile Computing, IEEE Transactions on, 10(1):3–15, 2011.
[5] Daniel Krajzewicz, Robbin J Blokpoel, Fabio Cartolano, Pasquale Cataldi, Ainara Gonzalez, Oscar Lazaro, J´er´emie Leguay, Lan Lin, Julen Maneros, and Michele Rondinone. iTETRIS - A System for the Evaluation of Cooperative Traffic Management Solutions. InAdvanced Microsystems for Automotive Applications 2010, pages 399–410. Springer, 2010.
[6] Lara Codeca and J´erˆome H¨arri. Towards multimodal mobility simulation of C-ITS: The Monaco SUMO traffic scenario. InVNC 2017, IEEE Vehicular Networking Conference, Torino, ITALY, 11 2017.
[7] Sean Curtis, Andrew Best, and Dinesh Manocha. Menge: A modular framework for simulating crowd movement.Collective Dynamics, 1:1–40, 2016.
[8] Sandesh Uppoor and Marco Fiore. Large-scale urban vehicular mobility for networking research. InVehicular Networking Conference (VNC), 2011 IEEE, pages 62–69. IEEE, 2011.
[9] Laura Bieker, Daniel Krajzewicz, AntonioPio Morra, Carlo Michelacci, and Fabio Cartolano. Traf-fic simulation for all: a real world trafTraf-fic scenario from the city of Bologna. In SUMO2014 -Modeling Mobility with Open Data. Deutsches Zentrum fur Luft- und Raumfahrt e.V. Institut fur Verkehrssystemtechnik, 2014.
[10] Luca Bedogni, Marco Gramaglia, Andrea Vesco, Marco Fiore, Jerome Harri, and Francesco Fer-rero. The Bologna Ringway dataset: improving road network conversion in SUMO and validating urban mobility via navigation services.Vehicular Technology, IEEE Transactions on, 64(12):5464– 5476, 2015.
[11] Karl-Heinz Kastner and Petru Pau. Experiences with SUMO in a Real-Life Traffic Monitoring System. InSUMO2015 - Intermodal Simulation for Intermodal Transport. Deutsches Zentrum fur Luft- und Raumfahrt e.V. Institut fur Verkehrssystemtechnik, 2015.
[12] MESO: mesoscopic version of SUMO. (Last access: March 2018).
[13] Agata Grzybek, Gr´egoire Danoy, and Pascal Bouvry. Generation of realistic traces for vehicular mobility simulations. InProceedings of the second ACM international symposium on Design and analysis of intelligent vehicular networks and applications, pages 131–138. ACM, 2012.
[14] Lara Codec´a, Rapha¨el Frank, S´ebastien Faye, and Thomas Engel. Luxembourg SUMO Traffic (LuST) Scenario: Traffic Demand Evaluation.IEEE Intelligent Transportation Systems Magazine, 9(2):52–63, 2017.
[15] Mordechai Haklay. How good is volunteered geographical information? A comparative study of OpenStreetMap and Ordnance Survey datasets.Environment and planning. B, Planning & design, 37(4):682, 2010.
[16] JOSM wiki page. https://josm.openstreetmap.de/. (Last access: March 2018).
[17] NETCONVERT wiki page. http://sumo.dlr.de/wiki/NETCONVERT. (Last access: March 2018). [18] Michael Balmer, Kay Axhausen, and Kai Nagel. Agent-based demand-modeling framework for