ISSN: 2249-0183 http://www.ijbttjournal.org Page 28
Sorption Equilibrium and Kinetics for Adsorption of Methelene
Blue
Using Groundnut Shell
R.Harish* P.Ramalingam** D.Darmenthirkumar***
*Asst. Professor Civil Engineering Department, Bharath University ** Sr. Engineer Clear Tech Environmental Solution
***Assoc. Professor, Anna University Chennai
ABSTRACT
Dye containing waste water is a major environmental problem .The treatment method for the removal of dye is costly. For this the use of low cost easily available adsorbent was studied. sorption of methylene blue on to groundnut shell was studied by varying the parameters like initial dye concentration, pH and sorbent dosage. Dye biosorption was rapid up to 60 minutes and equilibrium was attained at 240 minutes after 60 minutes the removal rate was slow due to the decrease in the number of vacant sites. Also the uptake capacity decreases as the amount of sorbent dosage was increased this is due to the increase in the number of solute particles and as the pH varies the is a considerable change in the uptake capacity of the sorbent and all the dyes follow pseudo second order kinetics and also the data fit to Langmuir isotherm very well.
1. INTRODUCTION
Synthetic dyes have been increasingly used in the textile, paper, rubber, cosmetics, pharmaceuticals and food industries because of their easy to use, inexpensive cost for production, stability and variety of colour compared to natural dyes. Colored dye wastewater arises as a direct result of the production of the dye and also as a consequence of its use in the textile and other industries. Greater part of this dyes are synthetic in nature and are usually composed of aromatic rings in their structure, which makes them carcinogenic and mutagenic, inert and non-biodegradable when discharged into waste streams. These results in the creating anoxic condition which cause death of aquatic life Therefore, the removal of such colored agents from aqueous effluents is of significant environmental, technical, and commercial importance. Adsorption
ISSN: 2249-0183 http://www.ijbttjournal.org Page 29 of various dyes from aqueous solution
has proven to be an excellent way to treat effluent also a cost effective technique. Of which adsorption by biomass is very easy to use and also cheap this method is called as Biosorption.
Activated carbon is the most popular and widely used adsorbent, but there are certain problems with its use. It is expensive and the higher the quality the greater the cost. Furthermore, regeneration using solutions produces a small additional effluent, while regeneration by refractory technique results in loss of adsorbent and its uptake capacity.
1.1 Treatment Methods:
1.1.1 Physical methods:
Physical methods used in the colour removal includes the following,
1) Membrane – filtration processes (nanofiltration, reverse osmosis,Electro dialysis)
2) Adsorption Techniques.
Adsorption has been found to be superior to other techniques for water re-use in terms of initial cost, flexibility and simplicity of design,
ease of operation and insensitivity to toxic pollutants.
1.1.2 Chemical methods:
Chemical methods include coagulation or flocculation combined with flotation and filtration, precipitation, flocculation with Fe (II)/Ca (OH) 2, electro flotation, electro kinetic coagulation, conventional oxidation methods by oxidizing agents (ozone), irradiation or electrochemical processes. These chemical techniques are often expensive, and although the dyes are removed, accumulation of concentrated sludge creates a disposal problem. There is also the possibility that a secondary pollution problem will arise because of excessive chemical use. Recently, other emerging techniques, known as advanced oxidation processes, which are based on the generation of very powerful oxidizing agents such as hydroxyl radicals, have been applied with success for pollutant degradation. Although these methods are efficient for the treatment of waters contaminated with pollutants, they are very costly and commercially unattractive. The high electrical
ISSN: 2249-0183 http://www.ijbttjournal.org Page 30 energy demand and the consumption
of chemical reagents are common problems.
1.1.3 Biological treatments:
Biological treatment is often the most economical alternative when compared with other physical and chemical processes. Biodegradation methods such as fungal decolorization, microbial degradation, adsorption by (living or dead) microbial biomass and bioremediation systems are commonly applied to the treatment of industrial effluents because many microorganisms such as bacteria, yeasts, algae and fungi are able to accumulate and degrade different pollutants however, their application is often restricted because of technical constraints. Biological treatment
Requires a large land area and is constrained by sensitivity toward diurnal variation as well as toxicity of some chemicals, and less flexibility in design and operation. Biological treatment is incapable of obtaining satisfactory color elimination with current conventional biodegradation processes. Moreover, although many organic molecules are degraded, many others are recalcitrant due to their
complex chemical structure and synthetic organic origin .In particular, due to their xenobiotic nature, azo dyes are not totally degraded.
Therefore, there is a growing interest in using low-cost, easily available materials for the adsorption of dye colours. In the present study groundnut shell is used as biosorbent for the removal of azo dyes since it is easily available and cheap.
1.2 Scope and Objective of the
Present study:
Methelene Blue synthetic Dye solution treatment using groundnut shell as a sorbent
The Objectives of the Present Investigation are to study,
Effect of initial dye concentration
Effect of Adsorbent Dosage
Effect of pH
Adsorption Kinetics
Adsorption Equilibrium
2. LITERATURE REVIEW
Juan Mao et al (2008) studied the Surface modification of Corynebacterium glutamicum for enhanced reactive Red 4 biosorption. Cross-linking the biomass via the
ISSN: 2249-0183 http://www.ijbttjournal.org Page 31 reaction with polyethylenimine
introduced primary and secondary amine groups, which in turn enhanced the RR 4 biosorption capacity. Also the FT-IR spectra confirmed the presence of amine, hydroxyl and carboxyl groups. According to the Langmuir model, the maximum uptake capacity of PEI-modified biomass was 2.8 times higher than that of raw biomass. The PEI modified biomass was regenerated and reused over four successive sorption–desorption cycles. Thus, cross-linking the bacterial biomass via polyethylenimine is an attractive option for enhancing the biosorption potential towards reactive dyes.
Gre´gorio Crini(2006)
Non-conventional low-cost adsorbents for dye removal: A review
S. Saiful Azhar et al (2005) studied dye removal from aqueous solution by using adsorption on treated sugarcane bagasse and concluded From this study, it was found that the pretreated sugar cane bagasse with formaldehyde (PCSB) and sulphuric acid (PCSBC) has a lower adsorption efficiency compared to powdered activated
carbon (PAC) at the any given initial dye concentration. The adsorption efficiency can be arranged in the following order GAC>PCSBC>PCSB
A.Abdul and F. Aberuagba et al
(2005) the comparative study of the adsorption of phosphate by activated charcoal from corncobs, groundnut shells and rice-husks. Of all the three activated charcoals studied, charcoal from corncobs was found to be the most effective for the adsorption of phosphate from water
3. MATERIALS AND
METHODS
3.1 CHEMICALS:
The dye used in this study was obtained from the Department Of Textile Technology, A.C.College of Technology.
3.2 PREPARATION OF
SORBENT:
The groundnut shell used in this work was collected from farm in virudhunagar. The groundnut shell was washed with distilled water to remove dirt and soil that are adhered on the surface of the sorbent. Then it was spread on tray and oven dried at
ISSN: 2249-0183 http://www.ijbttjournal.org Page 32 60 ◦C for 48 hours. The dried sorbent
was ground and sieved in a 60 mesh size sieve and the underflow was stored in plastic bottle for further use. No other chemical or physical treatments were used prior to adsorption experiments.
3.3 CHARACTERIZATION OF
SORBENT:
The Fourier Transform Infrared Spectroscopy (FTIR) spectrum was obtained for ground nutshell
3.4 PREPARATION OF DYE
SOLUTION:
A 1000 ppm stock solution of dye was prepared by dissolving 1g of Methelene Blue dye in 1 L of distilled water. This stock solution was used for further studies.
3.5 EFFECT OF INITIAL
CONCENTRATION OF DYE:
Batch adsorption experiments were carried out by adding a fixed amount of sorbent (0.3 g) into 100 ml of different initial concentrations such as 50, 100, 150, 200 ppm of dye solution. The initial and equilibrium
dye concentrations were determined by absorbance measurement using UV spectrometer at 668 nm. It was then computed to dye concentration using standard calibration curve.
3.7 EFFECT OF SORBENT
DOSAGE:
A 50ppm dye solution was prepared from the stock solution and the different amount of sorbent was added (0.1, 0.2, 0.3, 0.4, 0.5 g) to the 100ml of dye solution and the system is kept in a shaker for the equilibrium time of 4 hours. Then the dye concentrations were measured with time interval of 60,120,180 and 240 min.
3.8 EFFECT OF pH:
The effect of pH on equilibrium uptake capacity of Groundnut shell was measured by adding a fixed amount of sorbent (0.3 g) into 100 ml of 50 ppm Methelene blue dye solution having different pH such as 2, 4, 6, 8, 10 and 12 of dye solution. The pH of the dye solution was varied by using 0.1N H2SO4 and
0.1 NaOH. The initial and equilibrium dye concentrations were determined by absorbance measurement using UV spectrometer at 668 nm. It was then
ISSN: 2249-0183 http://www.ijbttjournal.org Page 33 computed to dye concentration using a
calibration curve.
4. RESULTS AND
DISCUSSION:
4.1 EFFECT OF INITIAL
CONCENTRATION:
Various concentrations of 50,100,150,200 ppm dye solution was prepared and then 0.3g of sorbent was added and the system was kept in a shaker for four hours and the dye concentration was measured with time interval of 10,20,to 240 min and the result is shown below,
Fig.2 Effect of initial concentration
on adsorption of Methelene Blue
solution
The dye removal occurs in the first rapid phase (60 min) and thereafter
the sorption rate was found to decrease. The higher sorption rate at the initial period (60min) may be due to an increased number of functional sites available at the initial stage. The increased in concentration gradients tends to increase in dye sorption at the initial stages. As time precedes this concentration is reduced due to the accumulation of dye particles in the functional sites leading to a decrease in the sorption rate at the larger stages from 60 to 240 min.
4. 2. EFFECT OF DOSAGE:
A 50ppm dye solution was prepared and different amount of adsorbent added (0.1, 0.2, 0.3, 0.4 g) and the system is kept in a shaker for four hours. The dye concentration was measured with time interval of 60, 120, 180, 240, min and the result is shown below,
Effect of Initial Concentration
0 10 20 30 40 50 60 70 80 90
0 50 100 150 200 250 300
time(mins)
%
o
f
D
y
e
r
e
m
o
v
a
l
50 mg/l 100 mg/l 150 mg/l 200 mg/l
ISSN: 2249-0183 http://www.ijbttjournal.org Page 34
Fig.3 The effect of adsorbent dosage
on adsorption of Methelene Blue solution
The percentage removal of Methelene Blue increased with the increase in sorbent dosage. This can be attributed to increased adsorbent surface area and availability of more adsorption sites resulting from the increase dosage of the sorbent
4.3 EFFECT OF pH:
The effect of pH on equilibrium uptake capacity of Groundnut shell was measured by adding a fixed amount of sorbent (0.3 g) into 100 ml of 50 ppm Methelene blue dye solution having different pH such as 2, 4, 6, 8, 10 and 12 of dye solution. The pH of the dye solution
was varied by using 0.1N H2SO4 and
0.1 NaOH. The initial and equilibrium dye concentrations were determined by absorbance measurement using UV spectrometer at 668 nm. It was then computed to dye concentration using a calibration curve.
Fig.4 The effect of pH on adsorption
of Methelene Blue solution.
4.4 ADSORPTION KINETICS:
The biosorption mechanism and potential rate controlling steps have been investigated by using the pseudo first and pseudo second order kinetic models.
4.4.1 The pseudo first order kinetic
model:
The pseudo first order rate expression of lagergen is of the form:
dqt /dt= k1(qe − qt ) -1
Effect of Sorbent Dosage
0 10 20 30 40 50 60 70 80 90
0 50 100 150 200 250 300
Time(mins)
%
o
f
D
Y
e
r
e
m
o
v
a
l
0.1 g 0.2 g 0.3 g 0.4 g
Effect of pH
0 10 20 30 40 50 60 70 80 90 100
0 2 4 6 8 10 12 14
pH
%
o
f
D
y
e
R
e
m
o
v
a
l
ISSN: 2249-0183 http://www.ijbttjournal.org Page 35
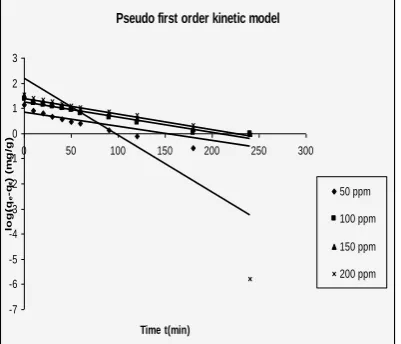
Fig.5 The pseudo first order kinetic
model of adsorption of Methelene Blue solution
Integrating this for the boundary conditions t=0 to t = t and qt =0 to qt =
qt, gives
log(qe − qt ) = log qe − k1 /2.303 ( t)
-2
where k1 is the rate constant (1/h), qe
the amount of solute adsorbed on the surface at gequilibrium (mg/g), qt the amount of solute adsorbed at any time (mg/g). The value of the adsorption rate constant (k1) for Methelene Blue
sorption by groundnut shell was determined from the plot of log(qe −qt)
against t. The parameters of pseudo-first-order model are summarized in
Table 1. In many cases the first-order
equation of Lagergren does not fit well to the whole range of contact time and is generally applicable over the initial stage of the adsorption
processes. Although the correlation coefficients, R2, for the application of
the pseudo-first-order model are reasonably high in some cases, the calculated qe is not equal to experimental qe, suggesting that the Adsorption of Methelene Blue on groundnut shell is not likely to be a pseudo-first-order for the initial concentrations examined.
Table 1. Pseudo - first order kinetic model
Concentrati on
C0 (mg/l)
qe
(mg/g) K1
(L/min )
R2
50 14.204
55
0.0045 76
0.994 7
100 26.246
72
0.0014 62
0.983 3
150 34.364
26
0.0012 52
0.986 6
200 39.525
69
0.0009 14
0.982 2
4.4.2 The pseudo-second-order
kinetic model: Pseudo first order kinetic model
-7 -6 -5 -4 -3 -2 -1 0 1 2 3
0 50 100 150 200 250 300
Time t(min)
lo
g
(q
e
-q
t
)
(m
g
/g
)
50 ppm
100 ppm
150 ppm
200 ppm
ISSN: 2249-0183 http://www.ijbttjournal.org Page 36
Fig.6 The pseudo second order
kinetic model fo adsorption of Methelene Blue solution
The pseudo-second-order equation based on equilibrium adsorption is expressed as
t/qt = 1/k2q2e+ 1/qet -3
Where k2 (g/mg h) is the pseudo-second-order rate constant determined from the plot of t/qt versus t, as shown
in Fig. 5. if the experiment data fits
the plot of t/qt vrsus t as a linear
relationship the pseudo second order kinetic model is valid
Table 2. Pseudo - second order kinetic model
Concentrati on
qe
(mg/ K2
(g/mg. R2
C0 (mg/l) g) min)
50 6.821 0.0115 0.737
100 17.55 0.0138 0.955
150 23.25 0.0140 0.981
200 155.8 0.0522 0.671
4.5 Isotherm studies:
The adsorption data were analyzed with three adsorption isotherm models, namely Langmuir, and Freundlich.
4.5.1 Langmuir isotherm model:
The Langmuir adsorption model is based on the assumption that maximum adsorption corresponds to a saturated monolayer of solute molecules on the adsorbent surface.
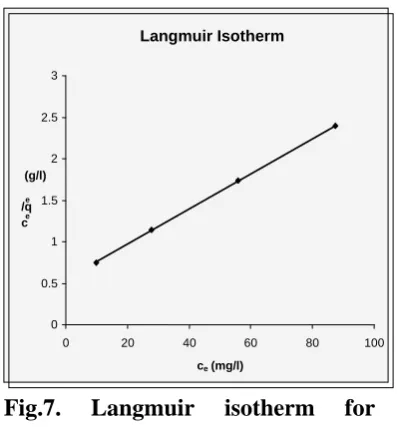
Fig.7. Langmuir isotherm for
adsorption of Methelene Blue using
groundnut shell
The expression of the Langmuir model is given by the following equation:
qe = Q0 b Ce /(1+ bCe) -4
Pseudo second order Kinetic Model
0 2 4 6 8 10 12 14 16 18 20
0 50 100 150 200 250 300
Time t(min)
t/
q
t
(
g
.m
in
/m
g
) 50 ppm
100 ppm
150 ppm
200 ppm
Langmuir Isotherm
0 0.5 1 1.5 2 2.5 3
0 20 40 60 80 100
ce (mg/l)
ce
/qe
(g/l)
ISSN: 2249-0183 http://www.ijbttjournal.org Page 37 where qe (mg/g) and Ce (mg/L) are
the amount of adsorbed dye per unit mass of sorbent and unadsorbed dye concentration in solution at equilibrium, respectively.Q0 is the
maximum amount of the adsorbed dye per unit mass of sorbent to form a complete monolayer on the surface bound at high Ce (mg/g), and b (L/mg) is a constant related to the affinity of the binding sites. The linear form of Langmuir model is
Ce/qe= 1/Q0b+ Ce/ Q0 -5
Table 3. Langmuir isotherm
Langmuir constant
Values
Q0 47.16981
b(L/mg) 0.038913
R2 0.9997
The linear plot of specific adsorption (Ce/qe) against the equilibrium
concentration (Ce) (Fig. 7) shows that
the adsorption obeys the Langmuir model. The Langmuir constants Q0
and b were determined from the slope and intercept of the plot and are Presented in Table 3.
4.5.2 The Freundlich isotherm
model:
. The Freundlich model is an empirical equation that assumes
heterogeneous adsorption due to the diversity of adsorption sites.
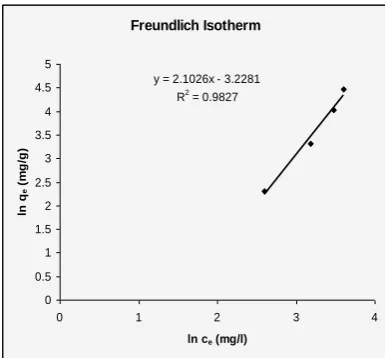
Fig.8. Freundlich isotherm for
adsorption of Methelene Blue using
groundnut shell
The Freundlich equation is expressed as
qe = KFCe1/n - 6
where KF (mg/g (L/mg)1/n) is roughly
an indicator of the adsorption capacity and 1/n is the adsorption intensity. The magnitude of the exponent, 1/n, gives an indication of the favorability of adsorption. Values of n > 1 represent favorable adsorption conditions. Eq. may also be written in the logarithmic form as
ln qe = ln KF +(1/n) ln Ce -7
Values of KF and n are calculated
from the intercept and slope of the plot and are listed in Table 4
Table 4. Freundlich isotherm:
Freundlich Isotherm
y = 2.1026x - 3.2281
R2
= 0.9827
0 0.5 1 1.5 2 2.5 3 3.5 4 4.5 5
0 1 2 3 4
ln ce (mg/l)
ln
q
e
(
m
g
/g
)
ISSN: 2249-0183 http://www.ijbttjournal.org Page 38 Freundlich constant Values
Kf (mg/g(L/g)1/n) 0.039633
n 0.475602
R2 0.9827
4.6 FOURIER TRANSFORM
INFRARED ANALYSIS (FTIR):
The FTIR analysis was carried out to confirm the existence of amine, carboxyl and phosphonate group in groundnut shell biomass. the FTIR spectroscopy analysis had showed a strong band in the range of 1730-1750cm-1 indicative of c=o of the carbonyl in carboxylic group .the spectrum showed the peaks 1644,1370,1264 cm-1, representing carboxyl groups. some absorption bands(P=O) stretching at 1103 cm-1 and the P-OH stretching at 1055cm
-1
where the phosphonate group is present .the spectrum showed some characteristic absorption of amine group : N-H bonding band at 1512 cm-1 and also C-N stretching band at 1264 cm-1
5. CONCLUSION:
Batch experiment was conducted to study the effect of sorbent dosage, initial dye concentration, contact time and pH for the removal of Methelene Blue from solution by using groundnut shell. Based on the above experiment it was observed that as the initial dye concentration increases from 50ppm to 200ppm the removal percentage of dye was decreased from 80.12% to 55.64% and as the sorbent dosage 0.1 g to 0.4g increases the amount of dye adsorbed increased from 64.10% to 84.93%.For the effect of pH, at a pH of 8 the adsorption of Methelene blue was maximum. The adsorption kinetics for Methelene
ISSN: 2249-0183 http://www.ijbttjournal.org Page 39 Blue on to groundnut shell is well
described by pseudo second order kinetics and the equilibrium data are analyzed against Langmuir and Freundlich isotherms. The Langmuir isotherm was demonstrated to provide the best correlation for the sorption of Methelene Blue on to groundnut shell.
6. REFERENCE:
1. S.Rangabhashiyam, N.
Anu, N. Selvaraju 2013 Sequestration of dye from textile industry wastewater using agricultural waste products as adsorbentsJournal of Environmental Chemical Engineering Volume 1, Issue 4, December 2013, Pages 629– 641
2. M.C. SomasekharaReddy, V. Nirmala, C. Ashwini 2013 Arabian Journal of ChemistryBengal Gram Seed Husk as an adsorbent for the
removal of dyes from aqueous solutions – Batch studies
3. Yu Xi, YongFang Shen, Fan Yang, GaoJu Yang, Chang Liu, Zheng Zhang, DaHeng Zhu 2013,Removal of azo dye from aqueous solution by a new biosorbent prepared with Aspergillus
nidulans cultured in tobacco wastewaterOriginal Research Article Journal of the Taiwan Institute of Chemical Engineers, Volume 44, Issue 5, September 2013, Pages 815-820
4. Aksu, Z., 2005. Application of biosorption for the removal of organic pollutants: Areview. Proc. Biochem. 40, 997–1026
5. Aksu, Z. S. Sen Cagatay, Investigation of biosorption of Gemazol Turquise Blue-G reactive dye by dried Rhizopus
arrhizus in batch and
continuous systems, Sep. Pur. Technol. 48 (2005) 24–35.
6. Alkan, M., Celikc¸apa, S., Demirbas, O¨ ., Dogan, M.,
ISSN: 2249-0183 http://www.ijbttjournal.org Page 40 2005. Removal of reactive
blue 221 and acid blue 62 anionic dyes from aqueous solutions by sepiolite. Dyes Pigments 65, 251–259
7. Annadurai, G., Chellapandian, M., Krishnan, M.R.V., 1999. Adsorption of reactive dye on chitin. Environ. Monitor. Assessment 59, 111–119.
8. Annadurai, G., Juang, R.S., Lee, D.J., 2002. Use of cellulose-based wastes for adsorption of dyes from aqueous solutions. J. Hazard. Mater. B92, 263–274
9. Aksu, Z., Tezer, S., 2000. Equilibrium and kinetic modeling of biosorption of Remazol Black B by Rhizopus arrhizus in a batch system: effect of temperature. Proc. Biochem. 36, 431–439.
10.Aksu Z., I.A. Isoglu, Removal of copper(II) ions from aqueous solution by biosorption onto agricultural waste sugar beet pulp, Process
Biochem. 40 (2005) 3031– 3044
11.G. Crini, Non-conventional low-cost adsorbents for dye removal: a review,Bioresour. Technol. 97 (2006) 1061– 1085.
12.Grag, V.K., Raksh Kumar and Renuka Gupta,2004. Removal of malachite green dye from aqueous solution by adsorption using agroindustries waste: A case study of Phosopis ceneraria. Dyes & Pigments, 62: 1-10
13.Namasivayam, C. and N. Kanchana, 1993. Removal of Congo red from aqueous solution by waste banana pith. J. Sci. Technol., 1: 33-42.