James Madison Undergraduate Research Journal
Volume 6 | Issue 1
2018-2019
The Effects of
Ocular Dominance on
Visual Processing
in College Students
Follow this and other works at:
http://commons.lib.jmu.edu/jmurj
Recommended APA Citation
Holland, W. A. (2019). The effects of ocular dominance on visual processing in college students. James Madison Undergraduate Research Journal, 6(1), 18-27. Retrieved from http://commons.lib.jmu.edu/jmurj/vol6/iss1/2
This full issue is brought to you for free and open access by JMU Scholarly Commons. It has been accepted for inclusion in James Madison Undergraduate Research Journal by an authorized administrator of JMU Scholarly Commons. For more information, please contact [email protected].
William Alexander Holland
ABSTRACT
The role of ocular dominance in processing visual memory and analytic tasks is unknown. Research has variably showed both significant effects and no effect of ocular dominance on visual perception, motor control, and sports performance. The goal of this study was to determine if there is a relationship between ocular dominance and visual processing under a variety of computer gaming tasks. This was accomplished by first determining subjects’ ocular dominance through the Miles test, and then examining the subjects’ visual performance on four different Lumosity games under three conditions: left eye, right eye, and both eyes. Results suggest a relationship between ocular dominance and score in the simplest game used, named Raindrops, but did not identify a relationship between ocular dominance and accuracy. The study did not suggest a relationship within any of the other games that measure a variety of different abilities. It is possible a relationship between ocular dominance and score in the game Raindrops may have been due to the simplicity of the task. A small sample size (n = 20) may have also contributed to the inability to detect significant effects. Future studies incorporating larger sample sizes might focus on ocular dominance as it relates to simple arithmetic tasks.
THE EFFECTS OF OCULAR DOMINANCE
ON VISUAL PROCESSING IN
COLLEGE STUDENTS
Throughout history, it has been appreciated that a person may be more adept with one hand than the other. Most people have either a dominant right or left hand; few are equally adept with both hands (Llaurens, Raymond, & Faurie, 2009). More recently, it has become clear that humans also preferentially use one eye over the other, known as ocular dominance (Miles, 1929). It is unclear, however, whether the dominant eye processes or perceives visual information better than the other eye. The goal of this study was to determine if there was any relationship between ocular dominance and visual processing under a variety of computer gaming tasks.
Visual System
Ocular dominance arises from the anatomical and physiological organization of the visual system. The eye consists of the pupil, iris, cornea, sclera, and retina. The pupil is a small black-looking aperture in the center of the eye which admits light. The iris is a circular pigmented muscle that regulates how much light is transmitted through the pupil by controlling the pupil’s size; the iris also gives the eye its color. The cornea is the outside layer of the eye covering the iris and pupil, and its purpose is to work with the lens to generate a sharp image at the retinal photoreceptor layer on the inner surface of the eye. The sclera is the supportive wall of the eye. Regarding the neural elements, the retina is the inner lining of the eye where neurons and photoreceptors (structures sensitive to light) are located. The retina consists of three layers: the outermost containing rod and cone photoreceptors, which, respectively, allow for monochromatic and color vision. The middle layer contains bipolar cells which process and convey signals from the photoreceptors to the ganglion cells in the innermost layer. The ganglion cells, in turn, project through the optic tract to the lateral geniculate nucleus (LGN) in the thalamus (Nelson, 2007).
The LGN, located in the dorsal thalamus of the brain, consists of two lobes: the right LGN and the left LGN. Each half of the LGN is made up of six layers; half of these layers receive input from the nasal medial retinas, and the other half receive input from the temporal lateral retinas. Neurons in the LGN transmit sensory information to the primary visual cortex (Bear, Connors, & Paradiso, 2016).
The primary visual cortex, also known as the striate cortex, is located in the occipital lobe of the brain. The primary visual cortex is the primary synaptic target of the LGN. The primary visual cortex is also made up of six layers, and Layer 4 is divided into three parts. Layer 4C is different from the other layers of the primary visual cortex in that it receives synaptic input from only the contralateral eye. The other layers of the primary visual cortex receive input from both eyes (Bear et al., 2016). The secondary visual
cortex, also known as the pre-striate cortex, processes visual information from the primary visual cortex. The secondary cortex differs from the primary cortex in that more complex features of the visual scene are recognized, perhaps also leading to visual memories. The secondary visual cortex also sends input back to the primary visual cortex (Gazzaniga, Ivry, & Mangun, 2002). The associative cortex includes most of the cerebral cortex and is responsible for the complex processing that underlies the integration of multi-sensory information, the control of movement, and conscious behavior. The parietal association cortex in particular is responsible for responding to complex stimuli in the internal and external environment, and the frontal associative cortex may be important for planning behavior in response to stimuli (Purves et al., 2001).
Ocular dominance must arise from the separate processing of information from each eye. Therefore, it is relevant that information from the left and right eye remains at least partially separate up through the primary visual cortex. In particular, there are ocular dominance columns in the primary cortex that may mediate monocular processing, such as depth perception and possibly ocular dominance (Barrett, 2016; Miller, Keller, & Stryker, 1989).
Ocular Dominance
Ocular dominance is defined as the preference of one eye over the other for sight or the favoring of one eye when there is conflicting information being presented to both eyes (Coren & Kaplan, 1973). The term ocular dominance was first coined in 1593 by Porta, who suggested that if people are right-handed and right-footed, then they are necessarily right-eyed. Much more recently, researchers have established that there is not a direct relationship between the dominant eye and the body’s limbs (Coren & Kaplan, 1973).
Coren and Kaplan (1973) used 13 different methods to test for ocular dominance, including pointing, alignment, the hole test, the Ascher test, and the Miles ABC test. The authors argued that ocular dominance is a complex phenomenon consisting of three different types of ocular dominance: sighting, sensory, and acuity dominance. In contrast, Barrett (2016) was skeptical that the phenomenon of ocular dominance could be clinically demonstrated, pointing out the lack of agreement between the various tests of ocular dominance. For example, there were inconsistencies in test results for the same individual, which further complicated findings.
Heilman (2002) found that right-eye dominance is more common than left-eye dominance in terms of demographics, and Porac and Coren (1976) showed that right-eye dominant individuals make up between 65% and 70% of the population. There is evidence that ocular dominance may have a genetic basis. Using a mathematical model, Annett (1999) suggested that genetically-linked asymmetry in humans may account for right-sidedness above the 50% that would be expected by chance. Similarly, Annett’s results indicate a positive correlation between handedness and eye preference.
It is generally believed that binocular (two-eyed) vision is superior to monocular (one-eyed) vision, even when subjects use their dominant eye. Subjects may perform better at tasks involving tracking moving objects with binocular vision as opposed to monocular vision (Madan, 1980). It is also known that fatigue under binocular and dominant monocular eye viewing conditions is less pronounced than in non-dominant monocular viewing conditions, and that subjects may perform better at tasks involving tracking moving objects with binocular vision as opposed to monocular vision (Madan, 1980). However, while past research suggests performance in the dominant eye will surpass the non-dominant eye when ocular dominance is pronounced, it is still not totally understood how ocular dominance relates to visual processing because performance varies, depending on the task at hand.
Ocular Dominance & Visual Motor
Performance
Color vision may vary between dominant and non-dominant eyes. Gundogan, Koçtekin, and Altintaș (2016) found that color perception error scores were lower in dominant eyes versus non-dominant eyes for red/green discrimination. However, eye dominance had no effect on blue/yellow discrimination. Thus, when the subjects used their dominant eye, they perceived the red/green color better than with their non-dominant eye. Ocular dominance displayed no effect on perception of blue/yellow colors (Gundogan, Koçtekin, & Altintaș, 2016).
The phenomenon of saccades is critically important for visual orientation and balance. Saccades are rapid eye movements that change a point of fixation quickly and abruptly (Purves et al., 2001). Tagu, Doré-Mazars, Lemoine-Lardennois, and Vergilino-Perez (2016) report that in binocular tasks, subjects with more pronounced ocular dominance showed greater amplitude of saccades toward a target. Furthermore, performance was better for saccade target locations contralateral to the dominant eye (Tagu, Doré-Mazars, Lemoine-Lardennois, & Vergilino-Perez, 2016).
Lateral eye movements, which are a reaction to distracting stimuli, also vary with ocular dominance. In Borod,
Vingiano, and Cytryn’s (1988) research on lateral eye movements and emotion, they found that non-emotional tasks yielded right-lateral eye movements in right-eye dominant subjects, while the same non-emotional tasks yielded left-lateral eye movements in left-eye dominant individuals. For emotional tasks, no statistically significant difference was found between the two ocular dominance groups.
In humans, the dominant eye not only processes more information than the non-dominant eye, but it may also inhibit perception of items from the non-dominant eye (Madan, 1980; Shneor & Hochstein, 2006).
Hand-eye coordination relies on both ocular dominance and visual processing. Because hand-eye coordination is an important determinant of sports performance, much of the literature on ocular dominance in sports is related to testing hand-eye coordination (Laby & Kirschen, 2011).
Ocular dominance can affect performance in sports. Steinberg, Frehlich, and Tennant (1995) compared the golfing success of two groups: cross dextral golfers (right-handed with left-eye dominance) and pure dextral golfers (both right-eye dominant and right-handed). The study concluded that pure dextral golfers have a statistically significant advantage over cross dextral golfers in putting accuracy.
There is also evidence that ocular dominance may play a critical role in reaction time. Chaumillon, Blouin, and Guillaume (2014) showed that the time required for cross and pure dextral subjects to press a button in response to a lateralized visual stimulus was faster for pure dextral subjects than their cross dextral counterparts.
Development
Research has shown that in mammals, ocular dominance develops early in life (Sanes & Jessell, 2013). Ocular dominance cannot be inhibited or changed after a specific critical period early in a mammal’s development. In mice, cats, and monkeys, closure of an eye during the critical period for ocular dominance markedly shifts the preference of binocular neurons to inputs from the the other eye. Closure before or after the time of this normal critical period, however, fails to alter the preference of the neurons. Furthermore, performance in ocular dominance cannot be changed in adults by monocular occlusion (Sanes & Jessell, 2013). It is also known that subjects will tend to perform better at visual tasks with binocular vision even after monocular occlusion has been introduced for a period of up to five days (Sheedy, Bailey, Buri, & Bass, 1986).
Specific Aim
Given the lack of research on the effects eye dominance has on visual memory and simple analytic processing, the primary objective of this study was to determine if ocular dominance influences performance on different computer gaming tasks that draw on different aspects of visual memory and analytic processing. This goal was achieved by comparing performance in four Lumosity games which relied on visual memory and analytic processing for three visual conditions: dominant eye, non-dominant eye, and binocular vision.
Methodology
Approvals
Institutional Review Board (IRB) approval was received on November 3, 2016. Permission was obtained from Lumos Labs, Inc. on November 4, 2016, to use specific games featured on the website www.lumosity.com. Participants were required to sign an IRB-approved consent form.
Participants
Undergraduate participants (n = 20) were recruited from Spring 2017 STEM classes, a Spring 2017 Math Club meeting, and/or through personal invitation. The time of day students participated in the experiment varied due to school conflicts. Participants ranged from 18 to 26 years of age.
Determining Ocular Dominance
To determine subjects’ ocular dominance, the Miles Test for Ocular Dominance (Miles, 1929) was used. The Miles Test asks subjects to form an aperture with their hands and then to focus their attention on an object, in this case either a red or green target on a whiteboard 2.5 meters away. The object subjects focused on was not as relevant as their distance away from the object. Subjects were then asked to close one
eye at a time to report the eye in which the object shifted. Subjects who reported a shift in their left eye were classified as right-eye dominant, and subjects who reported a shift in their right eye were classified as left-eye dominant. Subjects who reported no shift in either eye were classified as having no eye dominance.
Measuring Mental Processing Ability
All tests of visual mental processing ability used the Lumosity program. After eye dominance was recorded, the participants played four different Lumosity games that test different abilities within mental processing. The four games are titled as follows: Raindrops, Disillusion, Chalkboard Challenge, and Memory Matrix. All subjects participated in the games in this order. Before testing in a specific game began, all subjects were asked to participate in a practice session of the game in which they were being examined to acquaint them with the rules and play of the game. Practice sessions were similar to the actual tests, but the subjects had both eyes open. Practice sessions lasted as long as the scored sessions. No data was recorded during these practice session. The practice session for Memory Matrix was designed to determine at what level the subject should start the game. An eye patch was used to examine visual mental processing ability in a specific eye during the recorded testing. All subjects were asked to play each of the four games with their right eye covered, their left eye covered, and with both eyes open. The sequence in which eyes were covered was randomized for each game.
Raindrops
The first game the subjects were asked to play was Raindrops, which focuses on basic arithmetic ability (Figure 1). The objective of this game is to complete basic arithmetic questions inside of raindrops before they drop to the bottom of the screen. Subjects had a sufficient amount of time to play this game, until the “raindrops” reached the bottom of the screen three times. However, the experimenter requested the subjects to stop playing if they exceeded the time limit
Figure 1. A representation of what subjects were expected to accomplish in the
permitted by the IRB. A maximum of five minutes was allowed for each trial. The difficulty of the game progressed as the subjects completed more arithmetic questions. Because of the difficulty level, the experimenter was never required to ask the subjects to cease playing because the subjects lost the game before reaching the maximum time limit. The total number of questions answered correctly in each trial, the time it took for the subject to complete each trial, and the accuracy of the subject in each trial were all recorded.
The second game that subjects were asked to play was Disillusion, which focuses on subjects’ ability to visually process and change tasks within a set time (Figure 2). Subjects had up to 60 seconds to complete this game. The objective of this game is to match puzzle pieces based on their color if the piece is vertical, and based on their symbol if they are horizontal. The puzzle pieces are then cleared from the board once the players match them. This process was repeated four times with four different boards until the subject cleared all the puzzle pieces on each board. If the player matches the puzzle piece with an incorrect piece on the board, there is a delay in time between boards and a delay for the space in which the player selects the incorrect piece. Players can clear as many as three puzzle pieces at a time when correctly matched. The subject’s total number of pieces correctly matched and the amount of time taken for each respective trial were recorded.
The third game subjects were asked to play was Chalkboard Challenge, which also focuses on basic arithmetic ability but may additionally test the subject’s field of vision (Figure 3). The objective of this game is to indicate which of two basic mathematical quantities is greater using only the left, right, and down arrow keys on the subject’s keyboard. Respectively, the left arrow key indicates that the left quantity is larger, the right arrow key indicates that the right quantity is larger, and the down arrow key indicates that both quantities are equal. The player begins with a time of 50 seconds
to complete the questions presented. Like the Raindrops game described earlier, Chalkboard Challenge increases in arithmetic complexity as the subject progresses. The difference is that, unlike Raindrops, the actual complexity of the mathematical quantities in Chalkboard Challenge increases instead of the amount of questions presented or the speed at which they are expected to be answered. For every three quantities that the player correctly classifies as greater or equal, the questions increase in difficulty and 10 seconds is added to the player’s time. If the player identifies the quantities incorrectly, 3 seconds are deducted from the player’s time left. The subject’s total number of correctly identified quantities for each trial, the time the subject took for each trial, and the accuracy of the subjects during each trial were recorded for this game.
The last game subjects were asked to play was Memory Matrix, which focuses entirely on the subject’s ability to process and remember a pattern of tiles (Figure 4). The objective of this game is to memorize a pattern of tiles in roughly 1 second and then match the tiles on a board exactly as they had been presented. The game increases in difficulty after every two boards the player memorizes entirely. With each level in difficulty, the game adds an additional tile for the player to memorize. The game begins with three tiles for the player to memorize but then changes depending on how well the player performs in prior trials. This made a practice session compulsory because the practice session sets the difficulty of the initial board. If the player does not match every tile on the board exactly as it was shown, the game will not add additional points to the player’s score. The game will also not increase in difficulty if the player makes an error. If the player fails to memorize all the tiles presented for two trials in a row, the game decreases in difficulty by removing a tile that the player needs to memorize. The game requires the player to complete 12 of these trials per game, meaning that the subject attempted to memorize a total of 48 boards throughout the course of the experiment. The first 12 boards were part of the practice tests, and the
Figure 2. A representation of what subjects are expected to accomplish in the game
Disillusion. The time and score are indicated in the upper right-hand corner of the screen.
Figure 3. A representation of what subjects are expected to accomplish in the game
other 36 were divided between testing with the left eye, the right eye, and both eyes. The subject’s score for each set of 12 trials as indicated by Lumosity, “best board” on all 12 trials, and total time taken for each set of 12 trials were recorded for this game.
Data Analysis
As there was a non-normal skewing of scores on all tests, box and whisker plots were used to plot the data (Figure 5A-8B). Boxplots show the median, 25th and 75th percentiles, and 5th and 95th percentiles, as well as all individual data points. The non-parametric Friedman Repeated Analysis Measures on Ranks was used for inferential testing in all tests in all four games because of the within-subject design and non-normal distribution of scores. An α of 0.05 was used as the criterion for significance. Data was managed in Microsoft Excel, and statistics and graphics were computed in Systat Sigmaplot.
Results
The purpose of this study was to determine whether there was a relationship between ocular dominance and visual processing. Subjects with ocular dominance (n=19) performed four different games: Raindrops, Disillusion, Chalkboard Challenge, and Memory Matrix, which were played under three conditions: left eye closed, right eye closed, and both eyes open. Ocular dominance was split almost equally between the subjects with 9 having left-eye dominance and 10 having right-eye dominance
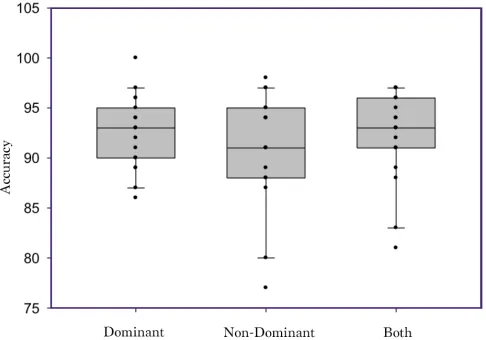
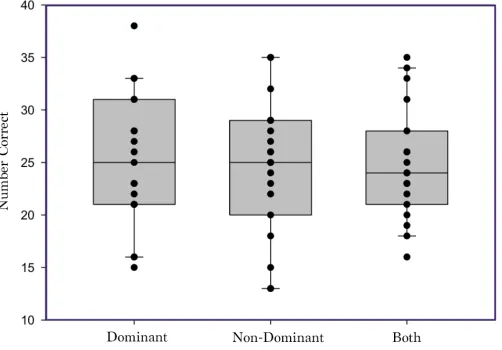
The first game evaluated was Raindrops, which measured the visual arithmetic ability of the subjects. Figure 5A shows that the total number of correct responses was significantly affected by eye group (P=0.01, Friedman) and that the scores were greater for the dominant eye compared to the non-dominant eye (P<0.05, Tukey) but not both eyes. However, accuracy in the Raindrops game (Figure 5B) was not significantly affected by eye group.
Two box and whisker plots display both the number correct and accuracy for subjects’ dominant eyes, non-dominant eyes, and both of their eyes on Raindrops. Statistical analysis for both number correct (A) and accuracy (B) used a sample size N = 19. The dominant eye yielded a median of 59 correct, a lower quartile of 46 correct, and an upper quartile of 67 correct. The non-dominant eye yielded a median of 49 correct, a lower quartile of 38 correct, and an upper quartile of 73 correct. Data from both eyes yielded a median of 48 correct, a lower quartile of 38 correct, and an upper quartile of 65 correct. The Chi-Squared value = 8.41 with 2 degrees of freedom and P = 0.015 indicated that the differences in the median values among the treatment groups were greater than would be expected by chance. A post-hoc Tukey test revealed that the median score for the dominant eye was greater than for the non-dominant eye (P<0.05) but not both eyes. In terms of accuracy, the dominant eye yielded a median of 93%, a lower quartile of 90%, and an upper quartile of 95%. The non-dominant eye yielded a median of 92%, a lower quartile of 87%, and an upper quartile of 95%. The data from both eyes yielded a median of 94%, a lower quartile of 92%, and an upper quartile of 96%. There was no statistically significant difference as P = 0.45. The power of the performed test was 0.049.
Figure 4. A representation of what subjects are expected to memorize in the game
Memory Matrix. The number of tiles shown, the trial, and the score appear in the upper right-hand corner of the screen.
Figure 5A. Raindrops: total number of correct responses by eye group.
The second game evaluated was Disillusion, which measured the subjects’ ability to visually switch tasks. The subjects switched tasks by matching changing puzzle pieces to a board. Figure 6 shows that the number of correctly matched puzzle pieces was not significantly affected by eye group (P=0.90, Friedman).
A box and whisker plot of the subjects’ number correct in their dominant eye, non-dominant eye, and both of their eyes for game 2, Disillusion. Statistical analysis for the number correct used a sample size of N = 19. The dominant eye yielded a median of 25 correct, a lower quartile of 22 correct, and an upper quartile of 31 correct. The non-dominant eye yielded a median of 25 correct, a lower quartile of 19 correct, and an upper quartile of 28 correct. Data from both eyes yielded a median of 24 correct, a lower quartile of 22 correct, and a upper quartile of 28 correct. There was no statistically significant difference as P = 0.90. The power of the performed test was 0.049.
The third game evaluated was Chalkboard Challenge, which also measured the visual arithmetic ability of the subjects. Figure 7A reveals that the number of correctly identified greater quantities was not affected by eye group (P=0.99, Friedman). Figure 7B displays that the accuracy in terms of correctly identified greater quantities was also not affected by eye group (P=0.85, Friedman).
Two box and whisker plots which display both the number correct and accuracy for subjects’ dominant eyes, non-dominant eyes, and both of their eyes for game 3, Chalkboard Challenge. Statistical analysis for both number correct (A) and accuracy (B) used a sample size of N = 19. The dominant eye yielded a median of 30 correct, a lower quartile of 26 correct, and an upper quartile of 35 correct. The non-dominant eye yielded a median of 30 correct, a lower quartile of 25 correct, and an upper quartile of 38 correct. Data from both eyes yielded a median of 28 correct, a lower quartile of 25 correct, and an upper quartile of 40
correct. There was no statistically significant difference as P = 0.99. The power of the performed test was 0.049. In terms of accuracy, dominant eye yielded median of 91%, a lower quartile of 84%, and an upper quartile of 94%. The non-dominant eye yielded a median of 88%, a lower quartile of 86%, and a upper quartile of 94%. The data from both eyes yielded a median of 88%, a lower quartile of 85%, and an upper quartile of 93%. There was no statistically significant difference as P = 0.85. The power of the performed test was 0.049.
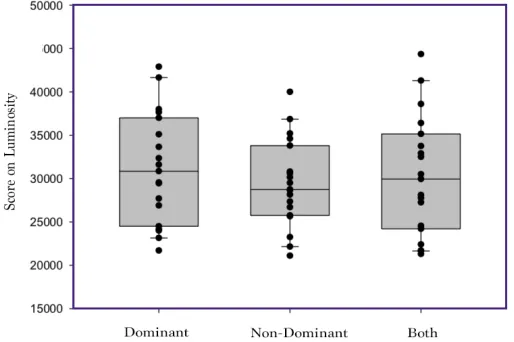
The fourth game evaluated was Memory Matrix which measured the subjects’ capacity to remember quantities of tiles in various patterns. Figure 8A shows that the subjects’ best board, or largest quantity of memorized tiles in a single trial, was not affected by eye group (P=0.17, Friedman). Figure 8B shows that the subjects’ scores as indicated by the Lumosity interface was also not affected by eye group (P=0.85, Friedman).
Two box and whisker plots which display both the best board and score on Lumosity for subjects’ dominant eyes,
non-Figure 6. Disillusion: ability to switch tasks by eye group.
Figure 7A. Chalkboard Challenge: number of correctly identified quantities
by eye group.
Figure 7B. Chalkboard Challenge: accuracy in identifying quantities by eye
dominant eyes, and both of their eyes for game 4, Memory Matrix. Statistical analysis for both best board and score on Lumosity used a sample size of N = 19. The average best board for the dominant eyes yielded a median of 10 tiles, a lower quartile of 8 tiles, and an upper quartile of 13 tiles. The non-dominant eye yielded a median of 10 tiles, a lower quartile of 9 tiles, and an upper quartile of 13 tiles. Both eyes yielded a median of 10 tiles, a lower quartile of 9 tiles, and an upper quartile of 13 tiles. There was no statistically significant difference as P = 0.17. The power of the performed test was 0.071. The dominant eyes yielded a median score of 31,000, a lower quartile of 24,000, and an upper quartile of 37,500. The non-dominant eye yielded a median score of 28,000, a lower quartile of 26,000, and an upper quartile of 33,500. Both eyes yielded a median of 30,000, a lower quartile of 24,500, and an upper quartile of 34,500. There was no statistically significant difference as P = 0.32. The power of the performed test was 0.072.
In order to determine whether the sample size was adequate to reveal differences between eye groups, a power analysis was performed for all four games. The powers of the four games were 0.048, 0.048, 0.048 and 0.17, which were less than the typically desired 0.8.
Discussion
Summary
The goal of this project was to determine whether subjects who used only their dominant eye in computer games scored differently than when those same subjects that only used their non-dominant eye or both eyes. Across all four games, in only one game did subjects score better with their dominant eye than with their non-dominant eye. In the Raindrops game, which tested simple arithmetic ability, subjects who used their dominant eye scored significantly higher than subjects who used their non-dominant eye but the same as subjects who used both eyes. In contrast, the eye dominance was not significant in the other three games that tested complex arithmetic ability, task switching, and memory. This suggests ocular dominance may preferentially benefit simple arithmetic visual tasks. However, low power suggests a greater sample size may have been needed to detect differences in the other three games. In a relatively small statistical sample, one subject displayed no preference for either eye. A future study to test cognitive abilities of individuals possessing no eye dominance compared to those with eye dominance might reveal advantages or disadvantages for students with this trait. Future studies might also focus on ocular dominance as it relates to simple arithmetic tasks as my study indicated a correlation between the aforementioned variables. These new studies may also include a larger sample size than the one used in my experiment.
Comparisons with Previous Studies
Previous studies have shown mixed effects of ocular dominance on performance. While research across sports (Steinberg, Frehlich, & Tennant, 1995), visual perception, and eye movement have revealed the effects of eye dominance, other similar studies (Laby & Kirschen, 2011) have shown little evidence of the effect of ocular dominance on their examinations. Similarly, my results have shown that ocular dominance had little effect on subjects’ performance on most, but not all, of the Lumosity games.
Interestingly, most previous studies assessed the role of dominance or non-dominance performance indirectly. My studies directly assessed the role of ocular dominance on task performance. For example, one study conducted by Shneor and Hochstein (2006) measured their result on the observation of distractor elements whereas my study examined raw performance. Their study tested the effects of ocular dominance on performance in a feature search where subjects would be given a visual target to look at and distractor targets designed to distract their visual attention. Better performance was measured by the number of times the subjects detected the distractor stimulus. In their experiment, it was found that dominant eyes detected
Figure 8A. Memory Matrix: quantity of memorized tiles by eye group.
more distractors than non-dominant eyes. The only test in my experiments comparable with Shneor and Hochstein’s experiment was the second game, Disillusion. Disillusion primarily measures the subject’s ability to switch tasks but also tests the subject’s ability to search for targets. Similarly, Hochstein and Shneor’s experiment focused on the relationship between ocular dominance and target searching specifically. It is likely that Disillusion was too complex a task to measure the effects of ocular dominance, as subjects were making decisions in addition to target searching.
Finally, in previous studies (Miles, 1929), right-eye dominance was exhibited to be more prevalent than left-eye dominance by a ratio of roughly 2:1, respectively. In my study, right-eye and left-eye dominance ratios were roughly 1:1; however, several of the left-eye dominant subjects claimed to have some sort of trauma to their right eye during childhood.
Physiological Mechanisms
My results, for one task, showed the dominant eye scored better than the non-dominant eye. Visual input stays separate through the lateral geniculate primary visual cortex. The ocular dominance column is evidence that two separate paths could receive preferential processing.
Preferential processing may correlate with cerebral lateralization. Many studies insinuated that this was a possible explanation of the outcomes. However, in my experiment, there was no evidence that cerebral lateralization can flip for left- and right-ocular dominant individuals because most games showed no significant difference between groups. One possibility is that dominance correlates to cerebral lateralization (Choi, Kim, Jeong, Lee, & Park, 2016). This is unlikely because the percentage of left-eye and right-eye dominance individuals was approximately the same.
Even though there is physiological evidence of ocular dominance columns, it did not appear to manifest itself in this visual processing experiment. It is possible that the brain compensates in visual processing experiments for eye dominance. This may be due to the interhemispheric connections of the corpus callosum. The corpus callosum may be responsible for this compensation in tasks between the different eyes. The semi-decussation, or partial crossing, of the optic chiasm may also play a role in the interhemispheric transfer of information to compensate for the monocular tasks.
Author’s Note
William Alexander Holland (‘17) graduated from the James Madison Honors College with a Bachelor of Science, Distinc-tion in Biology, and a minor in Mathematics. He is pursuing a career in the biomedical scienc-es and is considering graduate studies focusing on neuroscience and use of mathematical model-ing to predict/interpret data.
This paper revisits an Honors thesis of the same title. Mr. Holland would like to thank Dr. Corey L. Cleland (Biology), Dr. James S. Sochacki (Mathematics), and Dr. Roger Thelwell (Mathematics), whose help made his work possible.
References
Annett, M. (1999). Eye dominance in families predicted by the right shift theory. Laterality: Asymmetries of Body, Brain and
Cognition, 4(2), 167-172. doi:10.1080/713754330
Barrett, B. (2016). The importance and relevance of eye dominance. Optometry Today. Retrieved from https://www.aop. org.uk/ot/cet/2016/06/20/the-importance-and-relevance-of-eye-dominance-part-1/article
Bear, M. F., Connors, B. W., & Paradiso, M. A. (2016).
Neuroscience: Exploring the brain (4th ed.). Philadelphia, PA:
Wolters Kluwer.
Borod, J. C., Vingiano, W., & Cytryn, F. (1988). The effects of emotion and ocular dominance on lateral eye movement. Neuropsychologia, 26(2), 213-220. doi:10.1016/0028-3932(88)90075-9
Chaumillon, R., Blouin, J., & Guillaume, A. (2014). Eye dominance influences triggering action: The Poffenberg-er paradigm revisited. Cortex, 58, 86-98. doi:10.1016/j.cor-tex.2014.05.009
Choi, J. A., Kim, J. S., Jeong, H. J., Lee, J. A., & Park, C. K. (2016). Ocular dominance is associated with the ganglion cell-inner plexiform layer thickness profile in the macula.
PLoS ONE, 11(2), 15-35. doi:10.1371/journal.pone.0150035
Coren, S., & Kaplan, C. P. (1973). Patterns of ocular domi-nance. American Journal of Optometry and Archives of American
Academy of Optometry, 50(4), 283-292.
Gazzaniga, M. S., Ivry, R. B., & Mangun, G. R. (2002).
Cognitive neuroscience: The biology of the mind (2nd ed.). New York,
NY: W.W. Norton & Company.
Gundogan, N. U., Koçtekin B. S., & Altintaș, A. K. (2016). The relationship between color vision discrimination abil-ity and depth perception among universabil-ity students.
Inter-national Eye Science 16(8), 1412-1418.
doi:100.3980/j.issn.1672-5123.2016.8.04
Kitayama, S., Fujikake, H., Kokubu, M, & Higuchi, T. (2014). The relationship between spatial cognition and walking trajectory for passing through a doorway: Evident in individuals with dominant right eye? Experimental Brain
Research, 233(3), 797-807. doi:10.1007/s00221-014-4155-y
Laby, D. M., & Kirschen, D. G. (2011). Thoughts on ocular dominance—Is it actually a preference? Eye Contact Lens,
37(3), 140-144. doi:10.1097/ICL.0b013e31820e0bdf
Llaurens, V., Raymond, M., & Faurie, C. (2009). Why are some people left-handed? An evolutionary perspective.
Philosophical Transactions of the Royal Society B, 364, 881-894.
doi:10.1098/rstb.2008.0235
Lumosity. (2017). Brain games & brain training. Lumosity. Retrieved from www.lumosity.com/
Madan, M. L. (1980). Comparison of performance on a tracking
task utilizing binocular, dominant and non-dominant viewing
(master’s thesis, Naval Postgraduate School). Retrieved from https://calhoun.nps.edu/bitstream/handle/10945/18937/ comparisonofperf00mada.pdf?sequence=1&isAllowed=y.
Miles, W. R. (1929). Ocular dominance demonstrated by unconscious sighting. Journal of Experimental Psychology, 12(2), 113-126. doi:10.1037/h0075694
Miller, K. D., Keller, J. B., & Stryker, M. P. (1989). Ocular dominance column development: Analysis and simulation.
Science, 245(4918), 605-615. doi:10.1126/science.2762813
Nelson, R. (2007). Ganglion cell physiology. In H. Kolb, R. Nelson, E. Fernandez, & B. Jones (Eds.), Webvision: The
organization of the retina and visual system. Salt Lake City, UT:
University of Utah Health and Sciences Center. Retrieved from https://webvision.med.utah.edu/book/part-ii-anatomy-and-physiology-of-the-retina/ganglion-cell-physiology/
Porac, C., & Coren, S. (1976). The dominant eye. Psychological
Bulletin, 83(5), 880-897. doi:10.1037/0033-2909.83.5.880
Purves, D., Augustine, G. J., Fitzpatrick, D., Katz, L. C., LaMantia A-S, McNamara, J. O., & Williams, S. M. (Eds.). (2001). Neuroscience (2nd ed.). Sunderland, MA: Sinauer Associates.
Roth, H. L., Lora, A. N., & Heilman, K. M. (2002). Effects of monocular viewing and eye dominance on spatial attention. Brain, 125(9), 2023-2035. doi:10.1093/brain/awf210
Sanes, J. R., & Jessell, T. M. (2013). Experience and the refinement of synaptic connections. In E. R. Kandel, J. H. Schwartz, T. M. Jessell, S. A. Siegelbaum, & A. J. Hudspeth (Eds.), Principles of neural science (5th ed) (pp. 1259-1283). New York, NY: McGraw Hill.
Sheedy, J. E., Bailey, I. L., Buri, M., & Bass, E. (1986). Binocular vs. monocular task performance. American
Journal of Optometry and Physiological Optics, 63(10), 839-846.
doi:10.1097/00006324-198610000-00008
Shneor, E., & Hochstein, S. (2006). Eye dominance effects in feature search. Vision Research, 46(25), 4258-4269. doi:10.1016/j.visres.2006.08.006
Steinberg, G. M., Frehlich, S. G., & Tennant, L. K. (1995). Dextrality and eye position in putting performance.
Perceptual and Motor Skills, 80(2), 635-640. doi:10.2466/
pms.1995.80.2.635
Tagu, J., Doré-Mazars, K., Lemoine-Lardennois, C., & Vergilino-Perez, D. (2016). How eye dominance strength modulates the influence of a distractor on saccade accuracy.
Investigative Ophthalmology & Visual Science, 57(2), 534-543.