Using Random Parameter Logit In Open
And Distance Learning (ODL) Institutions
In Malaysia
Chooi Chea Chiam [1], SzeWei Loo [2]
[1] Open University Malaysia [email protected] [2] Open University Malaysia [email protected]
ABSTRACT
Attention has been drawn to Open Distance Learning (ODL) as a mode for teaching and learning with the advancement in communication via the Internet. Education today has expanded the role of ICT in learning and knowledge generation, leveraging on Internet technology to transmit education across the country. Technology advancement and the introduction of ODL in educationhas created heated competition among these private higher education providers in Malaysia. ODL mode offers a flexible form of learning. Learners of ODL tend to be more challenging to fulfill their needs as they have other commitments in life, therefore, these learners will have certain criteria when choosing their learning education institution. The aim of this study is to investigate the vital attributes contributing in choosing an ODL higher education institution in Malaysia and to explore the consumers’ socioeconomic characteristicswith their willingness-to-pay fees. Although studies on the attributes that influence student choice of a university exist, these have failed to use the choice experiment method to examine the attributes influencing choice of ODL education provider. The sample population was 320 using face-to-face interview. The results would be able to provide ODL education providers in Malaysia with knowledge on making the right marketing strategy.
Keywords: choice experiment, attributes, open and distance learning (ODL), willingness-to-pay (WTP), random parameter logit (RPL)
INTRODUCTION
Sustainability remains the question within the private higher education sector industry today with many playersintensifying competitionin the market. On a positive note, competition can be viewedfrom a larger perspective particularly with Malaysia aspiring to be the hub of higher education within the region. Like many other service firms in the market, education institutions may want to review their marketing strategies to compete in the increasingly competitive market. It is vital that higher education providers understand the attributes and the willingness-to-pay of the education consumers for the services rendered. Over the years, there has been rapid growth on the dependency of information technology for open and distance learners around the world. In open and distance learning (ODL) mode, the absence of traditional classroom face-to-face interaction between learners and tutors is substituted with theonline forum. As the demand for tertiary education via ODL has increased over the last decade especially from among working adults, it is important that educational institutions take pro-active steps to ensure they meet the attributes that learners are expecting to get from the institution. Tertiary education is arguably a high-involvement product and it represents a substantial investment in monetary and temporal terms. Hence, prospective education consumers would carefully examine the options available in the market. Educational marketers must study the reasons for students selecting a particular tertiary institution from a large number of alternatives. Apart from that, how students come to a purchase decision and the attributes they are appraising for their options in education institutions is an important question. The objectives of this study
are (a) to determine the attributes that prospective students are willing to pay in selecting the education provider; and (b) to evaluate theinfluence of prospective students’ socio-economic characteristics and attitudes on their choice of education provider in Malaysia.
Past Literature
According to Brown (1991), education consumers are to select those education institutions that match their selection attributes academically, socially and financially. Plank and Chiagouris (1998) reported that five attributes play a role in education provider decision making, namely (a) academic programs offered (bi) academic programs available (c) perceived good job after graduation (d) financial aid and (e) value for money. Meanwhile according to Webb et al (1998), there are 10 suggested criteria. They are (a) academic programs available (b) academic reputation of the institution (c) the marketability of the degree conferred (d) faculty contact time (e) accreditation (f) campus employment (g) financial aid (h) placement reputation (i) completion time and (j) library size. According to Joseph et al. (2005), 6 criteria have beenidentified inassessing service quality in higher education. These are (a) program issues (b) academic reputation (c) physical aspects (d) career opportunities (e) geographical location of the institution and (f) duration of studies.
Choice Experiment (CE) is used to evaluate non-market goods (Hanley and Barbier, 2009). CE involves designing different options with different levels of attributes and characteristics. The respondents were then asked to choose their preferred options based on the given options in the surveys. A “status quo” term is always used as a baseline in the questionnaire in order to achieve welfare measure that is consistent with the economic theory (Adamowicz et al. 1998; Layton and Brown, 1998).
METHODOLOGY
A total sample of 320 was collected in year 2014 from several ODL higher education institutions in Malaysia. The attributes and its levels are needed to be defined carefully and as precisely as possible. Therefore, the attributes are chosen based on previous studies on the industry in the market today. Besides that, the level for each attributes is determined by interviewing several experts in the ODL institution
CE estimates the Willingness-To-Pay (WTP) value based on the estimated
β
i values from equation iji j
j
ij
X
X
X
V
=
β
1 1+
β
2 2+
...
+
β
. The estimatesβ
ivalue, which implies the effect on the utility of achange in each attribute level. For example,
β
1 shows the effect on utility of a change in attribute X1 (Hanleyand Barbier, 2009). WTP is the price or cost attribute and the marginal change in an attribute is typically derived by dividing the
β
a (value of each non-monetary attribute) byβ
c (value of the price attribute). TheMarginal WTP or c
a
MWTP
β
β
=
, this value for any attributes, other than the price is called the implicit price or marginal rate of substitution (MRS) (Hanley and Barbier, 2009).
The estimation of the consumers’ decision by maximum likelihood using the random parameters logit model (RPL); also known as the mixed logit model was outlined by Train (2003). The RPL model is able to capture unobserved individual effects when estimating our parameters as it separates the parameter into a fixed and random element.
i
i
β
µ
β
=
+
with the RPL model when choosing across m alternatives the probability that individual ichooses schooling choice j is: Pr(i chooses j)=
∫
∑
= i i m ij i ij i d f Z Zβ
β
β
β
) ( ) ' exp( ) ' exp( 11 , where Zij is a vector of attributes
that vary across alternatives available and the probability is a weighted average of the logit formula evaluated
at different values of
β
i, with weights given by the density f(β
i)
.The research objectives
The specific objective of this study is to evaluate the influence of respondents’ socio-economic and attitudes variables on the willingness-to-pay for ODL education attributes in Malaysia.
Definition of attributes’ levels
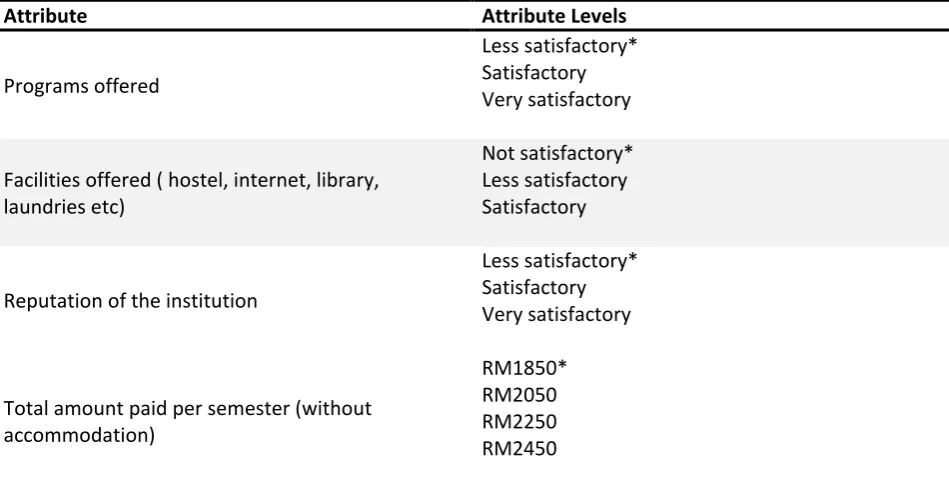
The identification of attributes and the levels was obtained from past studies and several officials from various education institutions and the “status quo” term should be included as well. The selected attributes and levels are shown in the following Table 1.
Table 1Selected Attributes and TheirLevels
Attribute Attribute Levels
Programs offered
Less satisfactory* Satisfactory Very satisfactory
Facilities offered ( hostel, internet, library, laundries etc)
Not satisfactory* Less satisfactory Satisfactory
Reputation of the institution
Less satisfactory* Satisfactory Very satisfactory
Total amount paid per semester (without accommodation)
RM1850* RM2050 RM2250 RM2450
* Status quo or current situation of the ODL education provider institutions in Malaysia. Program offered
The number of demanded and reputable programs offered. The options of programs offered:
Less satisfactory: Did not meet the programs and syllabus needed and asked by the prospective students
Satisfactory: Fairly meet the programs and syllabus needed and asked by the prospective students. Very satisfactory: Able to meet the programs and syllabus needed precisely by the prospective students.
Facilities offered
Facilities offered refer to the various facilities offered by the institution to its students for example, internet coverage, library, the security of hostel and laundries:
Not satisfactory: Fail to meet all the needed services by the prospective students for example, weak internet connection, small library, dirty and no security for the hostel and no laundry service.
Less satisfactory: Certain facilities fail to meet the expectations of prospective students. Satisfactory: Able to meet all the needed services by the prospective students.
Reputation of the institution
Reputation and image of the institution refers to establishment and image of the institution over the years of quality service rendered.
Less satisfactory: Unable to project reputable and established institution over the years in the education industry.
Satisfactory: Fairly able to project reputable and established institution over the years in the education industry.
Very satisfactory: Able to project very reputable and established institution over the years in the education industry.
Results and Discussions
A summary of the socio-economic profile of respondents is presented in Table 2. The total number of respondents is 320. The respondents’ age is between 28 years old to 72 years old, with mean 35 years of age.
Table 2 Socio-economic Profile of Respondents
Variable Frequency Percentage (%) Mean
Age (year) 34.705
Income per annum 38863.55
Gender
Male 118 36.9
Female 202 63.1
Race
Malay 212 66.3
Chinese 61 19.0
Indian 36 11.3
Others 11 3.4
Marital Status
Single 136 42.5
Married 163 50.9
Others 21 6.6
The respondents’ gender distribution was: 36.9% and 63.1% male and female respectively.By ethnic distribution, the respondents were 66.3% Malay, 19% Chinese, 11.3% Indian and only3.4% are from other ethnicity. As for the marital status, 42.54% of them are currently single, 50.9% of them are married and 6.6% of them are others, such as widowed or divorced.
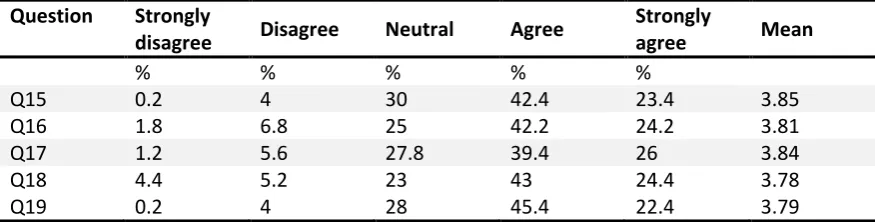
Respondents’ perception on ODL education
Respondents were asked about their perception on ODL education as well. There were seven questions related to this aspect from Q15 to Q21. Refer to Table 3 for the results:
Questions regarding respondents’ perception on ODL education
Q15. I am glad ODL education choice is available to me
Q16. The present ODL education attributes should be available for my grandchildren
Q17. ODL education is the future of learning
Q18. If things continue on their present course, we will soon experience a major touch in education
Q19. I do not need to care about education attributes
Table 3 Respondents’ Perception Toward ODL Education
Question Strongly
disagree Disagree Neutral Agree Strongly agree Mean
% % % % %
Q15 0.2 4 30 42.4 23.4 3.85
Q16 1.8 6.8 25 42.2 24.2 3.81
Q17 1.2 5.6 27.8 39.4 26 3.84
Q18 4.4 5.2 23 43 24.4 3.78
Q19 0.2 4 28 45.4 22.4 3.79
Table 3 shows most of the respondents do feel that ODL education is important and is the future of education and they are glad that ODL education is available for them with mean value of 3.85, 3.81 and 3.84 respectively. Most of the respondents are concerned about ODL education attributes.
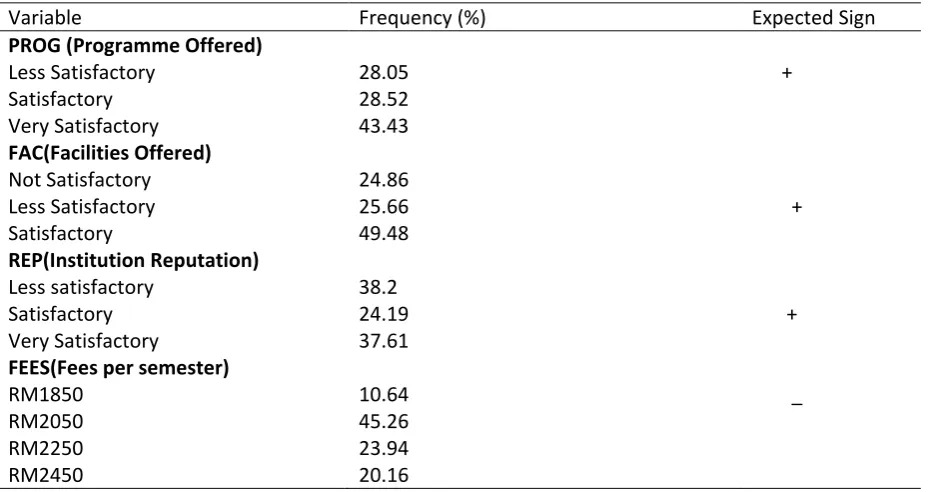
The analysis will start with basic model followed by basic WTP for the ODL attributes identified by the respondents. Table 4 shows a brief descriptive analysis of the main attributes in the choice experiment.
Table 4 Descriptive Analysis of Main Attributes
Variable Frequency (%) Expected Sign
PROG (Programme Offered)
Less Satisfactory 28.05 +
Satisfactory 28.52
Very Satisfactory 43.43
FAC(Facilities Offered)
Not Satisfactory 24.86
Less Satisfactory 25.66 +
Satisfactory 49.48
REP(Institution Reputation)
Less satisfactory 38.2
Satisfactory 24.19 +
Very Satisfactory 37.61
FEES(Fees per semester)
RM1850 10.64 _
RM2050 45.26
RM2250 23.94
RM2450 20.16
Different options were presented to respondents, distinguished by their attributes and associated cost. Option A and Option B entailed various combinations of better ODL education attributes with higher fees per semester, while Option C is always weak ODL education attributes (current situation) and therefore with the minimum fees of RM1850 per semester. The general econometric model was derived as in the following:
0 2
2 1
1
β
...
β
ε
β
+
+
+
+
=
X
X
kX
kU
where
β
1,
β
2,...,
β
k are related coefficients on the main attributesX
1,
X
2,...,
X
k.Basic Multinomial Model
For thebasic multinomial model, the respondents were expected to value those levels of program offered, facilities offered and institution reputation that resulted in higher quality and bring higher utility. Table 5 shows the basic multinomial model with signs of all the attributes.
Table 5 Basic Multinomial Model
Variables Coefficients (
β
) Standard ErrorPRO 0.63028678 0.04264956***
FAC 0.53478455 0.03948460***
REP 0.67477164 0.03140176***
FEES -0.09854782 0.01256524***
***Significant at 1%
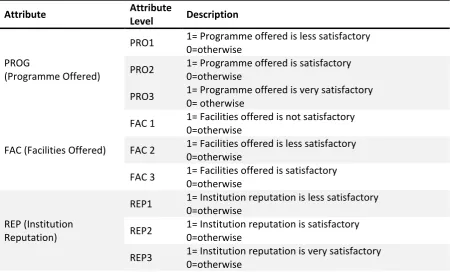
Table 5 shows that all the attributes sign are in agreement with the theories. Program offered (PRO), Facilities Offered (FAC) and Institution Reputation (REP) are positive in sign. This means the higher the quality of these attributes the higher the willingness to pay. Meanwhile, negative sign for FEES shows that the higher the fees per semester, the lower the willingness to pay. Each attribute, except fees in term of monetary value (FEES) is divided into three levels and recoded as dummy variables (0, 1). Status quo or level one as base line and level two and three implied medium and high level of each attribute. Attribute levels are dummy coded which means that they are set to 1 if the corresponding level is present, and equal to 0 otherwise (Table 6). In all models, base level is the first level of each attribute.
Table 6 Attributes and Attribute Levels
Attribute Attribute Level Description
PROG
(Programme Offered)
PRO1 1= Programme offered is less satisfactory 0=otherwise
PRO2
PRO3
1= Programme offered is satisfactory 0=otherwise
1= Programme offered is very satisfactory 0= otherwise
FAC (Facilities Offered)
FAC 1 1= Facilities offered is not satisfactory 0=otherwise
FAC 2 1= Facilities offered is less satisfactory 0=otherwise
FAC 3 1= Facilities offered is satisfactory 0=otherwise
REP (Institution Reputation)
REP1 1= Institution reputation is less satisfactory 0=otherwise
REP2 1= Institution reputation is satisfactory 0=otherwise
REP3 1= Institution reputation is very satisfactory 0=otherwise
Marginal willingness-to-pay
The MWTP is calculated by computing the marginal rate of substitution between the attribute of interest and the cost factor. According to Hanley andBarbier (2009), this value ratio can also be identified between non-monetary elements of utility (attribute tradeoffs) is known as implicit price (IP). As an example, one of the attribute is program offered dividing the value of this attribute by value of price, will show the average willingness-to-pay of respondents to increase the quality of programme offered from the current level. The marginal value of the conservation attributes is estimated using the following formula:
Marginal value = monetary variable attribute
β
β
−
Table 7 Marginal Value for Different Attribute Levels
Variables Marginal Value Standard Error
PRO2 1960.50646420 1.63505617***
PRO3 1960.76151350 1.50245622***
FAC2 1920.11114643 1.22343202***
FAC3 1896.66538605 0.81297655***
REP2 1907.75237945 0.74814242***
REP3 1980.20074490 2.07267003***
***Significant at 1%
Wald procedure in LIMDEP, NLogit 4.0, was employed to estimate the WTP value of the attributes. Referring to Table 7, the Marginal Rate of Substitution (MRS) between less satisfactory and satisfactory for program offered in the logit model is RM1960.50 while an improvement for program offered to very satisfactory level is RM1960.80 per semester, indicating respondents in this study do prefer the best condition (very satisfactory level) of program offered. Meanwhile, there is a lower need for better quality in
the facilities offered by the respondents for this attribute. There is a fall from less satisfactory to satisfactory level for facilities offered; RM1920.11 to RM1896.70 per semester. Meanwhile, respondents have the highest WTP for institution reputation where they were willing to move from satisfactory to very satisfactory level by paying higher fees; RM1907.75 to RM1980.20 per semester. This shows that the respondents in this study do value the institution reputation the most.
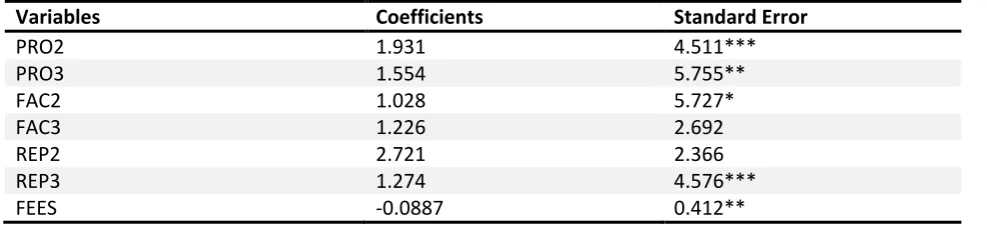
Table 8 illustrates the results for RPL specifications model. Programs offered is significant at both the higher levels, while only facilities offered at less satisfactory level and reputation of the institution at very satisfactory level are significant with the WTP of the respondents in this study. Other than that, all the signs of the variables are in agreement with economic theory. With the significance of program offered at satisfactory and very satisfactory level are significant at 1% and 5% respectively.
Table 8 RPL Model Specification for Different Attributes Level
Variables Coefficients Standard Error
PRO2 1.931 4.511***
PRO3 1.554 5.755**
FAC2 1.028 5.727*
FAC3 1.226 2.692
REP2 2.721 2.366
REP3 1.274 4.576***
FEES -0.0887 0.412**
***Significant at 1%, ** Significant at 5%, * Significant at 10%
CONCLUSION
From the universities’ perspective, it is important to understand the costs and benefits received, as they often have a strong influence on how to market its institutions; investing in the reputation of ODL education institution is vital based on the results of this study. This is also somewhat in line with the RPL results showing that the institutional reputationat very satisfactory level is significant at 1% with the respondents’ WTP in this study. This may be because ODL is stilla relatively new learning mode and environment in Malaysia although it has been in the market for more than 10 years. If learners stand to gain more from a particular university program, they maywell be supportive of the ODL learning mode. The findings of this study suggest that the economic value of ODL learning in Malaysia is substantial and respondents are generally supportive and willing to pay to study in ODL mode.
Ideally, the result will ensure the ODLprovider will have the ability to narrow the digital divide in education. Meanwhile, its current philosophy of creating new and innovative courses to add on to its existing program list should not be neglected, even more so it should be balanced with practical and theoretical input. Indeed, it will live up to its policies of widening access to education, providing lifelong learning opportunities and giving everyone a second chance for education; a university that thrives on knowledge preservation and socialization of citizens.
REFERENCES
Adamowicz, W Boxall, P, Williams, M., & Louviere, J. (1998). Stated 2preference approaches for measuring passive use values: Choice experiments and contingent valuation. American Journal of Agricultural Economics,80(1),64-75
Alpizar, F, Carlsson, F, and Martinsson, P. (2001) Using choice experiments for non-market valuation. Working Papers in Economics,No.52.Department of Economics Goteborg University.
Bateman, I.J., Carson, R.T., Day, B., Hanemann, M., Hanley, N., Hett, T., Jones-Lee, M., Loomes, G., Mourato, S., Ozdemiroglu, E., Pearce,D., Sugden,R. and Swanson,J., (2002), Economic Valuation with Stated Preference Techniques: A Manual.London, UK:Edward Elgar.
Brown, J.D.(1991). Identifying benefit segments among college students. The Journal of College Admission. (Spring) 30-33.
Hanley, N.,&Barbier, E. B. (2009). Pricing nature: Cost benefits analysis and environmental policy. Edward Elgar.
Jonassen, D. (1991). Objectivism versus constructivism: Do we need a new philosophical paradigm? Educational Technology Research & Development, 39(3),5-14.
Joseph M., Yakhou M., &Stone, G. (2005). An Educational Institution’s Quest for Service Quality: Customers’ perspectives. Qual.Assur. Educ., 13(1), 66-82
Layton, D., & Brown, G (1998). Application of stated preference methods to a public good: Issues for discussion. NOAA Workshop on the Application of Stated Preference Methods to Resources Compensation, Washington, DC.
Plank, R. E., & Chiagouris, L. (1998). Perceptions of quality of higher education: An exploratory study of high school guidance counsellors, Journal of Marketing for Higher Education, 8(10), 55-67.
Train,K. (2003).Discrete Choice Methods with Simulation.New York, NY: Cambridge University Press
Vygotsky, L.S. (1978). Mind in society: The development of higher psychological processes. Cambridge, MA: Harvard University Press.
Webb, E., Ashton, C.H., Kelly, P., & Kamali, F., (1998).An update on British medical students’ lifestyles.Med. Educ.,32, 325–331.