doi:10.1251/bpo128 February 20, 2007
A method for detecting functional activity related expression in gross brain
regions, specific brain nuclei and individual neuronal cell bodies and their
projections
Mark Murphy
1*, Ursula Greferath
1and Yvette M. Wilson
11Department of Anatomy and Cell Biology, University of Melbourne, Melbourne, Victoria, 3010. Australia.
*Corresponding Author: Mark Murphy, University of Melbourne, Melbourne, Victoria, 3010. Australia. Email: [email protected]
Submitted: August 30, 2006; Revised: October 18, 2006; Accepted: October 18, 2007.
Indexing terms: Mice, Transgenic; Brain Chemistry; beta-Galactosidase.
ABSTRACT
We have developed a system to visualize functionally activated neurons and their projections in the brain. This system utilizes a transgenic mouse, fos-tau-lacZ (FTL), which expresses the marker gene, lacZ, in neurons and their processes after activation by many different stimuli. This system allows the imaging of activation from the level of the entire brain surface, through to individual neurons and their projections. The use of this system involves detection of neuronal activation by histochemical or immunohistochemical detection of β-galactosidase (βgal), the product of the
lacZ gene. Furthermore, the underlying brain state of the FTL mice determines the basal levels of expression of βgal. Here we describe in detail our protocols for detection of FTL expression in these mice and discuss the main variables which need to be considered in the use of these mice for the detection and mapping of functionally activated neurons, circuits and regions in the brain.
INTRODUCTION
A central aim in neurobiology is to determine the neural components and circuitry which are responsible for a given brain function. Traditionally, the connections a neuron makes have been identified using techniques such as electrophysiological recordings, histochemical techniques, anterograde or retrograde tracers, and functional imaging. While these approaches have particular and powerful benefits, they also all have drawbacks that limit their usefulness in the mapping of functionally activated circuits. For example, electrophysiology and functional imaging do not visualize connectivity, and tracers are not targeted to functionally activated neurons.
One approach to determine which parts of the brain are involved in a particular function is to look for markers of neuronal activation. One group of markers, the
immediate early genes, code for inducible transcription factors and are rapidly transcribed following neuronal stimulation. Of these genes, c-fos is the most studied and is induced by a wide range of different stimuli, eg depolarization, calcium influx, many different neurotransmitters (1-4). However, since c-fos is expressed exclusively in the cell nucleus, its localization does not provide information of the connectivity or the morphology of activated neurons within the nervous system. We have generated transgenic mice in which an axon targeted β-galactosidase (βgal) reporter system (5) is under the regulation of the promoter of the c-fos gene (6). In these fos-tau-lacZ (FTL) transgenic mice, neurons that express c-fos will target βgal expression to axons and dendrites via the tau sequences in the fusion protein. This permits direct visualization of neuronal cell bodies and their projections using a simple enzymatic assay (6) or immunohistochemistry. Thus, the FTL transgenic mice have certain advantages in imaging functionally activated areas and circuits in the central nervous
system, in that it allows the identification of cell bodies and their projections and therefore may aid in imaging functionally activated circuitry.
Here we describe a number of different methods we have used to visualize activated neurons and their projections, activated brain nuclei, and the brain surface using the FTL mice. Depending on the resolution and brain area to be assessed, different types of immunological or histochemical detection of βgal can be used. We present our current protocols for each of these methods.
MATERIALS AND METHODS
Animals
Mice were males or female transgenic heterozygote FTL
mice aged between 2 and 3 months. Animals were housed in a room with a 12-hour light-dark cycle. All experimental procedures adhered and were approved by the Institutional Animal Care and Use Committee of the University of Melbourne. Food and water were supplied
ad libitum. For analysis of βgal expression under basal conditions, mice were taken from their home cages and immediately injected intraperitoneally with a lethal
overdose (100 µl) of Lethabarb (Virbac, Peakhurst,
Australia). After the animals were deeply anaesthetised, they were transcardially perfused with 12 ml of chilled 5% sucrose in H20 followed by the 25 ml of chilled 4% paraformaldehyde in 0.1M phosphate buffer (pH 7.4; PFA). After 15 min, brains were removed and post-fixed in fresh 4% PFA for 15 min at 4°C, transferred to 20% sucrose in phosphate buffered saline (PBS) and equilibrated for 48 hr at 4°C. Brains were then frozen in Tissue-Tek (Sakura, Tokyo, Japan) and cryostat sections cut (50 or 100 µM) and collected in wells of 24 well tissue culture plates (1-2 sections/well) in PBS.
βgal enzymatic assay
For detection of βgal enzymatic activity, PBS was
aspirated and sections incubated in Stain buffer (5 mM MgCl2, 5mM potassium ferrocyanide, 5 mM potassium ferricyanide, and 0.4 mg/ml 5-Bromo-4-chloro-3-indolyl-B-D-galatocpyranoside (X-gal) (Astral, Gymea, Australia)) for 24 hr at room temperature (RT). After staining, sections were rinsed in PBS and stored in 4%
PFA until mounting by placing into 0.5% gelatin in H20 before transferring to slides coated with 0.5% gelatin, 10% potassium chromium alum. Sections were allowed to dry, dehydrated through graded alcohols to histolene, rehydrated through graded alcohols, rinsed in water and counterstained in 0.05% Nuclear Fast Red in 5% aluminium sulphate for 15 min. Sections were rinsed in
H2O, dehydrated again and mounted in Safety Mount
(Fronine, Riverstone, Australia). Sections were analyzed microscopically and areas which were βgal positive were identified by comparison with an atlas of the mouse brain (7).
Immunohistochemistry
For βgal immunohistochemistry, cryostat sections, either free-floating or mounted, were incubated overnight at 4ºC in rabbit anti-βgal antisera (MP Biomedicals, Solon, USA) diluted 1:20,000 in 10% CAS-Block (Zymed, San Francisco, USA), 0.1% Triton X-100 in PBS. After washing in PBS, sections were incubated for 1 hr in Alexa Fluor 488 goat anti-rabbit IgG (Molecular Probes, Eugene, USA) diluted 1:500 in PBS. Sections were washed in PBS; if free-floating, they were mounted onto gelatinized slides, and coverslipped in Fluorescent Mounting Medium (DakoCytomation, Glostrup, Denmark). If already mounted, the sections were directly coverslipped in the same medium.
Alternatively, after washing in PBS, sections were incubated in biotinylated goat anti-rabbit IgG diluted 1:400 in 10% CAS-Block, 0.1% Triton X-100 in PBS for 1 hr. Immunoreactivity was visualized with
StreptABComplex/horseradish peroxidase (DakoCytomation, Glostrup, Denmark), and
Metal-Enhanced DAB (Pierce, Rockford, USA). Mounted sections, (or if free-floating, the sections were first mounted onto gelatinized slides) were air dried, dehydrated and coverslipped in Safety Mount.
Photographic imaging
microscopy, sections were imaged with a Zeiss Axioplan 2 microscope (Zeiss, Oberkochen, Germany) fitted with a Bio-Rad 1024 confocal illuminating system (Bio-Rad, Sydney, Australia) using a x100 objective and the appropriate fluorescence filter.
RESULTS AND DISCUSSION
We have used a number of different detection methods for the visualisation of βgal in neurons of the mice. These methods are the histochemical detection of βgal activity, and immunocytochemical detection. For the immunochemistry, we have used both fluorescence and peroxidase detection methods. Each of these methods has particular advantages. As follows, we describe the images we obtain with these methods and their particular advantages with regard to different levels of resolution and sensitivity to detect c-fos related activation in the brain.
Histochemical detection of βgal
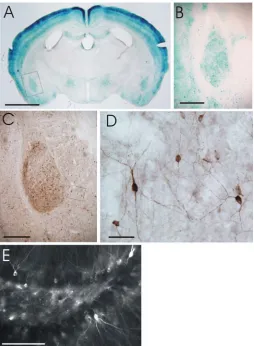
The most convenient method of detection of βgal is the histochemical detection of βgal enzymatic activity. In regions containing active βgal, the cleavage of the Xgal substrate results in the deposition of a fine blue crystalline precipitate. In sections of brain of the FTL
mouse, this method of detection is suitable for analysis of whole brain sections at low and medium power (Fig. 1A and B). In many parts of the brain, βgal histochemistry can resolve the structures of individual neurons (Fig. 1B). However, in areas of high density of positive neurons,
such as cortex, the pattern of staining using βgal
histochemistry does not resolve individual neurons and axons. In these regions, there is a lot of staining within axons, and the blue precipitate formed in the histochemical reaction does not have enough precision to accurately resolve the very fine processes of many separate axons. In these regions, the staining will appear as blue cell bodies within a uniform blue pattern. A uniform blue pattern of staining is also seen in major tracts in the brain which are βgal positive, such as anterior commissure and corpus callosum.
The blue staining pattern is easy to detect macroscopically in the FTL mouse and it is simple to determine which brain structures have βgal activity, because the FTL product is found throughout the cell
body and neuronal processes. This is one of the principle
advantages of the FTL mouse compared with
immunohistochemistry for FOS, where only cell nuclei are labelled. Because the βgal expression fills the entire cell in the FTL mouse, the pattern of βgal expression often encompasses the brain structure which is activated (Fig. 1), whereas in sections stained for FOS, the FOS positive dots do not form such a clear pattern correlating with a particular brain structure. In FTL mice, brain tracts also stain for βgal if they are projecting from activated regions of the brain (6), whereas FOS immunohistochemistry is not detected in tracts as it is only expressed in the nucleus of neuronal cell bodies Another advantage of βgal histochemistry is that there is no background staining. This means that positive staining is easy to detect and quantitate. Our preferred method of quantification employs the determination of a brightness area product over the brain region of interest (8).
βgal immunohistochemistry
An approach which offers good resolution of individual neurons and processes involves immunohistochemistry
with antibodies to βgal and detection either with
peroxidase-labeled or fluorophore-labeled secondary antibodies. Immunohistochemistry with peroxidase-labeled secondary antibodies results in similar resolution of staining compared to βgal histochemistry. There are some advantages and disadvantages of this technique compared with histochemistry. The primary advantage is that there is an increase in resolution of cell bodies and processes in regions of the brain containing a high density of FTL positive neurons, in particular in cortex (9) (Fig. 1C, D shows amygdala region). A disadvantage is that there is low level background staining, so that the areas of negative to low expression are not as clean and clear compared with βgal histochemistry.
the images pooled to reconstruct a composite image of the neuron (6).
Fig. 1: Examples of different modes of detection of activated FTL expression in brains of FTL mice. (A) and (B) show detection of FTL expression in neurons using βgalhistochemistry. (A) shows a low power view of a coronal section of the brain (approximate Bregma - 1 mm) from an FTL mouse which had received a mild aversive stimulus (all sections were from mice which had received a footshock of 0.5 mA for 2 seconds). (B) shows higher power view of region boxed in (A), and which shows the basolateral complex of the amygdala. (C) and (D) shows detection of FTL expression in neurons using βgalperoxidaseimmunohistochemistry. (C) shows similar view as (B), and contains basolateral complex of amygdala. (D) shows higher power view of region boxed in (C). (E) shows FTL expression in dentate gyrus neurons using βgal fluorescence immunohistochemistry. Scale bars: A, 2 mm; B and C, 400 µm; D, 50 µm; E. 100 µm.
This method is reliable and has the advantage of good signal and low background. It is also very useful for double labeling studies to further identify the labeled functional circuits (9). Some problems can arise if the titer of either primary or secondary antibody is not fully optimized, which will result in either a low signal or high background. In addition, this method is normally only suitable for analysis of small regions of the brain,
because the fluorescent signal is difficult to detect at low power. In some situations, where the FTL expression is particularly strong, this technique can be used for the analysis of entire brain sections (8).
Whole brain histochemistry
The overall patterns of expression in the cortex of FTL
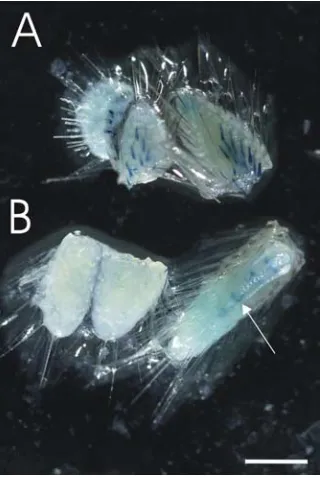
animals can be simply examined using whole-brain histochemical staining. We have used whole brain staining to look at patterns of FTL expression in response to visual stimuli, and in particular to examine light responsive regions of the cortex (9). In animals which have been housed in the dark for several days, and thus have had no light input, the primary visual cortex can be clearly distinguished as a roughly circular patch of white on the brain surface (Fig. 2A). In animals housed under normal light conditions, this area is filled with blue staining (Fig. 2B).
Fig. 2: Detection of FTL expression on the surface of the brain using whole brain βgalhistochemistry. Shown are side views of posterior cortex of brain from an FTL mouse which had been (A) housed in the dark for 3 days and (B) housed in an environment with a 12 hr dark/12 hr light cycle. The primary visual cortex is circled. Scale bar = 250 µm.
Behavioral state of mice
In our studies, we have found βgal expression in the FTL
mouse brain to be a sensitive indicator of brain state. For example, if FTL mice are taken immediately from their home cage and their brains analyzed for βgal expression, some variation in expression of βgal is found between individual mice, in particular in cortical regions and hypothalamus. We believe this is due to different degrees of brain activation, and have found that if mice are given periods of exposure to an enriched
environment (10), both the level of βgal staining
6. Wilson Y, Nag N, Davern P, Oldfield BJ, McKinley MJ, Greferath U, Murphy M. Visualization of functionally activated circuitry in the brain. Proc Natl Acad Sci USA 2002; 99:3252-3257.
important to point out that the behavioural state of the mice will influence their βgal expression patterns, and this needs to be taken into consideration for any experiments where these mice are used to determine which parts of the brain are activated following any given stimulus. In particular, any stimuli which may stress the mice will also affect expression in stress-responsive systems of the brain.
7. Paxinos G, Franklin KBJ. The mouse brain in
stereotaxic coordinates, 2nd ed. (San Diego: Academic Press, 2001).
8. Smith PD, McLean KJ, Murphy MA, Wilson Y,
Murphy M, Turnley AM, Cook MJ. A brightness-area-product-based protocol for the quantitative assessment of antigen abundance in fluorescent
immunohistochemistry. Brain Res Brain Res Protoc
2005; 15:21-29.
ACKNOWLEDGMENTS
This work was supported by the National Health and Medical Research Council of Australia.
9. Greferath U, Nag N, Zele AJ, Bui BV, Wilson Y,
Vingrys AJ, Murphy M. Fos-tau-LacZ mice expose light-activated pathways in the visual system.
Neuroimage 2004; 23:1027-1038.
REFERENCES
1. Chaudhuri A. Neural activity mapping with
inducible transcription factors. Neuroreport 1997;
8:iii-vii. 10. Nithianantharajah J, Hannan AJ. Enriched environments, experience-dependent plasticity and
disorders of the nervous system. Nat Rev Neurosci
2006; 7:697-709.
2. Herdegen T, Leah JD. Inducible and constitutive
transcription factors in the mammalian nervous system: control of gene expression by Jun, Fos and Krox, and CREB/ATF proteins. Brain Res Rev 1998; 28:370-490.
11. Murphy M, Greferath U, Nag N, Nithianantharajah J, Wilson YM. Tracing functional circuits using c-fos regulated expression of marker genes targeted to neuronal projections. Front Biosci 2004; 9:40-47.
3. Morgan JI, Curran T. Stimulus-transcription
coupling in the nervous system: involvement of the
inducible proto-oncogenes fos and jun. Annu Rev
Neurosci 1991; 14:421-451.
12. Cragg B. Preservation of extracellular space during fixation of the brain for electron microscopy. Tissue Cell 1980; 12:63-72.
4. Herrera DG, Robertson HA. Activation of c-fos in the brain. Prog Neurobiol 1996; 50:83-107.
5. Callahan CA, Thomas JB. Tau-beta-galactosidase, an axon-targeted fusion protein. Proc Natl Acad Sci USA
PROTOCOLS
1. Breeding the mice
We currently breed the FTL mice as a heterozygous colony by out breeding with C57/Bl6 mice. As heterozygotes, the mice are indistinguishable from C57/Bl6 mice with regard to viability and behaviour. It may also be possible to use homozygous FTL mice, but we have not investigated this possibility in any depth.
2. Phenotyping the mice
We find that phenotyping FTL mice for βgal activity is simpler than genotyping to determine the transgenic status of the mice. We phenotype by detecting βgal activity in tail biopsies, as follows:
Tail Assay. Cut off tail tips (0.3-0.5 cm) and cut in half along the long axis, remove the bone fragments and collect into PBS in a 24 well tissue culture plate (or similar). Tails can be collected from 3-4 week old mice at weaning; however, the tail phenotype in mice of this age can be weak and variable in some mice. This variable detection is overcome by incubating tails in Stain buffer with a high concentration of 5-Bromo-4-chloro-3-indolyl-B-D-galatocpyranoside (X-gal). Thus, Remove PBS from tails and add high X-gal Stain buffer (5 mM MgCl2, 5 mM potassium ferrocyanide, 5 mM potassium ferricyanide, and 2 mg/ml X-gal (Astral, Sydney, Australia)); ~500 µl per well is sufficient. Incubate overnight at room temperature using rotation or agitation. Check for positive hair follicles, i.e. the presence of blue staining of the base of the hair follicles, using a stereomicroscope (Fig. 3). There can also be blue staining in the bone (which is why it advisable to remove the bone) which is due to endogenous βgal activity, and can be present in both transgenic and non-transgenic animals (Fig. 3). The presence of bone fragments interferes with the penetration of the buffer into hair follicles underneath the bone and visualizing the hair follicles when the assay is scored.
3. Staining brain sections for βgal activity
1. βgal histochemistry. This procedure is recommended for low to intermediate resolution analysis of brain sections. It has the advantage of low background and strong signal, is easy to detect micro- and macroscopically, but has lower resolution compared to βgal immunohistochemistry at the level of single neurons and fine morphological detail.
Perfusion fixation: Inject the mouse intraperitoneally, with 100µl of Lethabarb (Virbac, Peakhurst, Australia). When the mouse is deeply anesthetized (no response to paw pinch) open the chest cavity, locate the right atria of the heart and make a small incision. Using a 10 ml syringe and 25G needle transcardially perfuse 12 ml of 5% sucrose in H2O
through the left ventricle of heart followed by 25 ml of freshly prepared 4% PFA. Perfusion first with sucrose in H2O
was used to decrease tissue shrinkage (12). Monitor the success of perfusion by appearance of tissue during and after the perfusion. Indications that the perfusion is successful are tissue (such as liver, brain and kidney) clears of blood, the lungs do not expand, no liquid emerges through the nose or mouth and the whole carcass becomes stiff. Dissect brains and postfix in at least 50 ml of the same fixative for 15 min at 4ºC. Wash twice in PBS to remove the fixative, cyroprotect and snap-freeze specimens, as described below.
Cryoprotection and freezing: place brains in20% sucrose in PBS for 24-48hr at 4°C to equilibrate the specimens. Remove brains from the sucrose and embed in an embedding medium for frozen tissue specimens such as Tissue-Tek OCT (Sakura Tokyo, Japan). Snap-freeze on isopentane cooled by liquid nitrogen.
Sectioning: Cryostat sections can be collected directly on to coated glass slides (15-50 µm sections) as described above, or as free-floating (50-100 µm) sections. Freezing microtome sections (30-100 µm) can also be collected as free-floating sections.
Slide-mounted sections, four per slide, are directly mounted onto 0.5% gelatine / 5% chromium potassium sulphate coated slides. Taking up the section into in a drop of PBS on the slide ensures bubbles and folds in the brain sections are minimised. The sections are dried at room temperature for a minimum of 2 hours. When well air-dried the slides are placed into a coplin jar, rinsed once in PBS and incubated with enough Stain buffer, containing a standard concentration of 0.4 mg/ml X-gal (~50 ml) to cover the slides.
For free-floating sections, one to two sections are collected into PBS in 24-well tissue culture plates. Sections can be used immediately for detection of βgal activity or left overnight at 4°C in PBS. For histochemical staining, sections are incubated in 500 µl Stain buffer per well.
Notes regarding staining
We normally stain for 24 hr at room temperature using rotation. However the incubation times can be shorter or longer depending on how much activity you want to visualize. If enzymatic activity is high the yellow stain solution will gradually become colorless, as the components of the solution are being catalyzed. If this happens, fresh Stain buffer should be added or the original volume you incubate in should be increased.
The enzymatic activity of the slide-mounted sections is stopped by removing the Stain buffer, rinsing in PBS and air drying the sections. The activity of the free-floating sections is stopped by removing the Stain buffer and adding ~500
µl 4% PFA per well. The free-floating sections can be stored in PFA indefinitely. When ready to mount place the sections into 0.5% gelatin in H2O and mount onto 0.5% gelatin / 5% chromium potassium sulphate coated slides and
Sections can be counterstained, for example, with Nuclear Fast Red, which contrasts well with the blue precipitate formed by the enzymatic activity. If counterstaining in an aqueous counterstain the air-dried sections must first be delipidated by taking sections from histolene through graded alcohols to water. Sections can then be counterstained in 0.05% Nuclear Fast Red in 5% aluminum sulphate for 15 min, rinsed in H2O, dehydrated through graded alcohols to
histolene and mounted in Safety Mount (Fronine, Riverstone, Australia).
1. Immunohistochemistry. We use both peroxidase and fluorescence immunohistochemistry for detection of βgal. Immunoperoxidase detection is good for intermediate resolution analysis. It is easy to see both microscopically and macroscopically, but has some background. It has generally better resolution of individual neurons and processes
compared with βgal histochemistry. Fluorescence immunohistochemistry has very good resolution of cells and
processes, has relatively low background, but is generally only suitable for examining small regions of the brain. For
βgal immunoreactivity, we currently use the same perfusion, fixation, cryoprotection and sectioning conditions as those for βgal histochemistry. For immunohistochemistry we use 20-50 µm sections.
Staining: After air-drying slide-mounted cryostat sections for 2-4 hours, remove dried embedding material around the sections using a cotton-tipped applicator and water. Wax pens do not adhere well to slides if embedding material is still present around the sections; do not wet the sections at this stage. When slides have been cleaned use a wax pen, DakoCytomation Pen (DakoCytomation Glostrup, Denmark), to draw an encircling margin around each section.
Incubate sections in 10% CAS-Block (Zymed, San Francisco, USA) in 0.1% Triton X-100 in PBS at RT for 30 min in a humidified chamber. For all incubations, 50 µl is adequate to cover a single section. Remove the solution and add rabbit anti-βgal primary antibody (MP Biomedicals, Solon, USA) diluted 1:20,000 in the same solution. Incubate overnight in a humidified chamber at RT. The same solution with no added antibody is applied to the no primary control sections. Wash slides 3 times for 5 min in PBS.
For detection of immunoreactivity using peroxidase apply anti-rabbit biotinylated secondary antibody (Vector, Burlingame, USA) diluted 1:400 in 10% CAS-Block, 0.1% Triton X-100 in PBS and incubate for 1 hr at RT. Wash slides 3 times for 5 min in PBS. Add StrepABComplex/horseradish peroxidase (DakoCytomation Glostrup, Denmark), prepared according to kit instructions, for 1 hr at RT. Immunoreactivity is visualized using Metal-Enhanced DAB (Pierce, Rockford, USA).
For staining using fluorescence detection, incubate for 1 hr at RT in Alexa Fluor 488 goat anti-rabbit IgG (Molecular Probes, Eugene, USA) diluted 1:500 in PBS for 1 hr at RT. Rinse with PBS and coverslip slides with Fluorescent Mounting Medium (DakoCytomation, Glostrup, Denmark).