* Corresponding author. Tel: +9437282982 E-mail: [email protected] (A. Kumar Sahoo) © 2014 Growing Science Ltd. All rights reserved. doi: 10.5267/j.ijiec.2014.11.001
International Journal of Industrial Engineering Computations 6 (2015) 229–240
Contents lists available at GrowingScience
International Journal of Industrial Engineering Computations
homepage: www.GrowingScience.com/ijiec
Response surface and artificial neural network prediction model and optimization for surface roughness in machining
Ashok Kumar Sahoo*, Arun Kumar Rout and Dipti Kanta Das
School of Mechanical Engineering, KIIT University, Bhubaneswar-24, Odisha, India
C H R O N I C L E A B S T R A C T
Article history: Received July 9 2014 Received in Revised Format October 23 2014
Accepted November 2 2014 Available online
November 6 2014
The present paper deals with the development of prediction model using response surface methodology and artificial neural network and optimizes the process parameter using 3D surface plot. The experiment has been conducted using coated carbide insert in machining AISI 1040 steel under dry environment. The coefficient of determination value for RSM model is found to be high (R2 = 0.99 close to unity). It indicates the goodness of fit for the model and high
significance of the model. The percentage of error for RSM model is found to be only from -2.63 to 2.47. The maximum error between ANN model and experimental lies between -1.27 and 0.02 %, which is significantly less than the RSM model. Hence, both the proposed RSM and ANN prediction model sufficiently predict the surface roughness, accurately. However, ANN prediction model seems to be better compared with RSM model. From the 3D surface plots, the optimal parametric combination for the lowest surface roughness is d1-f1-v3 i.e. depth of cut of 0.1 mm, feed of 0.04 mm/rev and cutting speed of 260 m/min respectively.
© 2015 Growing Science Ltd. All rights reserved
Keywords:
Response surface model ANN
Optimization Factorial design Machining
1. Introduction
Machining is a chip removal process in which less utility and less value raw materials are converted into high utility and valued products with definite dimensions, forms and finish, which satisfies some function. Solid-state manufacturing processes can be broadly classified in to metal forming and metal machining. During metal forming, the volume is conserved and shape is achieved through deforming the material plastically in processes like forging, rolling, drawing etc. However, these mostly serve as primary or basic operations for typical products. In around eighty percent of components produced through metal forming, machining is essentially required to achieve dimensional accuracy, form accuracy and good surface finish to achieve the functional requirements.
formed an important design feature in demanding situations arising of fatigue loads, precision fits, corrosion resistance and aesthetic requirements. The surface quality is affected by the process parameters, machine tool condition, cutting tool geometry and condition and the machining operations. Therefore, research in the field of surface quality in machining is highly essential for functional requirements of the products. The surface roughness prediction model and optimization of process parameters is especially important for achieving better surface quality in machining. Therefore, the present paper deals with these aspects in details.
2. Review of literature
Gökkaya and Nalbant (2007a) observed that lower surface roughness was induced using a CVD multi
layer coated tool outermost with TiN compared to uncoated, coated with AlTiN and coated with TiAlN using the PVD technique during dry turning of AISI 1015 steel. Tıgıt et al. (2009) compared the wear behavior of multilayer-coated carbide tools (TiCN+TiC+Al2O3+TiN) with different coating thickness
of 7.5μm and 10.5μm to uncoated carbide tool. Multilayer TiN coated carbide tool with 10.5μm thickness performed better than uncoated carbide insert with respect to surface quality and cutting forces in machining spheroidal graphite cast iron in all cutting speeds. This indicated economical machining with respect to cutting energy and power consumptions.
Gillibrand et al. (1996) studied the economic benefit of finish turning with coated carbide and uncoated carbide cutting tool. It was observed that the machining cost using coated carbide is 30% less than uncoated carbide during finish turning of medium carbon steel. The surface roughness was low using TiN coated carbide tools and an improvement in tool life between 250 and 300% compared to uncoated carbide tools are achieved. Noordin et al. (2001) compared the performance of coated and uncoated carbide inserts during finish turning of AISI1010 steel. The tool of (CVD TiCN/TiC and PVD with TiN) performed better than CVD with (TiCN/TiC/Al2O3) and uncoated carbide insert as lower forces
and surface roughness obtained and chips with minimum thickness produced that contributed to low chip strain and low residual stresses on the workpiece surface.
Che Haron et al. (2007) reported that the surface roughness for uncoated carbide tools was in the range of 0.36-4.05 μm and 0.30-1.51μm for coated carbide insert (CVD TiN/ Al2O3/TiCN) respectively
during turning AISI D2 (22 HRC) steel. The lowest surface roughness value for both types of carbide tools were observed at cutting speed of 250 m/min and feed rate of 0.05 mm/rev. Gökkaya and Nalbant
(2007b) investigated the effects of different insert radii, depths of cut and feed rates on the surface
quality of the work pieces during machining of AISI 1030 steel without coolant by CVD multilayer coated carbide [TiC/Al2O3/TiN (outermost is TiN)] insert. It was observed that increase of insert radius
decreases the surface roughness and increasing cutting speed and depth of cut increases the surface roughness.
Nalbant et al. (2007) found that, greater insert radius; low feed rate and low depth of cut could be recommended to obtain better surface roughness in turning AISI 1030 steel with TiN coated carbide insert. The experiment was performed utilizing Taguchi L9 orthogonal array. Noordin et al. (2004)
described the performance of a multilayer coated WC tool (TiCN/Al2O3/TiN) of CNMG120408-FN
and TNMG120408-FN type during turning AISI 1045 steel (187 BHN) based on central composite design and response surface methodology (RSM). The feed was the most significant factor for surface roughness and the tangential force.
Dabnun et al. (2005) developed response model (surface roughness) utilizing factorial DOE and response surface methodology during machinability studies of glass ceramic using uncoated carbide inserts under dry cutting conditions. Feed rate was the main influencing factor on the roughness, followed by the cutting speed and depth of cut. Feng (2001) applied fractional factorial design approach to study the influence of turning parameters on surface roughness using multilayer coated carbide inserts (TiCN/Al2O3/TiN). Feed, nose radius, work material and speeds, the tool point angle
were found to be the influencing parameters on surface roughness.
Most dominant interactions were found between work materials, point angle and speeds. The depth of cut was found to insignificant for surface roughness. Nalbant et al. (2007) developed predictive neural network model and found better predictions than various regression models for surface roughness in machining AISI 1030 steel using coated carbide tool (TiC/ Al2O3/TiN). Feed rate and insert nose radius
were main influencing factors on the surface roughness. Depth of cut was not more informative than the other two. Sahoo and Sahoo (2011) developed RSM model for surface roughness and optimize the process parameter in machining D2 steel using TiN coated carbide insert. The developed RSM model sufficiently predicts the surface roughness in turning D2 steel.
Sahoo et al. (2013) presents the development of flank wear model in turning hardened EN 24 steel with PVD TiN coated mixed ceramic insert under dry environment. The paper also investigates the effect of process parameter on flank wear (VBc). The experiments have been conducted using three level full factorial design techniques. The machinability model has been developed in terms of cutting speed (v), feed (f) and machining time (t) as input variable using response surface methodology. The adequacy of model has been checked using correlation coefficients.
Quiza et al. (2008) performed experiment on hard machining of D2 steel (60 HRC) using ceramic cutting tools. Neural network model was found to be better predictions of tool wear than regression model. Park (2002) observed that PCBN cutting insert performed better in cutting force and surface roughness than ceramic tool in turning hardened steel. Feed rate was found to be significant on surface roughness while the effect of the cutting speed and depth of cut was negligible. The optimal cutting conditions for the best surface quality were selected by using Taguchi orthogonal array concept.
Ozel et al. (2007) found that neural network model was suitable to predict tool wear and surface roughness patterns for a range of cutting conditions in finish hard turning of AISI D2 steels (60 HRC) using ceramic wiper (multi-radii) design inserts. Lalwani et al. (2008) studied the effect of cutting parameters on cutting forces and surface roughness in finish hard turning using coated ceramic tool applying RSM and sequential approach using face centered CCD. A linear model fitted well to the variation of cutting forces and a non-linear quadratic model found suitable for the variation of surface roughness with significant contribution of feed rate. Depth of cut was significant to the feed force. For the thrust force and cutting force, feed rate and depth of cut contributed more.
Horng et al. (2008) developed RSM model using CCD in the hard turning using uncoated Al2O3/TiC
most influencing parameter for surface roughness followed by cutting speed whereas depth of cut has least significant from the experiments. In regression model, the value of R2 being 0.98 indicates that 98
% of the total variations are explained by the model. It indicates that the developed model can be effectively used to predict the surface roughness on the machining of D2 steel with 95% confidence intervals. Pal and Chakraborty (2005) developed a back propagation neural network model for the prediction of surface roughness in turning operation of mild steel workpiece using high speed steel as the cutting tool. The performance of the trained neural network was tested with experimental data, and found to be in good agreement. Tsao and Hocheng (2008) predicted and evaluated thrust force and surface roughness in drilling of composite material using Taguchi method and the artificial neural network. A correlation was established between the feed rate, spindle speed and drill diameter. The correlations were obtained by multi-variable regression analysis and radial basis function network (RBFN) and compared with the experimental results. The results indicated the RBFN is more effective than multi-variable regression analysis.
Davim et al. (2008) developed surface roughness prediction models using artificial neural network (ANN) during turning of free machining steel and reported that the cutting speed and feed rate had significant effects in reducing the surface roughness, while the depth of cut has the least effect. Sharma et al. (2008) constructed neural network models for cutting forces and surface roughness for different cutting parameters such as approach angle, speed, feed and depth of cut. Surface roughness (Ra) was
positively influenced with feed and a negative trend was observed with approaching angle, speed and depth of cut. The neural network model for Ra predicted with moderate accuracy. Cutting force (Fc)
increased with the increase in approach angle, feed and depth of cut where as it decreased with speed. Passive force (Fp) increased with increase in depth of cut, speed and feed where as it decreased with
increase in approaching angle. Feed force (Ff ) increased with all variables, i.e. approaching angle,
speed, feed and depth of cut. The neural network model for cutting force (Fc) predicted with high
accuracy and for cutting force Fp predicted with moderate accuracy.
Ozel and Karpat (2005) predicted surface roughness and tool flank wear over the machining time through neural network modeling for variety of cutting conditions in finish turning of hardened AISI H-13 steel. It was observed that surface roughness reduced with the decrease in the feed rate, but the tool wear development was slightly faster. Also, it was observed that on increasing cutting speed, there was a significant increase in tool wear development but better surface finish was obtained. Bagci and Isik (2006) developed artificial neural network (ANN) and response surface (RS) model to predict the surface roughness on the turned part surfaces of unidirectional glassfibre reinforced plastics (GFRP), using cermet tools. They observed good agreement between the predictive model results and the experimental measurements.
Karayel (2009) presented a feed forward multilayered neural network for the prediction and control of surface roughness values for different turning conditions of st 50.2 steel, using a CNC lathe. It was observed that the feed rate was the dominant parameter for surface roughness and it increased rapidly with the increase in feed rate. The cutting speed had a critical value for which the best surface quality can be achieved. The effect of depth of cut on surface roughness was not regular and had a variable character. ANN produced an accurate relationship between cutting parameters and surface roughness. Sehgal and Meenu (2013) observed that the artificial neural network (ANN) model predicts with higher accuracy than response surface methodology (RSM) in context to surface roughness in end milling of Ductile Iron grade 80-55-06. TANSIG training transfer function along with PURELIN output transfer function is observed to be the most appropriate training transfer function.
1040 steel under dry environment. Next, the optimal parametric combination of process parameter has been obtained from 3D surface plot using RSM.
3. Experimental details
Over the last few years, coated carbide tools have been widely used; became popular and it is preferred to uncoated carbide tools in machining steels. For experimental investigations, commercially available PVD TiAlN coated carbide insert designated as CNMG 120408 EN-M52 was used and performed under dry environment. The 800 diamond-shaped insert is one of the popular inserts used with negative
side cutting edge angle. AISI 1040 steel rods of 25 mm diameter and 75 mm length were turned on a high rigid lathe (HMT, NH-22, India). The cutting insert has the following specification: coating thickness 2-5 μm, grain size 1μm, hardness 1560HV and nose radius of 0.8 mm. The insert is mounted on a tool holder designated by ISO PCLNR2525M12 with cutting geometry as follows: clearance angle (αo) = 60, negative rake angle (γo) = -60, negative cutting edge inclination angle (λ) = -60 and major
cutting edge angle or approach angle = 950, point angle = 800 and nose radius (r) = 0.8mm. The test
specimen AISI 1040 is widely used for bolts for machines, plows, and carriages; cylinder head stubs, U-bolts, concrete reinforcing rods, and springs.
Table 1
Process parameters and their levels
Parameters Notation Unit Levels of parameters
Level 1 Level 2 Level 3
Cutting speed v m/min 60 160 260
Feed f mm/rev 0.04 0.08 0.12
Depth of cut d mm 0.1 0.3 0.5
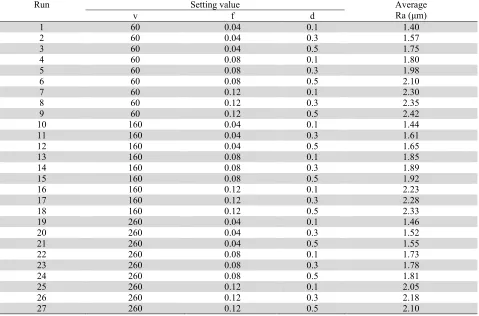
Table 2
Experimental observations
Run Setting value Average
Ra (μm)
v f d
1 60 0.04 0.1 1.40
2 60 0.04 0.3 1.57
3 60 0.04 0.5 1.75
4 60 0.08 0.1 1.80
5 60 0.08 0.3 1.98
6 60 0.08 0.5 2.10
7 60 0.12 0.1 2.30
8 60 0.12 0.3 2.35
9 60 0.12 0.5 2.42
10 160 0.04 0.1 1.44
11 160 0.04 0.3 1.61
12 160 0.04 0.5 1.65
13 160 0.08 0.1 1.85
14 160 0.08 0.3 1.89
15 160 0.08 0.5 1.92
16 160 0.12 0.1 2.23
17 160 0.12 0.3 2.28
18 160 0.12 0.5 2.33
19 260 0.04 0.1 1.46
20 260 0.04 0.3 1.52
21 260 0.04 0.5 1.55
22 260 0.08 0.1 1.73
23 260 0.08 0.3 1.78
24 260 0.08 0.5 1.81
25 260 0.12 0.1 2.05
26 260 0.12 0.3 2.18
The arithmetic surface roughness average (Ra) of workpiece material is considered as the performance measuring criteria. The process parameters and their levels are shown in Table 1 (cutting speed in the range of 60-260 m/min, feed of 0.04-0.12 mm/rev and depth of cut of 0.1-0.5 mm respectively). The measurements of surface roughness were performed by a surface roughness tester (Taylor Hobson, Surtronic 25) with 0.8 mm sampling length and 4mm traversing length respectively. The measurements were repeated three times at different locations and average value was reported. The average surface roughness (Ra) was used to evaluate the surface roughness of machined surface. Experimental design by full factorial design (FFD) with three factors and three levels involves 27 numbers of experiments. The experimental results have been shown in Table 2.
4. Results and discussions
4.1. Prediction model (RSM and ANN)
Taking surface roughness as output and process parameters (cutting speed, feed and depth of cut) as input, the prediction model using response surface methodology (RSM) has been developed at 95% confidence level. Response surface methodology is a collection of mathematical and statistical techniques that are useful for the modeling and analysis of problems in which output or response is influenced by several input variables and the objective is to find the correlation between the response and the variables investigated (Montgomery, 1997). Using least square fitting, the model is developed. The experiments are conducted based on full factorial design, which gives a comparatively accurate prediction of surface roughness average. The first step of RSM is to find a suitable approximation for the true functional relationship between surface roughness and set of independent variables utilized. In the linear model, the surface roughness is well modeled by linear function. However, in the second order model like response surface methodology, there is a curvature in the system. The second order response surface representing the surface roughness (Ra, μm) can be expressed as a function of three process parameters such as v, f and d. It has been expressed applying regression analysis using least square method. The following second order equation for quality characteristics is obtained.
Ra = 0.8498 +0.0018 v + 9.1458 f + 1.4222 d -0.0000 v2 + 16.3194 f2 - 0.5972 d2 – 0.0115 vf - 0.0023 vd – 3.9583 fd
(R2 = 99.2 %, R2 (adj) = 98.8 %)
(1)
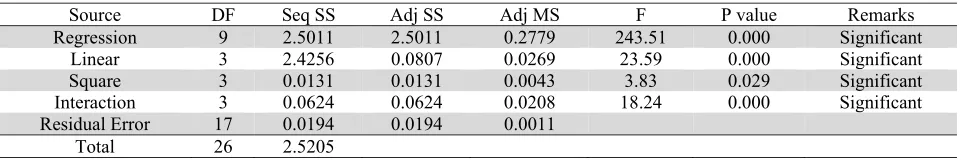
This analysis is carried out for a level of significance of 5%, i.e., for a level of confidence of 95%. For model adequacy checking, the residual plots are examined for a regression model with designed experiment. The normal probability plot should not show violations of the normality assumption. In the ANOVA (Table 3) of response surface model, analyzing of variance shows that the terms having the values of probability less than 0.05 are significant. Using uncoded units, models are developed. From the RSM model, it is evident that the regression is significant. In addition, regression, linear, square and interaction terms from the RSM model are significant because P value is less than 0.05.
Table 3
Results of ANOVA for Ra 2nd order model.
Source DF Seq SS Adj SS Adj MS F P value Remarks
Regression 9 2.5011 2.5011 0.2779 243.51 0.000 Significant
Linear 3 2.4256 0.0807 0.0269 23.59 0.000 Significant
Square 3 0.0131 0.0131 0.0043 3.83 0.029 Significant
Interaction 3 0.0624 0.0624 0.0208 18.24 0.000 Significant
Residual Error 17 0.0194 0.0194 0.0011
Total 26 2.5205
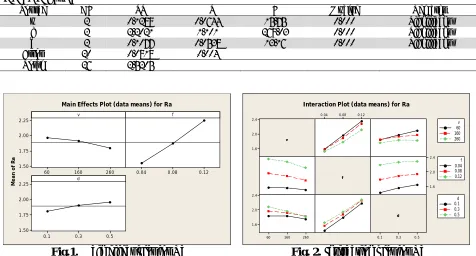
The main effect of feed was found to be the most significant factor. Each level of the factors affects the response differently. From ANOVA Table 4, main effect plot(Fig. 1)and interaction plot(Fig.2), it is
depth of cut. From interaction plot, all the interaction terms are significant. Also from the Eq. (1), it is seen that the RSM model has high determination coefficient (R2 = 0.99 close to unity). It describes
99% of the variability in the response. It indicates the goodness of fit for the model and high significance of the model. In addition, the adjusted R2 value is very close to the predicted R2.
Therefore, the predicted R2 is in reasonable agreement with the adjusted R2. It is evident that the
unnecessary terms are not added in the model. This analysis showed that the prediction model sufficiently explains the relationship between surface roughness and the independent variables.
Table 4
ANOVA for Ra
Source DF SS MS F P value Remarks
v 2 0.1289 0.0644 15.75 0.000 Significant
f 2 2.2021 1.101 269.03 0.000 Significant
d 2 0.1077 0.0538 13.16 0.000 Significant
Error 20 0.0818 0.004 Total 26 2.5205
Me a n o f R a 260 160 60 2.25 2.00 1.75 1.50 0.12 0.08 0.04 0.5 0.3 0.1 2.25 2.00 1.75 1.50 v f d
Main Effects Plot (data means) for Ra
vv 2.4 2.0 1.6 ff d d 0.5 0.3 0.1 0.12 0.08 0.04 2.4 2.0 1.6 260 160 60 2.4 2.0 1.6 v 260 60 160 f 0.12 0.04 0.08 d 0.5 0.1 0.3
Interaction Plot (data means) for Ra
Fig.1. Main effect plot for Ra Fig. 2. Interaction plot for Ra
The data closely follows the straight line, which is observed from the Anderson-Darling tests (Fig. 3). Since the P value is greater than 0.05 (at 95 % confidence level), it signifies that the data follows a normal distribution and the model developed by Eq. (1) is suitable and quite adequate. The normal probability plot (Fig. 4) gives the information about the residuals, which is close to the straight line. It indicates that the errors are distributed normally and proposed model is significant.
Ra Pe rc e n t 2.8 2.6 2.4 2.2 2.0 1.8 1.6 1.4 1.2 1.0 99 95 90 80 70 60 50 40 30 20 10 5 1 Mean 0.409 1.891 StDev 0.3114 N 27 AD 0.366 P-Value
Probability Plot of Ra
Normal (CI:95%) Residual Pe rc e n t 0.050 0.025 0.000 -0.025 -0.050 -0.075 99 95 90 80 70 60 50 40 30 20 10 5 1
Normal Probability Plot of the Residuals
(response is Ra)
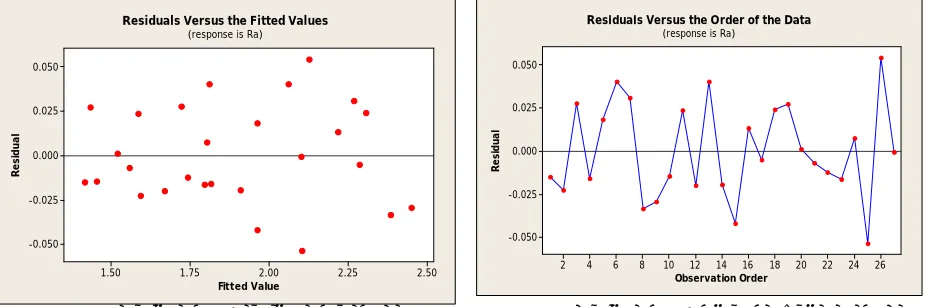
The graph of residuals vs. fitted values isshown in Fig. 5. No unusual structure is apparent except one point that is much larger or smaller than the others are. As its standardized residual is within the range of -3 to 3, the model proposed is significant. The graph of residual vs. order of data (Fig. 6) shows the
residual for the run order of experiment. This implies that the residuals are random in nature and do not exhibit any pattern with run order. In addition, figure of residual vs. order of data revealed that there is no noticeable pattern or unusual structure present in the data.
Fitted Value
Re
si
d
u
a
l
2.50 2.25
2.00 1.75
1.50 0.050
0.025
0.000
-0.025
-0.050
Residuals Versus the Fitted Values
(response is Ra)
Observation Order
Re
si
d
u
a
l
26 24 22 20 18 16 14 12 10 8 6 4 2 0.050
0.025
0.000
-0.025
-0.050
Residuals Versus the Order of the Data
(response is Ra)
Fig. 5. Residuals vs. fitted value for Ra Fig. 6. Residuals vs. order of the data for Ra
Another predictive model based on ANN (Artificial neural network) is employed, and the experimental results are compared with it and also with RSM model. The neural network is constructed using the experimental database. About 80% of data are used for training, whereas 20% of data are used for testing of the model. The selected and optimized parameters for training of the ANN model have been presented in Table 5.
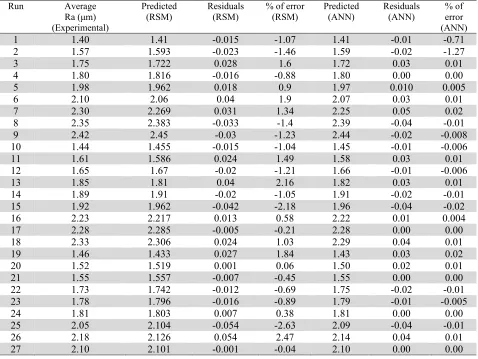
A comparison of experimental results with RSM and ANN results for surface roughness is presented in Table 6. It is observed that the maximum error between ANN model and experimental lies between -1.27 to 0.02 %, which is significantly less than the RSM model. However, this error can be further reduced if the number of test patterns will be increased. Hence, the developed ANN model can be effectively utilized for prediction of surface roughness in machining. The percentage of error for RSM model is found to be only -2.63 to 2.47. Hence, both the proposed RSM and ANN prediction model sufficiently predicts the surface roughness accurately. However, ANN prediction model is found to be better compared to RSM model.
Table 5
Input parameters selected for training
Input Parameters for Training Values
Error tolerance 0.001
Learning rate (ß) 0.2
Momentum parameter(α) 0.01
Noise factor (NF) 0.001
Number of epochs 10,00,000
Slope parameter (£) 0.6
Number of hidden layer neuron (H) 7
Number of input layer neuron (I) 3
Table 6
Comparisons of experimental vs. RSM and ANN for surface roughness
Run Average Ra (μm)
(Experimental)
Predicted
(RSM) Residuals (RSM) % of error (RSM) Predicted (ANN) Residuals (ANN) % of error (ANN)
1 1.40 1.41 -0.015 -1.07 1.41 -0.01 -0.71
2 1.57 1.593 -0.023 -1.46 1.59 -0.02 -1.27
3 1.75 1.722 0.028 1.6 1.72 0.03 0.01
4 1.80 1.816 -0.016 -0.88 1.80 0.00 0.00
5 1.98 1.962 0.018 0.9 1.97 0.010 0.005
6 2.10 2.06 0.04 1.9 2.07 0.03 0.01
7 2.30 2.269 0.031 1.34 2.25 0.05 0.02
8 2.35 2.383 -0.033 -1.4 2.39 -0.04 -0.01
9 2.42 2.45 -0.03 -1.23 2.44 -0.02 -0.008
10 1.44 1.455 -0.015 -1.04 1.45 -0.01 -0.006
11 1.61 1.586 0.024 1.49 1.58 0.03 0.01
12 1.65 1.67 -0.02 -1.21 1.66 -0.01 -0.006
13 1.85 1.81 0.04 2.16 1.82 0.03 0.01
14 1.89 1.91 -0.02 -1.05 1.91 -0.02 -0.01
15 1.92 1.962 -0.042 -2.18 1.96 -0.04 -0.02
16 2.23 2.217 0.013 0.58 2.22 0.01 0.004
17 2.28 2.285 -0.005 -0.21 2.28 0.00 0.00
18 2.33 2.306 0.024 1.03 2.29 0.04 0.01
19 1.46 1.433 0.027 1.84 1.43 0.03 0.02
20 1.52 1.519 0.001 0.06 1.50 0.02 0.01
21 1.55 1.557 -0.007 -0.45 1.55 0.00 0.00
22 1.73 1.742 -0.012 -0.69 1.75 -0.02 -0.01
23 1.78 1.796 -0.016 -0.89 1.79 -0.01 -0.005
24 1.81 1.803 0.007 0.38 1.81 0.00 0.00
25 2.05 2.104 -0.054 -2.63 2.09 -0.04 -0.01
26 2.18 2.126 0.054 2.47 2.14 0.04 0.01
27 2.10 2.101 -0.001 -0.04 2.10 0.00 0.00
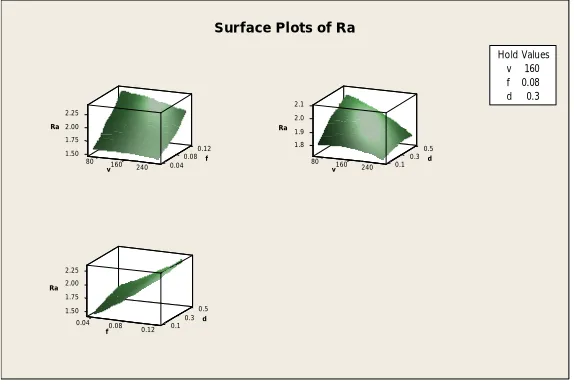
4.2. Optimization
The response surface plot can help in the prediction of the surface roughness at any zone of the experimental domain. The surfaceplot (Fig. 7) is as follows:
f*d: This plot indicates that how variables, feed and depth of cut are related to the surface roughness while the cutting speed is held at constant at middle level. The response is at its lowest at the lightest region of the surface plot (f = 0.04 mm/rev and d = 0.1 mm).
v*d: This plot indicates that how variables, cutting speed and depth of cut are related to the surface roughness while the feed is held at constant at middle level. The response is at its lowest at cutting speed of 260 m/min and depth of cut of 0.1 mm respectively.
v*f: This plot indicates that how variables, cutting speed and feed are related to the surface roughness while the depth of cut is held at constant at middle level. The response is at its lowest when cutting speed of 260 m/min and feed of 0.04 mm/rev respectively.
0.12
Ra
1.50 1.75
0.08 2.00
2.25
f
80 v160 240 0.04
0.5
Ra
1.8
0.3 1.9
2.0
d
2.1
80 v160 240 0.1
0.5
Ra
1.50 1.75
0.3 2.00
2.25
d
0.04 0.08 0.12 0.1
f
Hold Values
v 160
f 0.08
d 0.3
Surface Plots of Ra
Fig. 7. Surface plots of Ra
5. Conclusions
From the above investigations, it is concluded that the full factorial design gives a comparatively accurate prediction of surface roughness averages. From RSM model, regression is significant. Regression, linear, square and interaction terms are significant with P value less than 0.05. It is evident that, feed is the significant factor affecting surface roughness followed by cutting speed and depth of cut. It is observed that the maximum error between ANN model and experimental lies between -1.27 to 0.02 % which is significantly less than the RSM model. Hence, both the proposed RSM and ANN prediction model sufficiently predicts the surface roughness accurately. However, ANN prediction model is found to be better compared to RSM model (Sehgal & Meenu, 2013). From the 3D surface plots, the optimal parametric combination for lowest surface roughness is d1-f1-v3 i.e. d = 0.1 mm, f = 0.04 mm/rev and v = 260 m/min.
References
Bagci, E., & Işık, B. (2006). Investigation of surface roughness in turning unidirectional GFRP
composites by using RS methodology and ANN. The International Journal of Advanced
Manufacturing Technology, 31(1-2), 10-17.
Che Haron, C. H., Ghani, J. A., & Ibrahim, G. A. (2007). Surface integrity of AISI D2 when turned
using coated and uncoated carbide tools. International Journal of Precision Technology, 1(1),
106-114.
Dabnun, M. A., Hashmi, M. S. J., & El-Baradie, M. A. (2005). Surface roughness prediction model by
design of experiments for turning machinable glass–ceramic (Macor). Journal of Materials
Processing Technology, 164, 1289-1293.
Davim, J. P., Gaitonde, V. N., & Karnik, S. R. (2008). Investigations into the effect of cutting
conditions on surface roughness in turning of free machining steel by ANN models. Journal of
materials processing technology, 205(1), 16-23.
Feng, C. X. (2001). An experimental study of the impact of turning parameters on surface roughness. In Proceedings of the Industrial Engineering Research Conference (No. 2036, pp. 1-7).
Gillibrand, D., Sarwar, M., & Pierce, C. T. (1996). The economic benefit of finish turning with coated carbide. Surface and Coatings Technology, 86, 809-813.
Gökkaya, H., & Nalbant, M. (2007a). The effects of cutting tool coating on the surface roughness of
AISI 1015 steel depending on cutting parameters. Turkish Journal of Engineering and
Gökkaya, H., & Nalbant, M. (2007b). The effects of cutting tool geometry and processing parameters on the surface roughness of AISI 1030 steel. Materials & design, 28(2), 717-721.
Horng, J. T., Liu, N. M., & Chiang, K. T. (2008). Investigating the machinability evaluation of
Hadfield steel in the hard turning with Al2O3TiC mixed ceramic tool based on the response surface
methodology. Journal of materials processing technology, 208(1), 532-541.
Karayel, D. (2009). Prediction and control of surface roughness in CNC lathe using artificial neural
network. Journal of materials processing technology,209(7), 3125-3137.
Lalwani, D. I., Mehta, N. K., & Jain, P. K. (2008). Experimental investigations of cutting parameters
influence on cutting forces and surface roughness in finish hard turning of MDN250 steel. Journal
of materials processing technology, 206(1), 167-179.
Montgomery, D.C. (1997). Design and Analysis of Experiments. 4th ed. Wiley, New York.
Nalbant, M., Gökkaya, H., & Sur, G. (2007). Application of Taguchi method in the optimization of cutting parameters for surface roughness in turning.Materials & design, 28(4), 1379-1385.
Nalbant, M., Gokkaya, H., & Toktas, I. (2007). Comparison of regression and artificial neural network
models for surface roughness prediction with the cutting parameters in CNC turning. Modelling and
Simulation in Engineering, 2007(2), 3.
Noordin, M. Y., Venkatesh, V. C., Chan, C. L., & Abdullah, A. (2001). Performance evaluation of
cemented carbide tools in turning AISI 1010 steel. Journal of Materials Processing
Technology, 116(1), 16-21.
Noordin, M. Y., Venkatesh, V. C., Sharif, S., Elting, S., & Abdullah, A. (2004). Application of response surface methodology in describing the performance of coated carbide tools when turning AISI 1045 steel. Journal of Materials Processing Technology, 145(1), 46-58.
Özel, T., Karpat, Y., Figueira, L., & Davim, J. P. (2007). Modelling of surface finish and tool flank
wear in turning of AISI D2 steel with ceramic wiper inserts. Journal of materials processing
technology, 189(1), 192-198.
Özel, T., & Karpat, Y. (2005). Predictive modeling of surface roughness and tool wear in hard turning
using regression and neural networks. International Journal of Machine Tools and
Manufacture, 45(4), 467-479.
Park, Y. W. (2002). Tool material dependence of hard turning on the surface quality. International
Journal of Precision Engineering and Manufacturing, 3(1), 76-82.
Pal, S. K., & Chakraborty, D. (2005). Surface roughness prediction in turning using artificial neural network. Neural Computing & Applications, 14(4), 319-324.
Quiza, R., Figueira, L., & Davim, J. P. (2008). Comparing statistical models and artificial neural
networks on predicting the tool wear in hard machining D2 AISI steel. The International Journal of
Advanced Manufacturing Technology,37(7-8), 641-648.
Risbood, K. A., Dixit, U. S., & Sahasrabudhe, A. D. (2003). Prediction of surface roughness and
dimensional deviation by measuring cutting forces and vibrations in turning process. Journal of
Materials Processing Technology,132(1), 203-214.
Sahin, Y., & Motorcu, A. R. (2008). Surface roughness model in machining hardened steel with cubic
boron nitride cutting tool. International Journal of Refractory Metals and Hard Materials, 26(2),
84-90.
Sahoo, A. K., & Sahoo, B. (2011). Surface roughness model and parametric optimization in finish turning using coated carbide insert: Response surface methodology and Taguchi approach. International journal of industrial engineering computations, 2(4), 819-830.
Sahoo, A., Orra, K., & Routra, B. (2013). Application of response surface methodology on investigating flank wear in machining hardened steel using PVD TiN coated mixed ceramic insert. International Journal of Industrial Engineering Computations, 4(4), 469-478.
Sahoo, A., & Mohanty, T. (2013). Optimization of multiple performance characteristics in turning
using Taguchi’s quality loss function: An experimental investigation. International Journal of
Sahoo, A. (2014). Application of Taguchi and regression analysis on surface roughness in machining
hardened AISI D2 steel. International Journal of Industrial Engineering Computations, 5(2),
295-304.
Sehgal, A.K., (2013) Application of artificial neural network and response surface methodology for achieving desired surface roughness in end milling process of ductile iron grade 80-55-06,
International Journal of Computational Engineering & Management, 16 (3), 2230-7893.
Suresh, P. V. S., Venkateswara Rao, P., & Deshmukh, S. G. (2002). A genetic algorithmic approach for
optimization of surface roughness prediction model. International Journal of Machine Tools and
Manufacture, 42(6), 675-680.
Tsao, C. C., & Hocheng, H. (2008). Evaluation of thrust force and surface roughness in drilling
composite material using Taguchi analysis and neural network. Journal of materials processing
technology, 203(1), 342-348.
Tıgıt, R., Findik, F., & Çelık, E. (2009). Performance of multilayer coated carbide tools when turning cast iron. Turkish Journal of Engineering & Environmental Sciences, 33(3), 147 – 157.
Sharma, V. S., Dhiman, S., Sehgal, R., & Sharma, S. K. (2008). Estimation of cutting forces and
surface roughness for hard turning using neural networks. Journal of Intelligent