
1
A STUDY OF THE WATER CHARACTERISTICS AND PORE SIZE
DISTRIBUTION OF A TROPICAL ALFISOL
*, &
C. J. Ejieji,
+M. R. Baiyeri and
++A. A. Adebayo.
*
Department of Agricultural and Biosystems Engineering, University of Ilorin, Ilorin, Nigeria. +
Department of Agricultural Engineering, Kwara State Polytechnic Ilorin, Nigeria. ++
Department of Agricultural Engineering, Federal Polytechnic Auchi, Nigeria.
&
Coresponding author: email: [email protected] ; [email protected]
ABSTRACT
The water characteristic of the an alfisol predominantly sandy loam in texture was measured with undisturbed core samples in a pressure plate apparatus at pressures of 5, 10, 33, 60, 100, 1000, and 1500 kPa. The core samples were obtained at 20 cm depth intervals to 100 cm soil depth. The pore size distribution and the matric pressure head (hB) defining the boundary between the structural and matrix domains were determined using a derivative curve technique. The pore size distribution varied from dominantly unimodal to essentially bimodal distribution as the soil clay content increased with soil depth. The values of hB ranged from 120 to 250 cm. However, at 0.05 level of significance, there was no difference between the respective structural and matrix domain porosities determined using the derivative curve technique and the corresponding ones by an empirical method which assumed and an arbitrary hB–value of 100 cm. Structural domain porosity comprised more than half of the total porosity in the upper soil depths indicating a preponderance of macropores in that region. The measured water characteristic fitted well to both the closed-form bimodal model of Seki (2007) and the unimodal one of Kosugi (1996). However, the model of Seki had higher coefficients of determination and showed better fit over the entire range of measured data.
Keywords: Water characteristics, pores size distribution, structural and matrix domains.
INTRODUCTION
Soil water characteristic or retention curve describes the relationship between soil water content (θ) and soil water matric suction or the matric pressure head (h) over the range of θ from the very dry condition when the soil pores are virtually depleted of water to saturation when all the pore spaces are completely filled with water. Soil water characteristic is influenced by soil texture and structure (Hillel, 1971). Because it largely determines the hydrological behaviour of the soil, knowledge of soil water characteristic is required in determining the proportion of soil water available to crops, irrigation scheduling and soil water conservation. Modelling of transport processes in the soil involving movement of water, suspended particles like bacteria and, of soluble contaminants and plant nutrients also requires data on the h-θ relationship. In a non-swelling soil, the water characteristic curve once established, allows the determination of the pore size distribution. This is possible because the pressure difference across the air-water interface of the capillary water in the pore is inversely proportional to the equivalent radius of the interface (Bear, 1972). The θ-h
relationship can therefore be converted into an equivalent pore size distribution; the water content at any given suction (i.e. at any given matric pressure head) being equal to the porosity contributed by the
2
relies on three empirical parameters for fitting to observed data. The model of Kosugi (1996) which assumed a log-normal pore size distribution does not have such limitation. A general form of the model for soils with multimodal distribution of pore sizes was stated by Kutilek and Jendele (2008) while that for bimodal soils was suggested by Seki, (2007). Knowledge of the soil pore size distribution also facilitates the determination of the proportions of total porosity (i.e. proportion of pore spaces per unit soil volume) which are in the matrix and structural domains. The matrix domain is defined as the pore space within soil aggregates or within blocks of soil if aggregates are not present (Elhers et al., 1995; Kutilek, 2004). The domain is little affected by soil management. Structural domain on the other hand, is the pore space between the micro-aggregates and also between incipient aggregates (Kutilek, 2004). The morphology depends upon soil genesis and soil management factors such as tillage, compaction and cropping (Dexter, 2004). The determination of the proportions of the total porosity in the respective domains is necessary in the solution of problems of preferential flows in soils and for improved planning and implementation of soil water conservation measures. The direct determination is complex and expensive. It involves image analysis of thin soil sections (e.g. Pagliai et al., 2004). A simple, indirect, empirical and frequently adopted approach is to arbitrarily assume the radius of 15 μm corresponding to 10 kPa suction (i.e. 0.1 bar or 100 cm pressure head) as the boundary between the matrix and structural domains (Marshall, 1959; Mbagwu et al., 1983). This may however not apply to all soils (Luxmoore, 1981). A derivative curve technique was therefore suggested by Kutilek and Jendele (2008) as a physically-based indirect approach. In this method, the derivative of the relative saturation (S) with respect to ln h (i.e. dS /d(ln h)) is plotted against h. The h-value defining the boundary between the matrix and structural domains is determined at the minimum between two peaks of the derivative curve. For soils of the moist savannah zone of Nigeria, there is little reported investigation of pore size distribution related to the modelling of the soil water characteristics. Such information is necessary for the solution of local soil water management problems using recent improved simulation models of soil water dynamics. The objectives of this paper therefore are to (a) study the pore size distribution of a soil dominant soil type located in the moist savannah zone of Nigeria, (b) determine, using the pore size distribution, the proportions of the matrix and structural components of the total porosity and; (c) evaluate for the soil the performances of the unimodal θ(h) model of Kosugi (1996) and the bimodal version of the model by Seki (2007).
MATERIALS AND METHOD
The study was conducted using soil samples from a proposed tillage and irrigation water management
field laboratory of the Department of Agricultural and Biosystems Engineering, University of Ilorin. The site consisted of an 18 ha plot approximately 600 m long and 300 m wide. The land slopes eastward along its length by about 5% towards a seasonal stream. The soil belongs to the order of alfisols -Tropeptic Haplustalf, (Soil Survey Staff, 1975). Soil sampling was also carried out in two profile pits. One of the pits (Pit A) was located within the uppermost one-third of the field while the other (Pit B) was within the lowest one-third of the field. Bulk and core samples were obtained at 20 cm depth intervals to 100 cm depth. The core samplers were 5 cm in diameter, 5 cm high and 0.1 cm thick. Two core samples were obtained from each depth interval of each pit. The bulk samples were used for determining organic carbon content by chromic acid wet oxidation method (Walkey and Black, 1934). The core samples after saturation and weighing in the laboratory were used to determine soil water retention with a pressure plate apparatus at pressures of 5, 10, 33, 60, 100, 400, 1000, and 1500 kPa. The pressures correspond to matric pressure heads (h) of 50, 100, 330, 600, 1000, 4000, 10000 and 15000 cm respectively. After the water retention tests, the bulk density each core sample was determined by dividing the oven-dry weight of the soil by the volume of the core sampler while the textural composition was determined by the hydrometer method. Gravel content of the core samples was determined from the weight of soil retained on a 2 mm sieve. All measured water contents were expressed as volumetric fractions by multiplying the gravimetric water content by the relative bulk density. Total porosity was estimated from saturated water content of the core samples. In order to determine the pore size distribution and the boundary between the structural and matrix domains, the relative saturation (S) at each h-value was obtained as the measured water content at the h -value divided by the saturated water content (θs). The
obtained S(h) data were transformed to S(ln h) data. The transformed data were interpolated to obtain values of S of at respective ln h values for h increased in steps of 10cm from 10 to 15000 cm. A combination of linear and cubic spline interpolation was employed. The derivative curve was obtained from the interpolated S(ln h) data by numerical differentiation. When the derivative curve was plotted, the h-value (hB) between the first two
adjacent peaks was considered to delineate the boundary between structural and matrix domains. The closed-form unimodal θ(h) model of Kosugi (1996), the performance of which was evaluated, is in the form
Se =
2
)
/
ln(
2 1
m
h
h
Q
(1)where Q(.) is the complementary error function, hm
3
mean pore radius, δ the standard deviation of the log-transformed pore radius and is Se effective
saturation defined as
Se = r s r
;
r
(
s
r)
S
e (2)where θr is the residual water content and all other
terms are as previously defined.
The bimodal form of the Kosugi model could be stated as follows (Seki,
Se =
2
)
/
ln(
)
1
(
2
)
/
ln(
2 2 1 1 2 1
mm
h
h
Q
w
h
h
Q
w
(3)where w is the relative contribution of the pores in the structural domain and the subscripts 1 and 2 refer to the pores in the structural and matrix domains respectively.
The measured water characteristic data of each core sample were fitted to Equations 1 and 3 to determine the parameters and goodness-of-fit of the closed-form models. The fitting was carried out on-line (http://seki.webmasters.gr.jp/swrc/swrc.cgi) using the “SWRC Fit” software of Seki (2007). The performance of the models was assessed using the coefficients of determination.
RESULTS AND DISCUSSION
The average properties of the experimental soil from the two pits are presented in Table 1. Based on the textural triangle of Soil Survey Staff (1975), the top 40 cm of Pit A could be classified as loamy sand and the remaining depth intervals including of all of Pit B as sandy loam. The organic matter content was low but was highest for the top 20 cm. The silt, clay and gravel contents along with bulk density increased with depth. For corresponding depth intervals, silt and clay contents as well as silt/clay ratio were higher in Pit B than in Pit A. This could mainly be due to elluviation since Pit B was lower down the toposequence. Gravelly concretionary horizon, a characteristic feature of afisols of western Nigeria (Bonsu and Lal, 1982), was pronounced from about 90 cm depth. The horizon has been shown to be of low hydraulic conductivity and to promote, in wet conditions, subsurface lateral flow of perched water down the slope of the field laboratory (Ejieji and Ajayi, 2001).
Figure 1 shows typical derivative curves obtained for the various depth intervals of the two Pits. Generally the derivative curves exhibited multiple peaks. However, core samples from the more sandy top 40 cm of the two Pits showed one dominant peak. Core samples from the lower layers particularly those having the highest clay contents showed two prominent peaks. This implies that the pore size distribution exhibited multimodality but the distribution varied from dominantly unimodal to mainly bimodal with increasing clay content. This finding is consistent with experimental results of related studies (Bird et al., 2005; Pagliai and Vignozzi, 2002). In their application of the derivative curve technique, Kutilek and Kendele, (2008) also found sands to be weakly bimodal and loams to be distinctly bimodal.
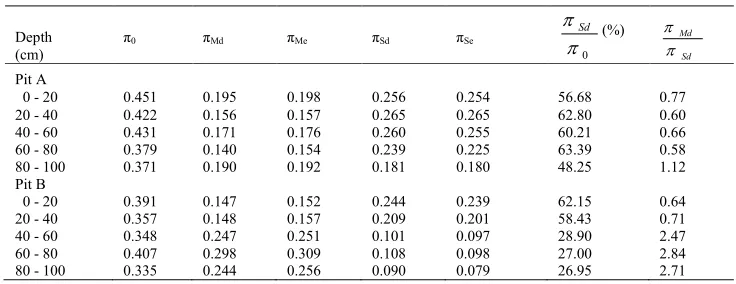
The total porosity and, structural and matrix domain porosities determined for the various depths of the two pits are presented in Table 2. Total porosity decreased with depth (Table 2) due to increase in bulk density (Table 1). The trend is similar to what had been observed in two Nigerian alfisols (Mbagwu
et al., 1983). The values of total porosity were within the range expected for coarse-textured soils having little organic matter (Boersma et al. 1972). For two core samples from the 60 – 100 cm depth of Pit B average value of hB was 250 cm. For the other core
samples from the two pits, hB ranged from 120 to 140
cm and averaged 122 cm. With the logarithmic distribution of h, most of the hB-values from the
derivative curves could, on the logarithmic scale, be considered to be close to the arbitrary value of 100 cm usually adopted in the empirical method of hB
4
matter and crop residues could therefore be beneficial soil water conservation strategy for the soil.
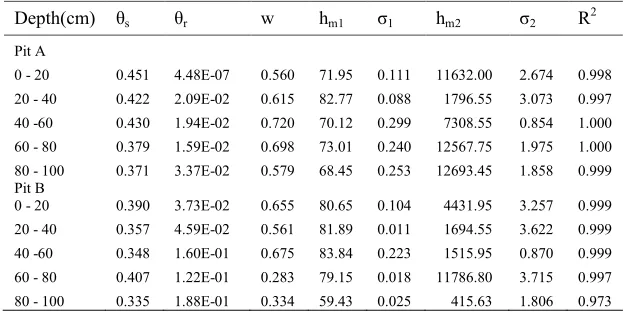
Typical plots of the measured and interpolated soil water characteristics are shown in Figure 2 along with the predictions by the Kosugi (1996) and Seki (2007) models. The experimental data were successfully interpolated as all the measured data lay on the plot of the interpolated data. For depth intervals in the top 80 cm (Figure 2), the low water holding capacity is evident in the steep decline in water content as soon as for h exceeded 50 cm. The parameters of the models are presented in Tables 3 and 4 respectively. Generally the bimodal model of Seki (2007) better fitted the experimental data throughout the range of data. Except in the 80 – 100 cm depth where the performance of both models were similar, the Kosugi model overpredicted water
content by about 0.033 cm3 cm-3 in the interval 4000 cm
h
15000 cm On the average, it alsounderpredicted water content by 0.024 cm3 cm-3 in the interval 100 cm
h
4000 cm. Practically,the difference between the predicted and measured water contents could be considered acceptable considering the the variability of the soil water content obtainable in-situ (Ejieji and Ajayi, 2001). Generally, the coefficients of determination for the two models were high. The better performance of the Seki (2007) model is reflected in its higher coefficients of determination for the respective depth intervals of the two pits (Table 2). The same relative performances were replicated (result not presented) when the unimodal model of Van Genuchten (1980) and its bimodal version by Durner (1994) were fitted to the measured θ(h) data. The bimodal model of Seki (2007) is therefore to be preferred for the soil especially in solute transport simulations where Zurmuhl and Durner (1996) have demonstrated the superiority of a bimodal model over a unimodal model. Development of pedotranfers functions using bimodal θ(h) models may however not be parsimonious due to the increased number of bimodal model parameters.
Table 1. Average properties of the experimental soil at the various depths of the two sampling pits. Depth
(cm)
Sand (%)
Silt (%)
Clay (%)
Gravel kg (100 kg)-1
Organic matter (%)
Bulk density (Mg m-3
)
Silt/Clay ratio Pit A
0 - 20 81.34 8.68 9.98 13.05 0.80 1.41 0.87 20 - 40 83.66 5.18 11.16 17.30 0.23 1.49 0.46 40 - 60 81.02 6.46 12.52 14.75 0.11 1.53 0.52 60 - 80 78.94 7.60 13.46 30.75 0.14 1.61 0.56 80 - 100 76.22 5.68 18.10 44.85 0.06 1.68 0.31 Pit B
0 - 20 77.12 9.25 13.63 21.10 0.80 1.47 0.68 20 - 40 81.20 7.38 11.42 14.35 0.30 1.49 0.65 40 - 60 65.62 18.02 16.36 33.30 0.57 1.54 1.10 60 - 80 56.72 24.10 19.18 37.10 0.56 1.37 1.26 80 - 100 64.04 19.37 16.59 34.85 0.63 1.63 1.17
Table 2 Average total prosity, structural and matrix domain porosities and; ratios of structural to total and of textural to structural domain porosity at the various depths of the two pits.
Depth (cm)
π0 πMd πMe πSd πSe
0
Sd
(%)
Sd Md
Pit A
0 - 20 0.451 0.195 0.198 0.256 0.254 56.68 0.77 20 - 40 0.422 0.156 0.157 0.265 0.265 62.80 0.60 40 - 60 0.431 0.171 0.176 0.260 0.255 60.21 0.66 60 - 80 0.379 0.140 0.154 0.239 0.225 63.39 0.58 80 - 100 0.371 0.190 0.192 0.181 0.180 48.25 1.12 Pit B
0 - 20 0.391 0.147 0.152 0.244 0.239 62.15 0.64 20 - 40 0.357 0.148 0.157 0.209 0.201 58.43 0.71 40 - 60 0.348 0.247 0.251 0.101 0.097 28.90 2.47 60 - 80 0.407 0.298 0.309 0.108 0.098 27.00 2.84 80 - 100 0.335 0.244 0.256 0.090 0.079 26.95 2.71
π0 = total porosity; πMd = matrix domain porosity by the derivative curve technique
πMe = matrix domain porosity by empirical method
πSd = structural domain porosity from the derivative curve technique (that is, πSd = π0 – πMd )
5
Table 3. Average values of the Kosugi model parameters and the coefficients of determination for the various depths of the two pits.
Depth(cm) θs θr hm σ R 2
Pit A
0 - 20 0.452 0.136 82.40 0.249 0.955 20 - 40 0.422 0.090 79.18 0.302 0.969 40 - 60 0.434 0.090 81.51 0.845 0.937 60 - 80 0.379 0.094 77.77 0.343 0.961 80 - 100 0.374 0.122 112.98 1.222 0.929 Pit B
0 - 20 0.391 0.105 74.23 0.327 0.977 20 - 40 0.357 0.111 77.62 0.306 0.972 40 - 60 0.354 0.165 164.53 1.547 0.940 60 - 80 0.410 0.218 198.02 2.101 0.944 80 - 100 0.339 0.193 149.99 1.501 0.947
θs = saturated water content (cm 3
cm-3); θr = residual water content (cm 3
cm-3)
hm = matric pressure head related to the geometric mean pore radius (cm)
δ = standard deviation of the log-transformed pore radius
Table 4. Average values of the Seki model parameters and the coefficients of determination for the various depths of the two pits.
Depth(cm) θs θr w hm1 σ1 hm2 σ2 R2
Pit A
0 - 20 0.451 4.48E-07 0.560 71.95 0.111 11632.00 2.674 0.998 20 - 40 0.422 2.09E-02 0.615 82.77 0.088 1796.55 3.073 0.997 40 -60 0.430 1.94E-02 0.720 70.12 0.299 7308.55 0.854 1.000 60 - 80 0.379 1.59E-02 0.698 73.01 0.240 12567.75 1.975 1.000 80 - 100 0.371 3.37E-02 0.579 68.45 0.253 12693.45 1.858 0.999 Pit B
0 - 20 0.390 3.73E-02 0.655 80.65 0.104 4431.95 3.257 0.999 20 - 40 0.357 4.59E-02 0.561 81.89 0.011 1694.55 3.622 0.999 40 -60 0.348 1.60E-01 0.675 83.84 0.223 1515.95 0.870 0.999 60 - 80 0.407 1.22E-01 0.283 79.15 0.018 11786.80 3.715 0.997 80 - 100 0.335 1.88E-01 0.334 59.43 0.025 415.63 1.806 0.973
w = relative contribution of the pores in the structural domain while the subscripts 1 while 2 refer to the pores in the structural and matrix domains respectively and other terms as defined in Table 4.
CONCLUSIONS AND RECOMMENDATIONS
Multimodal pore size distribution was observed in the soil. As the clay content increased from the top 0 – 20 cm to the lowest 80 – 100 cm depth, the pore size distribution varied from dominantly unimodal to essentially bimodal distribution. In the upper depth intervals, more than half of the total porosity was in the structural domain. Since macropores dominate the pore spaces in the structural domain, preferential paths of flow which usually limit mixing and transfer of flow between such pores and those in the matrix domain would be prevalent in the upper soil layers. This feature and the textural properties are responsible for the low water holding capacity observable from Figure 2 and the high infiltration rate reported in an earlier study. Under intensive agricultural use, fertilizers, pesticides and herbicides also could easily leach from the root zone constituting pollution hazard to the ground
6
Figure 1. Typical plots of the relative saturation (S) and the derivative [dS/d (ln h) ] as functions of the matric pressure head (h)
Figure 2. Some comparisons of the measured and interpolated soil water characteristics with the predictions of the Kosugi (1996) and Seki (2007) models.
0 - 20 cm Pit B
0 0.1 0.2 0.3 0.4 0.5
10 100 1000 10000 100000
Pr es s ure he ad (cm )
W
at
er
c
on
te
n
t
(c
m
^
3/
cm
^
3)
Interpolated Measured Kosugi Seki
20 - 40cm Pit A
0 0.1 0.2 0.3 0.4 0.5
10 100 1000 10000 100000
Pr es s ure he ad (cm )
W
at
er
c
o
nt
ent
(c
m
^
3/
cm^
3)
Interpolated Measured Kosugi Seki
60 - 80cm Pit A
0 0.1 0.2 0.3 0.4 0.5
10 100 1000 10000 100000
Pre s s ur e he ad (cm )
W
at
er
c
o
nt
ent
(c
m
^
3/
cm^
3)
Interpolated Measured Kosugi Seki
80 - 100cm Pit B
0 0.1 0.2 0.3 0.4 0.5
10 100 1000 10000 100000
Pressure head (cm)
W
at
er
cont
ent
(cm^
3/
cm
^
3)
7
Elsevier Publication Company Inc, New York, NY.
Bird N.R.A., Preston A.R., Randall E.W., WhalleyW.R., Whitmore A.P. (2005).Measurement of the size distribution of water filled pores at different matric potentials by stray field nuclear magnetic resonance. European Journal of Soil Science, 56: 135– 143.
Boersma, L., Cary, J. W., Evans, D. D., Ferguson, A. H., Gardner, W. H., Hanks, R. J., Jackson, R. D., Kemper, W. D., Miller, D. E., Nielsen, D. R. and Uehara, G. (1972). Soil water. pp 5 – 20, American Society of Agronomy and Soil Science Society of America.
Bonsu, M. and Lal, R. (1982). Hydrological properties of some alfisols of western Nigeria: A comparison of field and laboratory methods. Nigerian Journal of Soil Science, 3: 101 – 109.
Dexter, A. (2004). Soil physical quality Part I. Theory, effects of soil texture, density, and organic matter, and effects on root growth. Geoderma120: 201-214.
Donahue, R. L., Miller, R. W. and Shickluna, J. C. (1990). Soils: An introduction to soils and plant growth, pp 148 - 150. 5th Edition, Prentic-Hall Ltd, New Delhi.
Durner, W. (1994). Hydraulic conductivity estimation for soils with heterogeneous pore structure. Water Resources Research, 30(2): 211-223.
Ejieji, C. J. and Ajayi, A. S. (2001). Relation of some soil water transmission characteristics to some soil physical properties in a tropical alfisol. Journal of Agricultural Research and Development, 1: 9 – 15.
Elhers, W., Wendroth, O. and De Mol, F. (1995). Characterizing pore organisation by soil physical parameters. Advances in Soil Science. 257-275. Hillel, D. (1971). Soil and Water: Physical principles
and processes. pp 61 – 65. Academic Press Inc. New York.
Jury, W., Gardner, W. and Gardner, W. (1991). Soil physics. John Wiley & Sons, New York. Kosugi, K. (1996). Lognormal distribution model for
unsaturated soil hydraulic properties. Water Resources Research, 32(9): 2697 – 2703. Kutilek, M. (2004). Soil hydraulic properties as
related to soil structure. Soil and Tillage. Research.,79, 175-184.
Kutilek, M. and Jendele, L. (2008). The structural porosity in soil hydraulic functions – A review . Soil and Water Research3: S7-S20.
Lal, R., Maurya, P. R. and Osei-Yeboah, S. (1978). Effects of notillage and ploughing on efficiency of water use in maize and cowpea. Experimental Agriculture, 14: 113 – 120.
hydraulic database. US Environmental Protection Agency, Report EPA/600/R-96/095. Leij, F. W.. Rusell, W. B. and Lesch, S. M. (1997).
Closed-form expressions for water retention and conductivity data. Ground water, 35(5): 848 - 858
Luxmoore, R. (1981). Micro-, Meso- and macroporosity of soil. Soil Science Society of America Journal. 45: 241-285.
Mbagwu, J. S. C., Lal, R. and Scott, T. W. (1983). Physical properties of three soils in Southern Nigeria.. Soil Science, 136(1): 48 – 55.
Marshall, T. (1959). Relations between water and soil. Farnham Royal, Commonwealth Bureau of Soils Harpeden. Technical Communication, 50. Mualem, Y. (1976). A new model for predicting the
hydraulic conductivity of unsaturated porous media. Water Resources Research, 12: 513 - 522. Pagliai, M., Vignozzi, N. (2002). Image analysis and microscopic techniques to characterize soil pore system. In: Blahovec, J. and Kutilek, M. (eds.). Physical methods in Agriculture, Kluwer Academic Publishers, London. 13 – 38.
Pagliai, M., Vignozzi, N. and Pellegrini, S. (2004). Soil structure and the effect of management practices. Soil Tillage Research, 79: 131 -134. Seki, K. (2007): SWRC Fit - A nonlinear fitting
program with a water retention curve for soils having unimodal and bimodal pore structure. Hydrological and Earth System Sciences, 4: 407-437.
Skopp, J. (1981). Comment on ‘Micro- meso- and macroporosity of soil’. Soil Science Society of America Journal, 45:1246.
Soil Survey Staff (1975). Soil Taxonomy: a basic system of soil classification for making and interpreting soil surveys. Agricultural handbook 436. USDA Soil Conservation Services, Washington DC.
Thomas, G.W. and Phillips, R.E. (1979). Consequences of water movement in macropores. Journal of Environmental Quality, 8: 149-15.
Van Genuchten, M. Th. (1980). A closed-form equation for predicting the hydraulic conductivity of unsaturated soils. Soil Science Society of America Journal 62: 874 - 898. Walkey, A., and Black, I. A. (1934). An
examination of the Degtjareff method for determining soil organic matters and a proposed modification of the chromic acid titration method. Soil Sci. 37: 29 – 38.
Zurmuhl, T. and Durner, W. (1996). Modelling transient water and solute transport in a biporous soil. Water Resources Research, 32: 818 – 829. Zurmuhl, T. and Durner, W. (1998). Determination
![Figure 1. Typical plots of the relative saturation ( S) and the derivative [dS/ d (ln h) ] as functions of the matric pressure head (h)](https://thumb-us.123doks.com/thumbv2/123dok_us/9960679.1984219/6.612.200.414.419.674/figure-typical-relative-saturation-derivative-functions-matric-pressure.webp)
