1. Introduction
In deregulated environment, the process of the power grid such as generation, transmission, distribution and control are separated entities and market contributors in-terdepend themselves in order to sell or buy the electricity in a way to maximize their turnover. To meet the preferred transacting, power flow in the transmission system in-vades some of the physical restrictions of the transmission networks. Accordingly, transmission system is congested. Congestion may occur due to absent of management be-tween generation and transmission utilities or because of unexpected probabilities likes power producer’s outage, unexpected increase of load demand, or failure of equip-ment. The unattractive result of the congestion causes in-consistency of the system safety and increment of the power cost. Congestion can be reduced by rescheduling active power of generators, load limitation and operation of phase shifters or FACTS devices. A proper controlling
action is needed effectively to mitigate the line overloads to the safety limits. There are many publications available that qualify methods for mitigating congestion in restruc-tured power system. In [1], Ashwani Kumar et al have done a bibliographical review on congestion management systems in a competitive electricity market. The authors showed that one of the most skillful and understandable technique of congestion handling is redistributing the power outputs of generators in the system. In [2], two ef-fective methods are suggested for solving congestion han-dling problem in a day ahead market by generator rescheduling. In [3], a novel ant lion optimizer has been appointed to solve the problem of congestion by redistri-bution of active power of generators. In [4], a new ap-proach is suggested for palliation congestion relieving cost by feeding needed reactive power of system in addi-tion to re-dispatching active power of generators and load shedding. A new locational marginal pricing (LMP) cal-culation method is suggested in [5] to deviate the main hitches with DC power flow based on LMP calculations. LMP is usually crumbled into three components, marginal cost of energy, loss and congestion which are proposed in [6]. Particle swarm optimization (PSO) is employed to solve the OPF problem in congestion management using re-dispatch of transactions in a pool market [7]. The idea of game theory in the restructured electricity market has
Locating of Series FACTS Devices for Multi-Objective
Congestion Management Using Components of Nodal
Prices
A. R. Moradi*, Y. Alinejad-Beromi*(C.A.)and K. Kiani*
Abstract:Congestion and overloading for lines are the main problems in the exploitation of power grids. The consequences of these problems in deregulated systems can be mentioned as sudden jumps in prices in some parts of the power system, lead to an increase in market power and reduction of competition in it. FACTS devices are efficient, powerful and economical tools in controlling power flows through transmission lines that play a fundamental role in congestion management. However, after removing congestion, power systems due to targeting security restrictions may be managed with a lower voltage or transient stability rather than before removing. Thus, power system stability should be considered within the construction of congestion management. In this paper, a multi-objective structure is presented for congestion management that simultaneously optimizes goals such as total operating cost, voltage and transient security. In order to achieve the desired goals, locating and sizing of series FACTS devices are done with using components of nodal prices and the newly developed grey wolf optimizer (GWO) algorithm, respectively. In order to eval-uate reliability of mentioned approaches, a simulation is done on the 39-bus New England network.
Keywords:Congestion management, electricity markets, FACTS devices, multi-objective optimization, power system stability margin
Iranian Journal of Electrical & Electronic Engineering, 2017. Paper received 24 November 2016 and accepted 8 April 2017. * The authors are with the Faculty of Electrical and Computer Engi-neering, Semnan University, Semnan, Iran.
E-mails: [email protected], [email protected] and [email protected].
Corresponding Author: Y. Alinejad-Beromi.
established communicatively to display how symmetry point of electricity market departs under the strategic gaming in [8]. The pricing of marginal transmission losses in the LMP approach in the ISO New England standard market design are presented by Litvinov et al [9]. Differ-ent calculations models and stable properties on LMP based on different market designs are propounded in [10]. A multilayer feed forward neural network is proposed for removing line overloads in real time for restructured power system [11]. In [12], the authors showed that the congestion release could be attained by re-dispatching method considering the collective operation of hydro and thermal generating companies in a deregulated environ-ment. To solve the multi-objective optimization problem of the congestion management, a new effective multi-ob-jective mathematical programming solution approach based on normalized normal constraint method is pre-sented in [13]. Flexible AC Transmission System (FACTS) plays a significant role in increasing load ability and removing congestion in the network. FACTS devices can improve the efficiency extremely by controlling the power flows in the network without generation re-dis-patching or structure changes [14-15]. Different ap-proaches have been proposed for optimal location of FACTS devices including sensitivity analysis [6, 16], con-gestion handling by unified power flow controller (UPFC) [17] and interline power flow controller (IPFC) [18]. The authors in [19] review a fuzzy interactive multi-objective approach for the optimal location of UPFC to enhance power system operation. To manage transmission line congestion in hybrid electricity markets, the capability of Sen Transformer has been used in [20]. A PSO-based al-gorithm is used to find the optimal position and the pa-rameters setting of UPFC to increase load ability [21]. In [22], it reviews a fuzzy-genetic algorithm (GA) approach for the optimal placement of FACTS devices in a power system for congestion management. A GA-based algo-rithm is used in [23] to find the optimal locating and the parameters setting of Thyristor Controlled Series Com-pensator (TCSC) to increase loadability. In [24], the TCSC are located for congestion management in the power system by considering the non-smooth fuel cost function and penalty cost of emission. In this reference, bacterial foraging and Nelder-Mead algorithm is applied to solve TCSC placement problem for congestion man-agement.
None of the mentioned references has considered power system security concerns. Thus, power system sta-bility should be considered within the construction of con-gestion management. On the other hand, in order to improve power system security, significant references are presented to apply FACTS devices. In [25], trajectory sen-sitivity approach for optimal locating of series FACTS de-vices is presented to enhance transient stability. To maintain the voltage stability in the power transmission
system, a novel technique is presented in [26], to optimize the FACTS devices. In this reference, the PSO and the adaptive gravitational search algorithm (GSA) technique are presented for improving the voltage stability of the power transmission systems.
In this paper, a multi-objective structure is presented for congestion management that simultaneously optimizes goals such as total operating cost, voltage and transient security. Voltage Stability Margin (VSM) [27] and Cor-rected Transient Energy Margin (CTEM) [28] indices are applied in this paper for measuring of voltage and tran-sient security margins, respectively. In order to achieve the desired goals, locating and sizing of series FACTS de-vices (TCSC is considered as a series FACTS device) are done via using the components of nodal prices and the newly developed grey wolf optimizer (GWO) algorithm, respectively.
Most of the references use methods based on the iter-ation for optimal locating of FACTS devices. These meth-ods may not achieve optimal solution and they consume lots of time. Therefore, for solving these challenges, this paper tries to indicate a new methodology to locate the best position of FACTS devices for congestion manage-ment in the deregulated electricity markets. Also, this method indicates the accuracy explanation of each nodal price, by categorizing each nodal price into variety of el-ements corresponding to the important factors, as gener-ations, transmission density, voltage constraints and other limitations. The decomposition is unique and components in each nodal price are identical to increase the values from the economic criteria by utilizing of derivations that are based on the marginal conditions. This full informa-tion for nodal prices can be used not only to improve the efficient usage of power grid and congestion management, but also this information tries to design a suitable pricing structure of power systems, to prepare economic signals for generation or transmission investment. The proposed method is applicable to any type of series FACTS devices. On the other hand, a new algorithm based on the swarm intelligence named as GWO for sizing of TCSC has been used. This algorithm is inspired by the social be-havior of grey wolves in nature. It can be expressed that the GWO algorithm has a better convergence in contrast with the other algorithms that are similar because of em-ploying the same mathematical model in order to search optimal solutions. It should be mentioned that GWO al-gorithm check the search space with high speed in the ini-tial steps for finding the optimal solution then by reaching the final steps, it reduces speed of changing position. So, convergence of an algorithm is guaranteed in the search space. The efficiency of these methods is performed with 39-bus New England system.
Structure of the article is as follows: 2th chapter pres-ents the mathematical model of TCSC. Derivation of nodal price is in 3th chapter. 4th chapter describes the
posed placement methodology for series FACTS devices in deregulated market. 5th, 6th chapters are simulation re-sults and conclusion, respectively.
2. Modelling of TCSC
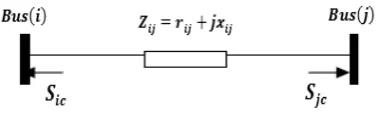
The transmission line model with a TCSC joint be-tween the two buses i and j is shown in Fig. 1. TCSC can be considered as a static reactance of magnitude equiva-lent to -jX_C. The controllable reactance is directly used as a control variable to be implemented in power flow equation.
The variation in the line flow because of series capac-itance can be illustrated as a line without series capaci-tance with power injected at the both ends of the line in sending and receiving as shown in Fig. 2.
The active and reactive power infusions due to TCSC at bus-i and bus-j can be expressed as,
(1)
(2)
(3)
(4)
where
(5)
(6)
This model of TCSC is applied to properly change the parameters of transmission line with TCSC for optimal location.
3. Extraction of nodal price
3.1 Problem formulation
In this paper, a multi-objective congestion management structure is formulated to determine the optimal locating and sizing of TCSC. The proposed structure minimizes the total operating cost and maximizes voltage stability margin (VSM) and corrected transient energy margin (CTEM) to enhance the stability of the power system. The phrases for these goals are given as follows:
- Minimize f1: Total operating cost
(7)
where SD and SG are the set of participating demands and generators in the market, respectively. Also B_Dk and C_Gk are the benefit curve of kth demand and bid curve of kth generator, respectively. It is noteworthy that the benefit curve of demands and bid curve of generators are considered as quadratic functions [29].
- Maximize f2: Voltage stability margin (VSM) In this paper, VSM [27] is the index used for measuring voltage security and continuation power flow (CPF) is used to define the maximum load ability limit.
After using congestion management, the final VSM is given below:
(8)
where VSM0is the VSM value before using congestion management and the phrase for ∆VSM is given as follows [30]:
୧ୡൌ ୧ଶȟ୧୨െ ୧୨ൣȟ୧୨ ൫Ɂ୧െ Ɂ୨൯
ȟ୧୨൫Ɂ୧െ Ɂ୨൯൧
୨ୡൌ ୨ଶȟ୧୨െ ୧୨ൣȟ୧୨ ൫Ɂ୧െ Ɂ୨൯
െ ȟ୧୨൫Ɂ୧െ Ɂ୨൯൧
୧ୡൌ െ୧ଶȟ୧୨െ ୧୨ൣȟ୧୨൫Ɂ୧െ Ɂ୨൯
െ ȟ୧୨ ൫Ɂ୧െ Ɂ୨൯൧
୨ୡൌ െ୨ଶȟ୧୨ ୧୨ൣȟ୧୨൫Ɂ୧െ Ɂ୨൯
ȟ୧୨ ൫Ɂ୧െ Ɂ୨൯൧
h
ȟ୧୨ൌ
୧୨ୡሺୡെ ʹ୧୨ሻ
ሾ୧୨ଶ ൫ ୧୨െ ୡ൯
ଶ
ሿሺ୧୨ଶ ୧୨ଶሻ
ȟ୧୨ൌ
െୡሺ୧୨ଶെ ୧୨ଶ ୧୨ୡሻ
ሾ୧୨ଶ ൫ ୧୨െ ୡ൯
ଶ
ሿሺ୧୨ଶ ୧୨
ଶሻ
݂ଵൌ ൭ ܥீሺܲீሻ אௌீ
െ ܤሺܲሻ אௌ
൱
݂ଶൌ ܸܵܯ ൌ ܸܵܯ οܸܵܯ
Fig. 2.Injection model of TCSC
Fig. 1.Model of Transmission line with TCSC
(9)
where i and j are the two buses of the branch where the TCSC is installed. Q_ic and Q_jc are reactive powers in-jected to buses because of installing TCSC as shown in Fig. 2. Q_Dk is reactive power consumption of kth de-mand and SD is the set of participating dede-mands in the market.
- Maximize f3: Corrected transient energy margin (CTEM)
In this paper, CTEM [28] is the index used to measure transient security. CTEM is defined as a function of gen-erators’ active power generation.
After using congestion management, the final CTEM is given as follows:
(10)
where CTEM0is the CTEM value before using conges-tion management and the phrase for ∆CTEM is given as follows [30]:
(11)
where PGk is active power production of kth generator and SG is the set of participating generators in the mar-ket.
The optimization is performed under the following equality and inequality constraints:
- Equality constraints: a) Power balance equation
(12)
(13)
If TCSC is located in line between buses i and j, the power balance equations in nodes i and j are given by:
(14)
(15)
(16)
(17)
where PGiand QGiare active and reactive power produc-tion at bus i, PDiand QDiare active and reactive power consumption at bus i, Picand Qicare the net active and reactive power injection at bus i.
- Inequality constraints: a) Apparent line flow limit
(18)
b) Power generation limit
(19)
(20)
c) Demand limit
(21)
(22)
d) Bus voltage limit
(23)
e) TCSC reactance limit
(24)
f) VSM limit
(25)
g) CTEM limit
(26)
where PGimin and P
Gimaxare minimum and maximum active power production at bus i, QGiminand Q
Gimaxare minimum and maximum reactive power production at bus i, PDimin and PDimaxare minimum and maximum active power con-sumption at bus i, QDimin and Q
Dimaxare minimum and maximum reactive power consumption at bus i, Viminand Vimaxare minimum and maximum voltage at bus i, S
ijis the apparent power in transmission line connecting buses i and j, and Sijmaxis its maximum limit, x
cminand xcmaxare the minimum and maximum limits of TCSC reactance, and N is the number of buses in the system.
οܸܵܯ ؆ െ߲ܸܵܯ
߲ܳ
ܳെ
߲ܸܵܯ ߲ܳ
ܳ
߲ܸܵܯ
߲ܳοܳ אௌ
݂ଷൌ ܥܶܧܯ ൌ ܥܶܧܯ οܥܶܧܯ
οܥܶܧܯ ؆ ߲ܥܶܧܯ ߲ܲீ
οܲீ אௌீ
୧ሺɅǡ ሻ െ ୋ୧ ୈ୧ൌ Ͳǡǡ
୧ሺɅǡ ሻ െ ୋ୧ ୈ୧ൌ Ͳǡǡ
୧ሺɅǡ ሻ െ ୋ୧ ୈ୧ ୧ୡൌ Ͳǡǡ
୧ሺɅǡ ሻ െ ୋ୧ ୈ୧ ୧ୡൌ Ͳǡǡ
ሺ ሻ
୨ሺɅǡ ሻ െ ୋ୨ ୈ୨ ୨ୡൌ Ͳǡǡ
ሺ ሻ
୨ሺɅǡ ሻ െ ୋ୨ ୈ୨ ୨ୡൌ Ͳǡǡ
ห୧୨ሺɅǡ ሻห ୧୨୫ୟ୶
ୋ୧୫୧୬
ୋ୧ ୋ୧୫ୟ୶
୫୧୬ୋ୧
ୋ୧ ୫ୟ୶ୋ୧
ୈ୧୫୧୬ ୈ୧ ୈ୧୫ୟ୶
ୈ୧୫୧୬ ୈ୧ ୈ୧୫ୟ୶
୧୫୧୬ ୧ ୧୫ୟ୶
ୡ୫୧୬
ୡ ୡ୫ୟ୶
3.2 Nodal price
Define the Lagrangian function as L, then
(27)
where λ= (λ1, …, λn1) and ρ= (ρ1, …, ρn2) are the la-grangian multipliers associated with equality and inequal-ity constraints, respectively, in addition to it they are usually explained as shadow prices from the economics point of view.
Then at an optimal solution (X, λ, ρ) and for a set of given (P, Q), the nodal prices of real and reactive power for each bus are presented for k = 1,…, n as follows:
(28)
(29)
A remarkable trait for nodal prices is that each nodal price is absolutely defined simply as a linear summation of all factors according to Eq. (28) and (29) equation be-cause each nodal price, e.g.,π_(P,k) can be rewritten as,
(30)
On the other hand, this trait is completely different from that of AC load flow, which is generally nonlinear to each route or source. Therefore, theoretically it is pos-sible to trace the contributions of all factors engaging in performance of power systems to each nodal price.
4. Proposed methodology
There are numerous constraints or factors affecting the operation of power systems, e.g., line flow limitation, gen-erators, voltage limitation, and power flow balance situa-tion. Some of them (e.g., voltage constraint) have market values that may be relaxed and taken as some tradable things rely on market needs. The relaxation for these lim-its may be figured out by facility investments or technol-ogy innovations, etc. However, some of them really cannot be traded, e.g., for real power flow balance situa-tion at each bus, the summasitua-tion of all injected real power at each bus must be zero which cannot be relaxed or vio-lated because it is a physical law. However, the evaluation for the factors with no market value is pointless, even though we can theoretically follow the shares of all factors involving in the performances of power systems to each nodal price. Hence, before breaking down the nodal prices, we have to classify all constraints in the perform-ances of power systems into two groups [31], i.e., no trad-able constraints that are forcible constraints during the
operation and are not components of nodal prices, and tradable constraints, which should be components of each nodal price. Let M be the constraints which we do not in-tend expressly to count their charges for nodal prices (no tradable constraints), and N be the remaining constraints (tradable constraints). Define α to be the Lagrangian mul-tipliers corresponding to the constraints of M, and β to be the remaining Lagrangian multipliers corresponding to N.
By considering X and 𝛼as functions of (P, Q), the La-grangian function of Eq. (27) can be rewritten as follows [31]:
(31)
Therefore, differentiating L of Eq. (31) with respect to p_k and q_k, nodal prices of Eq. (28) and (29) become,
(32)
(33)
Next, we display that Eq. (32) is actually the decom-posed nodal prices. If the objective function is constructed by many factors, i.e., f=∑ifi , then fxXpk+fpk=∑i((∂fi/∂x)(∂x/∂pk)+(∂fi/∂pk)) for the first term of Eq. (32). Let N=(N1, N2, …)Tand β=(β
1, β2, …) where Njand βjare the jth equation of N and its respective lagrangian multiplier. Then the second term of Eq. (32) can be represented as β(NxXpk+Npk)=∑Jβj((∂Nj/∂x)(∂x/∂pk)+(∂Nj/∂pk)). Therefore, ((∂fi/∂x)(∂x/∂pk)+(∂fi/∂pk)) is the component associated to the factor fi(e.g., the ith generator) for real power, while βj((∂Nj/∂x)(∂x/∂Pk)+(∂Nj/∂pk)) represent the term of the respective constraint Nj for real power. Generally, each term in Eq. (32) is nonzero at an optimal solution, in contrast with the terms of Eq. (28).
5. Simulation results and discussion
Because of the high cost of power flow control devices installation and variety of these devices and also changing the price of these devices with changing capacity, the sys-tem operator should study carefully in order to select type, capacity and a good place to install these devices. Eco-nomical installation costs of FACTS devices in the net-work should be checked from the point of view of consumer, producer and operator. It is very important eco-nomically and it has tried to check the subject in order to analyze the impact of devices on the network to obtain properly analysis.
L(X,Ȝ,ɏ,P,Q) = f(X,P,Q) +Ȝ G(X,P,Q) + ɏ H(X,P,Q)
Ɏǡ୩ൌ
μ μ୩
ൌ μ μ୩
ɉμ
μ୩
ɏμ
μ୩
Ɏ୯ǡ୩ൌ
μ μ୩ൌ
μ μ୩ ɉ
μ μ୩ ɏ
μ
μ୩
Ɏǡ୩ൌ
μ୧
μ୩ ୧
ɉ୧
μ୧
μ୩ ୧
ɏ୧
μ୧
μ୩ ୧
ሺሺǡ ሻǡ Ƚሺǡ ሻǡ ǡ ሻ
ൌ ሺሺǡ ሻǡ ǡ ሻ Ƚሺǡ ሻሺሺǡ ሻǡ ǡ ሻ Ⱦሺሺǡ ሻǡ ǡ ሻ
Ɏ୮ǡ୩ൌ ൫ଡ଼୮୩ ୮୩൯ Ⱦ൫ଡ଼୮୩ ୮୩൯
Ɏ୯ǡ୩ൌ ൫ଡ଼୯୩ ୯୩൯ Ⱦ൫ଡ଼୯୩ ୯୩൯
ሺ ൌ ͳǡ ǥ ǡ ሻ
In this paper, for 39-bus New England system which is shown in Fig. 3, four scenarios have been described ac-cording to Table 1 that shows minimum and maximum demand of spring and summer seasons. To simulate con-gestion, these scenarios have been considered as incre-ment factor (λ) and multiply in all system loads. To calculate the amount of power flow on each line, buses voltage, active and reactive power generation of power plants, consumption of active and reactive power of load buses and other values, optimal power flow (OPF) for each scenario has been performed. Then, component of nodal price method indicates the accuracy for explanation of each nodal price, by categorizing each nodal price into variety of elements corresponding to the important fac-tors, as generations, transmission density, voltage con-straints and other limitations. After performing OPF in all scenarios, each nodal price is checked to find impact of activated constraint in network on each bus price. By cal-culating component of nodal price, enough information for the analysis of prices and deciding on the allocation of devices is obtained.
In this paper, to manage congestion, dense lines in dif-ferent scenarios are separated from another line and then the most effective dense line that has more effect on nodal prices is selected. This means that because of rising de-mand in the system, number of dense lines in the system is increased too, and because it is not possible to install FACTS devices in several lines due to more cost of instal-lation, the system operator must choose most effective line between the all dense lines. Therefore, the importance of the allocation of the power flow control devices to con-trol density on the network is increased.
5. 1. Analysis of network in the presence of conges-tion of transmission lines
Table 2 shows the results after implementing optimal power flow for four scenarios in 39-bus New England sys-tem. In this paper, the capacity of lines 1-2, 6-7, 12-11 and
17-27 are set to 150, 330, 40 and 50 MVA, respectively, as extra suppositions [30].
Checking the activated constraints in four scenarios show that by changing the load levels in the system, lim-itations would occur that these limlim-itations include ap-proaching plants generation to the highest and lowest level of their generation. In both cases, this limitation has impact on the network power flow and the price of buses. Another limitation is the voltage level of buses. As it is known, the voltage level must be provided in a specified Fig. 3.39-bus New England system
Table 1.Scenarios defined
Ȝ = LoadLevel
0.3
Scenario1
Spring
1
Scenario2
0.8
Scenario3
Summer
1.023
Scenario4
Table 2.Active constraints in each scenario
tolerance for the consumer because power systems equip-ment and consumer equipequip-ment would be damaged when voltage level achieves to high or low level. Also, these limitations make problems in the network that are com-promised by the stability of the power system, so they must be removed. The final limitation is overloading of transmission lines that the importance of this constraint in the power network is great. Since the transmission lines are connector between the producer and consumer, and since the amount of consumption in network is increased daily and new consumer feed from this system, power system operator must create a competitive market that all participants can access to network easily and freely.
In addition, by checking activated constraints in all sce-narios, congestion limitation of transmission lines is sep-arated from another limitation. It should be mentioned that the most important criteria for choosing the line is the im-pact of this on buses price and the number of congestion in different scenarios. According to the mentioned criteria, candidate transmission lines for installation of TCSC in 39-bus New England system are given in Table 3.
Also, In order to evaluate dependability of the pro-posed method, the results of simulation with LMP differ-ences method [6] for optimal locating of TCSC are added to Table 3.
The results show that, the proposed method determines the lines 21, 12, 1, 3 and 31 as the candidate locations for the installation of TCSC, respectively. In contrast, the LMP different method determines the lines 12, 1, 11, 10 and 6 as the candidate locations for the installation of TCSC based on minimum total congestion cost, respec-tively. It can be seen that the lines 12 and 1 in both meth-ods are repeated.
Furthermore, proposed method is a competitive tool to determine the optimal location of FACTS devices. In this paper, the line 12 is considered as the best location for the installation of TCSC.
5. 2. Sizing TCSC using MOGWO algorithm 5.2.1 MOGWO
This section summarizes the main steps in multi objec-tive grey wolf optimizer (MOGWO) algorithm. The
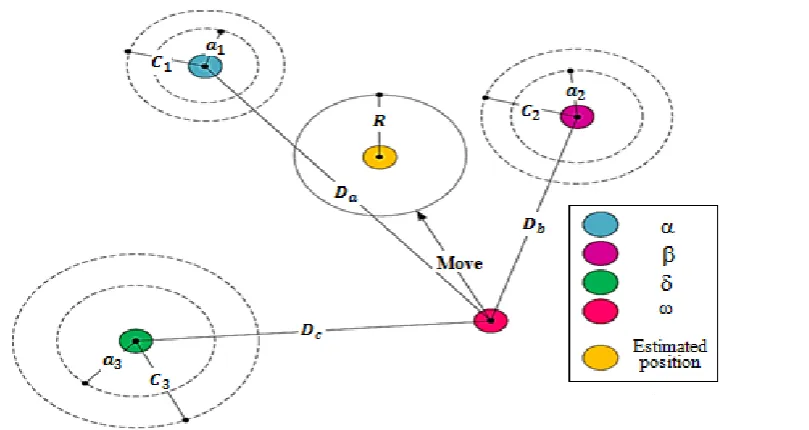
GWO is a new meta-heuristic algorithm inspired by grey wolves. The GWO algorithm mimics the hunting mecha-nism and headship hierarchy of grey wolves in nature. Four kinds of grey wolves such as alpha, beta, delta, and omega are used for simulating the leadership hierarchy. Also, three main steps of hunting, entitled seeking for hunt, encircling hunt, and attacking to hunt are accom-plished.
For mathematical social hierarchy modeling of grey wolf, it is assumed that the best solutions are obtained by the wolves, alpha (α), beta (β) and delta (δ), respectively and other wolves are assumed to be omega (ω). In fact, hunting would be guided by three wolves, alpha, beta and delta and other wolves follow these three wolves.
Encircling prey can be modeled by the following equa-tions:
(34)
(35)
where i is the present iteration, C ⃗and A ⃗are coefficient vectors, (Xp) ⃗represents the position vector of the victim, and X ⃗represents the position vector of a grey wolf.
The vectors A ⃗and C ⃗are calculated from the following equations:
(36)
(37)
In Eq. (36) and (37), coefficient a ⃗decreases linearly from 2 to 0 in each iteration and r ⃗1and r ⃗2are random vectors between [0, 1].
For mathematical modeling of hunting, it is assumed that α is the best answer and β, δ are best knowledge for prey position. With saving these three answers and updat-ing other search agents such as ω by the followupdat-ing equa-tions, the new answers may be achieved. This continues up to reaching the best answers. In this algorithm, for searching a prey, grey wolves diverge from each other. Mathematically modeling, when |A ⃗|>1 forces the wolves to diverge from wide search space, hopefully find a better position. Afterwards estimating a prey converge they would get ready to raid the prey. Also, (C ) ⃗vector com-ponent has random values between [0-2] that not linearly decrease in contrast to( A ) ⃗. This parameter helps to avoid algorithm of stopping on local optimum.
(38)
ܦሬሬԦ ൌ หܥԦǤ ܺԦሺ݅ሻ െ ܺԦሺ݅ሻห
ܺԦሺ݅ ͳሻ ൌ ܺԦሺ݅ሻ െ ܣԦǤ ܦሬሬԦ
ܣԦ ൌ ʹܽԦǤ ݎԦଵെ ܽԦ
ܥԦ ൌ ʹǤ ݎԦଶ
ܦሬሬԦఈൌ หܥԦଵǤ ܺԦఈെ ܺԦหǡ ܦሬሬԦఉൌ หܥԦଶǤ ܺԦఉെ ܺԦหǡ ܦሬሬԦఋൌ
หܥԦଷǤ ܺԦఋെ ܺԦห (38 Table 3.Candidate branches for TCSC in 39-bus New
Eng-land system
LMP differences method [6] Proposed method
Candidate
numbers Candidate Candidate locations
locations
Line 12: 6-7 Line 21: 11-12
1
Line 1: 1-2 Line 12: 6-7
2
Line 11: 5-8 Line 1: 1-2
3
Line 10: 5-6 Line 3: 2-3
4
Line 6: 3-4 Line 31: 17-27
5
(39)
(40)
Fig. 4 shows that in a two-dimensional space, how the search agents are updated by alpha, beta and delta posi-tions. In other words, Fig. 4 shows that α, β and δ estimate probable position of the prey (best answer) in the search space and other wolves update their position in the ran-dom place within a circle around the α, β and δ.
Two new components: first, an archive that is respon-sible for storage of optimal solutions of non-dominated Pareto and second, leader selection strategy that helps to choose the best leader between archive, are added here in order to create multi objective GWO algorithm [32]. Aux-iliary components added are similar to MOPSO method. An archive that is added for creating multi objective GWO algorithm is a simple storage unit. This unit stores the best optimal solutions of non-dominated Pareto ob-tained so far.
The second component helps us choose the leader by using roulette wheel method and probability function that is introduced in the following:
(41)
C1: a constant number greater than 1
Ni: Number of obtained Pareto optimal solutions in the ith segment.
More comprehensive description of the MOGWO al-gorithm is given in [32].
5.2.2 Utilization of MOGWO in sizing TCSC In this section, the MOGWO algorithm for sizing of TCSC is presented. In this algorithm, first, initial popula-tion of wolves, parameter a ⃗, coefficient vectors( A) ⃗, C ⃗ and maximum numbers of iteration are defined. Then, ini-tial population of wolves are spread randomly in the de-fined search space that the position of each wolf has been considered as value of TCSC. For each position, optimal power flow runs in order to calculate the fitness functions according to equations (7), (8), and (10), subject to satisfy constraints (12) to (26). Then, the non-dominant solutions are determined and the archive is initialized according to them. The best position of wolves in the archive, are named as 𝛼, β and δ and the position of the rest of wolves are called ω. Then, the value of parameter a ⃗decreases linearly from 2 to 0 in each iteration in order to confirm exploration and exploitation.
At this point, the position of the other wolves (ω) rel-ative to top wolves' position (alpha, beta and delta), is up-dated according to equations (38) and (39). This update, takes places according to distance of rest of the wolves (ω) from top wolves' position (alpha, beta and delta) and are named as X1, X2 and X3. Then, next new position is obtained by calculating average of the positions X1, X2 and X3according to equation (40). The value of fitness functions for this position is calculated. At this time, the non-dominant solutions are determined and the archive is updated according to them. Then if the archive would be full, the grid mechanism runs to omit one of the current archive members and add the new solution to the archive.
ൌ ܥͳ ܰൗ
ܺԦଵൌ ܺԦఈെ ܣԦଵǤ ൫ܦሬሬԦఈ൯ǡ ܺԦଶൌ ܺԦఉെ ܣԦଶǤ ൫ܦሬሬԦఉ൯ǡ ܺԦଷ ൌ ܺԦఋെ ܣԦଷǤ ൫ܦሬሬԦఋ൯
ܺԦሺ݅ ͳሻ ൌܺԦଵ ܺԦଶ ܺԦଷ
͵
Fig. 4.Position updating in GWO
Else, if each of the new added solutions to the archive is located outside the hypercube, update the grids to cover the new solution(s). Else, select leaders from the archive. These processes will be continued until reaching favor-able position or maximum iteration. The flowchart of uti-lization of MOGWO algorithm in sizing TCSC is shown in Fig. 5.
5. 3. Fuzzy method
In order to specify a set of solutions, we need to get a pliable solution and demonstrate a trade-off among vari-ous objectives. In case of selecting an agreed-upon solu-tion among a set of solusolu-tions, there are different approaches. A fuzzy method is of great interest because of its ease. The fuzzy sets are specified by membership functions that represent the grade of membership in a fuzzy set, with values from 0 to 1 [33]. In the fuzzy ap-Fig. 5.The flowchart of utilization of MOGWO algorithm in sizing TCSC
proach, a strictly monotonically decreasing and continu-ous membership function is defined for each objective.
The membership function illustrates the extent in which a solution is satisfying the objective functions q. A linear membership function can be applied for all objec-tives:
(42)
Fig. 6 shows the graph of this membership function.
By taking the individual minimum and maximum val-ues of each objective function into account, the member-ship function μ_(f_q ) (X ̅ ) for each objective function
can be specified in a subjective method. Then, for a multi-objective optimization problem with Q multi-objective func-tions, the final solution can be found as:
(43)
5. 4. Results
The proposed methodology for optimal locating of TCSC is performed for two cases, as follows:
First case: Optimal locating of TCSC for single-objec-tive congestion management: In this case, total operating cost would be considered as a single objective for optimal placement.
Second case: Optimal locating of TCSC for multi-ob-jective congestion management: In this case, total oper-ating cost, voltage and transient security would be considered as three objectives for optimal placement.
Here, it should be noted that all calculations and analy-ses are performed for peak load demand and there is more congestion in the network at the same time.
The optimized results for the first case are shown in Table 4. In addition, In order to evaluate the dependability of the proposed method, the results of simulation with modified augmented ԑ-constraint method [30] are added to Table 4.
Variation of operating cost curve based on the first case using GWO algorithm has been shown in Fig. 7. To solve the problem of sizing TCSC by proposed algorithm,
݉ܽݔ ൜݉݅݊ ቄߤሺܺതሻቅൠǢ ݍ ൌ ͳǡʹǡ ǥ ܳ
ߤሺܺതሻ ൌ
ە ۖ ۔ ۖ
ۓ Ͳ݂ሺܺതሻ ݂௫
ೌೣିሺതሻ
ೌೣି݂
݂
ሺܺതሻ ݂௫
ͳ݂ሺܺതሻ ൏ ݂
Fig. 6.Linear type membership function
Fig. 7.The variation of operating cost curve based on the first case using GWO
Cost ($/hour) TCSC (%)
TCSC branch (Candidatelocation)
7958.89 70
Line12:6-7 proposedmethodology
7959.69 70
Line12:6-7 Modifiedaugmented
-constraintmethod [30]
Table 4.Optimal solution based on the first case
GWO algorithm has been run 50 times for this case, and controlling parameter of GWO algorithm is as follow:
Number of grey wolves = 30
The CPU time is needed for sizing TCSC is less than 5 second at each iteration. The evaluation platform is a workstation system with a 2.66 GHZ Intel Core 2 Duo CPU and 4GBs of RAM.
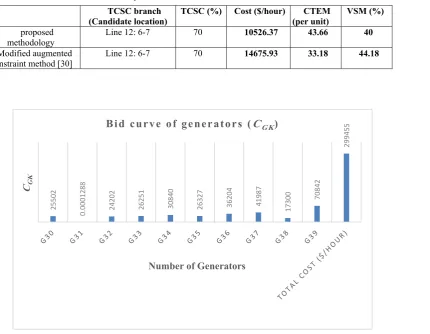
The optimized results for the second case are shown in Table 5. In addition, In order to evaluate the dependability of the proposed method, the results of simulation with modified augmented ԑ-constraint method [30] are added to Table 5.
The bid curve of generators and benefit curve of de-mands based on the second case are shown in Fig. 8 and 9, respectively. According to Fig. 8 and 9, the total oper-ating cost (according to Eq. (7)) based on the second case is about US$/hour 10526.
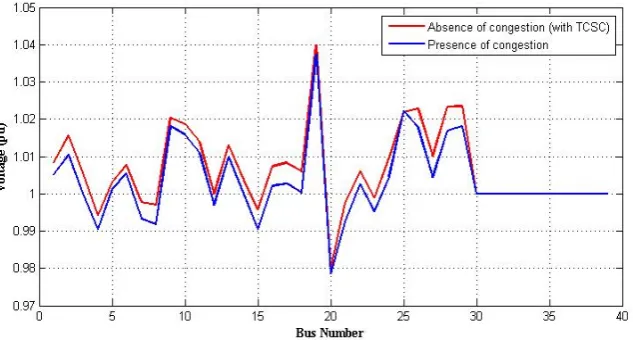
Variation of operating cost curve based on the second case using proposed algorithm has been shown in Fig. 10. The buses voltage magnitude based on the second case has been shown in Fig. 11.
According to Fig. 11, the buses voltage magnitude is increased compared to presence of congestion (without TCSC). The Pareto-approximation fronts (PAFs) achieved from the second case using GWO algorithm is shown in Fig. 12. To solve the problem of sizing TCSC by proposed algorithm, GWO algorithm has been run 50 times for this case, and controlling parameter of GWO algorithm is as follow:
Number of grey wolves= 30
The CPU time is needed for sizing TCSC is less than 20 second at each iteration.
Fig. 12(a)-(c) shows the Pareto-approximation fronts for multi-objective congestion management. Fig. 12(a) shows a relation between the VSM and total operating cost. Increasing the total operating cost, the VSM index is not changed considerably. It is noted that VSM is func-tion of (PDk, QDk). In voltage stability studies, PDkand QDkare usually elevated with a constant power factor by CPF. Therefore, we can say that variables of P_Dk and QDkare dependent and thus VSM can be assumed as a
VSM(%) CTEM
(perunit) Cost ($/hour)
TCSC(%) TCSCbranch
(Candidatelocation)
40 43.66
10526.37 70
Line12:6-7 proposed
methodology
44.18 33.18
14675.93 70
Line12:6-7 Modifiedaugmented
-constraintmethod [30]
Table 5.Optimal solutions based on the second case
25502 0.0001288 24202 26251 30840 26327 36204 41987 17300 70842
299455
CG
K
NumberofGenerators
Bi d c u rve o f g e n e r ato r s (
C
GK)Fig. 8.bid curve of generators based on the second case
13202 22277 12568 21402 357 11219 11470 39015 12759 16871 12653 15308 13769 9814 14878 61367
288929
BDK
Numberofload buses
B en e f it c u rve o f d e m a n d s (BD K)
Fig. 9.benefit curve of demands based on the second case
Fig. 10.The variation of operating cost curve based on the second case
Fig. 11.Buses voltage magnitude based on the second case
function of only QDk, so, by changing the unit’s genera-tion and cost, it will not be changes considerably. Fig. 12(b) shows a relation between the CTEM and total op-erating cost. Increasing the CTEM index increases the total operating cost considerably. When cost is considered as a target, the unit’s generation is changed to achieve the minimum cost. On the other hand, when CTEM is con-sidered as a target, due to dependence of CTEM to unit’s
generation and difference between unit’s generation and optimal value, the cost will be increased. Also, CTEM is function of (PGk), so, by changing unit’s generation and cost, it can be increased. Fig. 12(c) shows a relation be-tween the VSM and CTEM. Increasing the CTEM, the VSM index is not changed considerably.
) a (
) b (
) b (
) c (
Fig. 12.The PAFs for multi-objective congestion management and trade-offs between (a) VSM and total operating cost. (b) CTEM and total operating cost. (c) VSM and CTEM.
6. Conclusion
This paper focuses on describing a multi-objective con-gestion management structure to determine the optimal locating of TCSC. Candidate transmission lines for instal-lation of TCSC are selected by using components of nodal prices. For introducing group of non-dominated solutions, MOGWO algorithm based on OPF is applied. Then fuzzy decision making approach is used to lead to the best re-sponse. The results of simulation are compared with other published research papers. The results show that by com-bining components of nodal prices and grey wolf opti-mizer, the optimal locating and sizing of the series FACTS devices for multi-objective congestion management can be achieved in restructured power systems by higher con-vergence speed and more flexibility.
References
[1]. A. Kumar, S. C. Srivastava and S. N. Singh, “Con-gestion management in competitive Power Systems Research power market: a bibliographical survey”, Electric, Vol. 76, pp. 153-164, 2005.
[2]. K. Vijayakumar, “Multiobjective Optimization Methods for Congestion Management in Deregu-lated Power Systems”, Journal of Electrical and Computer Engineering, Vol. 2012, pp. 1-8, 2012. [3]. S. Verma and V. Mukherjee, “Optimal real power
rescheduling of generators for congestion manage-ment using a novel ant lion optimiser”, IET Gener-ation, Transmission & Distribution, Vol. 10, No. 10, pp. 2548-2561, 2016.
[4]. M. Heydaripour and A. Akbari Foroud, “A New Framework for congestion management with Exact Modeling of Impacting Factors”, Iranian Journal of Electrical & Electronic Engineering, Vol. 8, No. 4, pp. 329-340, 2012.
[5]. B. KumarPanigrahi, “Locational Marginal Pricing (LMP) in Deregulated Electricity Market”, Inter-national Journal of Electronics Signals and Sys-tems, Vol. 1, No. 2, pp. 101-105, 2012.
[6]. N. Acharya and N. Mithulananthan, “Locating se-ries FACTS devices for congestion management in deregulated electricity markets”, Electric Power Systems Research, Vol. 77, pp. 352-360, 2007. [7]. T. Bhattacharjee and A. Kumar Chakraborty,
“Con-gestion management in a deregulated power system by rescheduling of sensitive generators and load curtailment using PSO”, International Journal of Emerging Technology and Advanced Engineering, Vol. 2, No. 3, pp. 284-289, 2012.
[8]. N. S. Modi and B. R. Parekh, “Transmission Net-work Congestion in Deregulated Wholesale Elec-tricity Market”, Proceedings of the International Multi Conference of Engineers and Computer Sci-entists, Hong Kong, Vol. 2, pp. 1-5, 2009.
[9]. E. Eugene Litvinov, T. Zheng, G. Rosenwald and
P. Shamsollahi, “Marginal Loss Modeling in LMP Calculation”, IEEE Transactions on power systems, Vol. 19, No. 2, pp. 880-888, 2004.
[10]. F. Yong and L. Zuyi, “Different Models and Proper-ties on LMP Calculations”, IEEE Power Engineering Society general meeting, Montreal, Que, 2006. [11]. S. Balaraman and N. Kamaraj, “Real Time
Conges-tion Management in Deregulated Electricity Market Using Artificial Neural Network”, Iranian Journal of Electrical and Computer Engineering, Vol. 10, No. 1, pp. 34-40, 2011.
[12]. K. Singh, N. P. Padhy and J. Sharma, “Congestion management considering hydro-thermal combined operation in a pool based electricity market”, Elec-trical Power and Energy Systems, Vol. 33, pp. 1513-1519, 2011.
[13]. S. A. Hosseini, N. Amjady and M. Shafie-khah, “A new multi-objective solution approach to solve transmission congestion management problem of energy markets”, Applied Energy, Vol. 165, pp. 462-471, 2016.
[14]. H. Patel and R. Paliwal, “Congestion management in deregulated power system using facts devices”, International Journal of Advances in Engineering & Technology, Vol. 8, No. 2, pp. 175-184, 2015. [15]. M. Gitizadeh and M. Kalantar, “FACTS devices
al-location to congestion alleviation incorporating voltage dependence of loads”, Iranian Journal of Electrical & Electronic Engineering, Vol. 4, No. 4, pp. 176-190, 2008.
[16]. N. R. Kumari and K. C. Sekhar, “Optimal Place-ment of TCSC Based on Sensitivity Analysis for Congestion Management”, International Journal of Electrical and Computer Engineering (IJECE), Vol. 6, No. 5, pp. 2041-2047, 2016.
[17]. K. Arun Kumar Reddy and P. S. Shiv, “Congestion mitigation using UPFC”, IET Generation, Trans-mission & Distribution, Vol. 10, No. 10, pp. 2433-2442, 2016.
[18]. A. Mishra and V. N. Kumar Gundavarapu, “Line utilisation factor-based optimal allocation of IPFC and sizing using fire fly algorithm for congestion management”, IET Generation, Transmission & Distribution, Vol. 10, No. 1, pp. 115-122, 2016. [19]. R. Jahani, H. ChahkandiNejad, A.
ShafighiMalek-shah and H. A. Shayanfar, “A New Advanced Heuristic Method for Optimal Placement of Uni-fied Power Flow Controllers in Electrical Power Systems”, Int. Rev. Electr. Eng. (IREE), Vol. 5, No. 6, pp. 2786-2794, 2001.
[20]. A. Kumar and C. Sekhar, “Comparison of Sen Transformer and UPFC for congestion manage-ment in hybrid electricity markets”, International Journal of Electrical Power & Energy Systems, Vol. 47, pp. 295-304, 2013.
[21]. A. LashkarAra, J. Aghaei and M. Shabani, “Introduc-ing a Fuzzy Interactive Multi-objective Approach to Optimal Location of UPFC”, Int. Rev. Electr. Eng. (IREE), Vol. 5, No. 6, pp. 2896-2906, 2010. [22]. B. Bhattacharyya and V. K. Gupta, “Fuzzy Genetic
Algorithm Approach for the Optimal Placement of Flexible AC Transmission Systems Devices in a Power System”, Electric Power Components and Systems, Vol. 42, No. 8, pp. 779-787, 2014. [23]. A. Y. Abdelaziz, M. A. El-Sharkawy and M. A. Attia,
“Optimal location of thyristor-controlled series com-pensators in power systems for increasing loadability by genetic algorithm”, Electric Power Components and Systems, Vol. 39, pp. 1373-1387, 2011. [24]. R. A. Hooshmand, M. J. Morshed and M.
Paraste-gari, “Congestion management by determining op-timal location of series FACTS devices using hybrid bacterial foraging and Nelder-Mead algo-rithm”, Applied Soft Computing, Vol. 28, pp. 57-68, 2015.
[25]. A. Zamora-Cárdenas and C. R. Fuerte-Esquivel, “Multi-parameter trajectory sensitivity approach for location of series-connected controllers to enhance power system transient stability”, Electric Power Sys-tems Research, Vol. 80, pp. 1096-1103, 2010. [26]. S. R. Inkollu and V. R. Kota, “Optimal setting of
FACTS devices for voltage stability improvement using PSO adaptive GSA hybrid algorithm”, Inter-national Journal Engineering Science and Technol-ogy, Vol. 19, No. 3, pp. 1166-1176, 2016. [27]. N. Amjady and M. Esmaili, “Improving voltage
se-curity assessment and ranking vulnerable buses with consideration of power system limits”, Inter-national Journal of Electrical Power & Energy Sys-tems, Vol. 25, pp. 705-715, 2003.
[28]. F. Da-Zhong, T. S. Chung, Z. Yao and S. Wennan, “Transient stability limit conditions analysis using a corrected transient energy function approach”, IEEE Transactions on Power Systems, Vol. 15, pp. 804-810, 2000.
[29]. P. Kumar Tiwari and Y. Raj Sood, “An Approach for Optimal Placement, Rating and Investment Cost Recovery of a TCSC in Double Auction Power Market”, Proceedings of International Conference on Power Systems, Energy, Environment, pp. 91-97, 2014.
[30]. M. Esmaili, H. A. Shayanfar and R. Moslemi, “Lo-cating series FACTS devices for multi-objective congestion management improving voltage and transient stability”, European Journal of Opera-tional Research, Vol. 236, pp. 763-773, 2014. [31]. L. Chen, H. Suzuki, T. Wachi and Y. Shimura,
“Components of Nodal Prices for Electric Power Systems”, IEEE Trans. Power Apparat. Syst., Vol. 17, No. 1, pp. 41-49, 2002.
[32]. S. Mirjalili, S. Saremi., S. M. Mirjalili and L. Coelho, “Multi-objective grey wolf optimizer: A novel algorithm for multi-criterion optimization”, Expert Systems with Applications, Vol. 47, pp. 106-119, 2016.
[33]. P. Maghouli, S. H. Hosseini, M. Buygi and M. Shahidepour, “A multi-objective framework for transmission expansion planning in deregulated en-vironments”, IEEE Trans. on Power Syst., Vol. 24, No. 2, pp. 1051-1061, 2009.
Alireza Moradi was born in Semnan, Iran, in 1986. He re-ceived the B.Sc. and M.Sc. de-grees in electrical engineering from Semnan and Birjand Uni-versity in 2010 and 2012, respec-tively. He is currently a Ph.D. student at the Semnan University. His research in-terests include security assessment of power sys-tems, power system planning, power quality, artificial intelligence, and its application to the problems of the power systems.
Yousef Alinejad-Beromi was born in Damghan, Iran. He re-ceived the B.Sc. degree in elec-trical engineering from K.N.T. University, Tehran, Iran, and the M.Sc. and Ph.D. degrees from UWCC, Cardiff, U.K., in 1989 and 1992, respectively. He is currently an Associate Professor with the Faculty of Electrical and Com-puter Engineering, Semnan University, Semnan, Iran.
Kourosh Kiani was born in Sem-nan, Iran. He received the B.Sc. and M.Sc., degrees in electrical engineering from Delft Univer-sity of Technology in Delft, the Netherlands in 1993 and the Ph.D. degree in Medical infor-mation from Erasmus University in Rotterdam, the Netherlands in 1997. He is currently an Assistant Professor with the Faculty of Electrical and Com-puter Engineering, Semnan University, Semnan, Iran. His research interests include artificial intel-ligence, neural network, and fuzzy logic.