Please cite this article as: P. Pourkarim Guilani, M. Sharifi, S.T.A. Niaki, A. Zaretalab, Redundancy Allocation Problem of a System with Three-state Components: A Genetic Algorithm, International Journal of Engineering (IJE), TRANSACTIONS B: Applications Vol. 27, No. 11, (November 2014) 1663-1672
International Journal of Engineering
J o u r n a l H o m e p a g e : w w w . i j e . i r
Redundancy Allocation Problem of a System with Three-state Components: A
Genetic Algorithm
P. Pourkarim Guilania, M. Sharifia, S.T.A. Niaki* b, A. Zaretalaba
a Faculty of Industrial and Mechanical Engineering, Islamic Azad University, Qazvin Branch, Qazvin, Iran b Department of Industrial Engineering, Sharif University of Technology, Tehran, Iran
P A P E R I N F O
Paper history: Received 06 April 2014
Received in revised form 21 May 2014 Accepted 26 June 2014
Keywords: Reliability Multi-state Systems
Redundancy Allocation Problem Three-state Components Genetic Algorithm
A B S T R A C T
The redundancy allocation is one of the most important and useful problems in system optimization, especially in electrical and mechanical systems. The object of this problem is to maximize system reliability or availability within a minimum operation cost. Many works have been proposed in this area so far to draw the problem near to real-world situations. While in classic models the system components are assumed to have two states of working and failed, in this paper, parallel components of serial sub-systems are considered to work in three states, each with a certain performance rate. The component states are classified into two working states of working with full performance and working with half performance, and a failed state. Besides, technical and organizational activities are considered to improve the performance of the components as well as the sub-systems. As the problem belongs to the class of NP-hard, a genetic algorithm is utilized to solve it.
doi: 10.5829/idosi.ije.2014.27.11b.03
1. INTRODUCTION1
The redundancy allocation problem (RAP) is a complex combinational optimization problem, in which the goal is to determine the optimal combination of the components of a system in order to maximize the reliability under cost and weight constraints. This problem has many applications in industries. Electronic systems, power stations, and production systems are some examples of RAP applications.
In all research performed on RAP, a system is classified into two categories based on the operation of its components: binary-state and multi-state components. In a binary system, both the system and its subsystems can only take two possible states of "completely working" and "completely failed." Fyffe et al. [1] introduced the basic RAP model with an active strategy of components. The objective function of his model was to maximize the system reliability under weight and cost constraints. He employed a dynamic programming approach to solve the problem. Nakagawa
1*Corresponding Author’s Email: [email protected](S.T.A. Niaki)
and Miyazaki [2] solved 33 RAPs using an exact approach called surrogate constraint and showed it is more efficient than the dynamic programming approach. In these problems, the upper limit in the weight constraint was considered to range between 159 and 191. Bulfin and Liu [3] proposed three different methods; one heuristic and two exact, to solve RAP. Misra and Sharma [4] investigated RAP of systems with k-out-of-n sub-systems. In their presented model, the redundancy strategy was considered a decision variable. Chern [5] showed that RAP belongs to the class of NP-hard problems. Therefore, heuristic and meta-heuristic approaches are justified to solve large-size RAP in terms of the number of components. Coit and Smith [6] presented a new model for series-parallel RAP with k-out-of-n sub-systems with the choice of selecting active and cold-standby redundancy strategy. Moreover, Coit and Smith [7] considered RAP of k-out-of-n series-parallel systems with the choice of different components, active strategy, and uncertainly in reliability components. Ida et al. [8] and Yokota et al. [9] employed genetic algorithms (GA) to solve RAP without the choice of allocation of different types of
components to each sub-system in a series-parallel system. Coit and Smith [10] used GA to solve the problem presented in the literature [6].
One of the most difficult problems in solving RAP using a meta-heuristic algorithm is to generate and select infeasible solutions. Defining a penalty function is an appropriate approach to overcome this problem. Coit and Smith [11] presented a penalty function to encourage the algorithm to search the boundaries between feasible and near feasible area. Coit and Liu [12] proposed a new RAP model with the choice of selecting different redundancy strategies. In his later work, Coit [13] extended Coit and Liu's [12] model to have the redundancy strategy as a decision variable. Further utilization of GA corresponds to Tavakoli-Moghadam et al. [14] who solved the model presented by Coit [13] using GA.
In a multi-state system (MSS), the components can assume more than two states, each with a performance rate between the perfect working and failed states. This leads to extensive computational efforts involved in evaluating reliability of systems consisting of a large number of components. These systems have been studied in depth by many researchers such as Lisnianski and Levitin [15], Barlow and Wu [16], Murchland [17], and El-Neveihi et al. [18]. Ramirez-Marquez and Coit [19] proposed a heuristic method to solve the RAP with different failure states. In their model, the components and sub-systems not only could work in two working and failed states, but also the system could assume any intermediate state.
While the binary-state system reliability can be obtained using the basic mathematical and statistical relations, most of the research works in MSS reliability problem focus on optimizing the level of a unique system redundancy [15]. As an alternative, Ushakov [20] introduced the universal generation function (UGF) approach for the first time. UGF is known as an appropriate method for calculating the reliability and availability of multi-state systems. This method incredibly decreases the number of system state evaluations and makes the system reliability and availability computations easier [21]. Besides, more application of UGF are given in Gnedenko and Ushakov [22], Ushakov [23], and Lisnianski [24]. Lisnianski et al. [25] utilized UGF to evaluate the reliability of a MSS containing serial, parallel, and series-parallel sub-systems. Ding and Lisnianski [21] showed that the output probability distribution for the entire MSS could be determined by UGF. Kuo and Wan [26] discussed an optimal reliability design in which UGF was employed as the main method in appraising multi-state systems reliability evaluation. Li and Zuo [27] proposed a recursive method to solve MSS reliability problems and compared their method with UGF. Tian et al. [28] worked on a joint redundancy-reliability optimization
method for solving series-parallel RAP. They showed that using technical and organizational activities is an appropriate approach to improve system reliability. These activities improve failure and repair rate of components. Besides, UGF has been employed in RAP of k-out-of-n systems many times (see for example [15], [28], and Ouzineb et al. [29]).
One of the main objections about UGF is its high computational time to evaluate system reliability or availability. In order to resolve this objection, Pourkarim Guilani et al. [30] presented a new method for reliability evaluation of non-repairable three-state systems using a Markovian model. They showed their method was more efficient that the UGF approach.
In this paper, a RAP model is presented to optimize reliability of series-parallel systems, in which the components of the subsystems are assumed to have three performance rates. In this approach, differential equations are used to model the reliability of the sub-systems, where these equations are solved using a GA. Moreover, in order to improve reliability of the system under investigation, technical as well as organizational activities are considered.
The proposed modeling comes in section 2. Section 3 deals with solving the problem. A numerical example is presented in section 4, and finally conclusion and further studies come in section 5.
2. SYSTEM DEFINITION
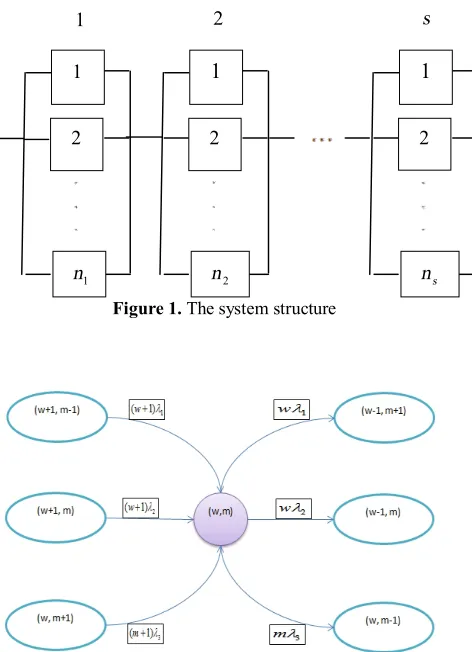
In order to present the Markovian approach used to model a three-state series-parallel system, consider the following descriptions that is adapted from the literature [30]. Let a system to have some sub-systems, each with some components. The system is configured as series-parallel, where its structure is demonstrated in Figure 1. Let a component of a sub-system have one of the following states at any time:
• Working perfectly (100% performance)
• Semi working (50% performance)
• Not-working or failed.
Note that as all the components of a sub-system are configured parallel, the sub-system works until all of its components fail. Moreover, the components, indexed by
i
, are assumed non-repairable with constant failure rates (CFR) of:1
i
l : Moving from 100 to 50% working performance,
2
i
l : Moving from 100 to 0% working performance,
3
i
components work with full performance and one with semi performance, then the sub-system scores 5 points. Thus, the possible points the
i
thsub-system with components receives are:(
2n , ni 2 i-1 2, ni-2, , , ,K 2 1 0)
(1)Moreover, as a sub-system with a full performance component and another sub-system with three semi-performance components both receive 5 points, the notation
(
w
,m
)
is used to represent a sub-system withw
full-performance andm
semi-performancecomponents. Consequently, if the performance point of a sub-system is
k
, thenk
can take any values of0,1, 2, , 2 i 1, 2 i
k = K n - n . Furthermore, the number of
states can be obtained by:
2w m k ; k 0,1, 2, , 2ni 1, 2ni
w ++m£=n = K - (2)
2. 1. State Space Diagram and Differential Equations The state space of a sub-system denoted by
{
(
w,m)
; w,m<n}
is shown in Figure 2.Figure 1. The system structure
Figure 2. State space diagram of a sub-system [30]
Figure 3. Space state diagram of the example [30]
Then, based on Figure 2, the differential equation becomes:
( ) ( ) ( )
( ) ( ) ( )
( ) ( ) ( ) ( ) ( ) ( )
1 2
,0 ,0
1 2 3
, ,
1 1, 1 2 1, 3 , 1
0 : , 0
(3)
: ,
1 1 1
n n
w m w m
w m w m w m
P n n P w n m
P w w m P
w m n
w P w P m P
l l l l l
l + - l + l +
¢ + + = = =
ì
ï ¢ + + + =
í <
ï + + + + +
î
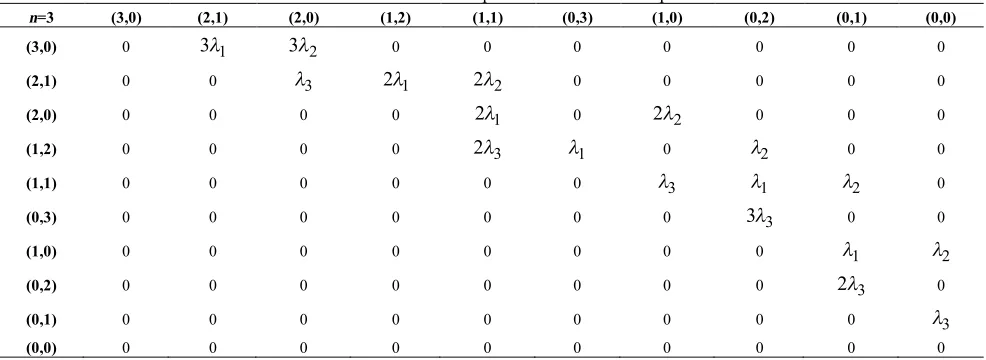
To make the equations easier to solve, a matrix model is proposed to use. The cell in the ithrow and jthcolumn of this matrix shows the transition probability of the sub-system from state ito state j . As an example, consider a sub-system with 3 identical components. Based on Equation (2), the number of states for this sub-system is obtained as:
2 0 1 2 6
3
w m k ; k , , , ,
w m
+ = =
+ £
K (4)
Equation (4) can be decomposed to seven equations as follows:
{
2 6}
( ) ( ){ }6 w m 3 , 3,0
k= Þw m++ £= Þw m =
{
2 5}
( ) ( ){ }5 w m 3 , 2,1
k= Þ w m++ £= Þw m =
{
2 4}
( ) ( ) ( ){ }4 w m 3 , 2, 0 , 1, 2
k= Þw m++ £= Þ w m =
{
2 3}
( ) ( ) ( ){
}
3 w m 3 , 0,3 , 1,1
k= Þw m++ £= Þ w m =
{
2 2}
( ) ( ) ( ){ }2 w m 3 , 1,0 , 0, 2
k= Þ w++m£= Þ w m =
{
2 1}
( ) ( ){ }1 w m 3 , 0,1
k= Þw m++ £= Þ w m =
{
2 0}
( ) ( ){ }0 w m 3 , 0, 0
k= Þw++m£= Þ w m =
(5)
As a result, the reliabilities of sub-systems denoted by
(
w,m)
with possible number of components, R(w m, ),shown in Equation (6) must be calculated:
(w m, ) {( ) ( ) ( ) ( ) ( ) ( ) ( ) ( ) ( ) ( )0, 0 , 0,1 , 0, 2 , 0,3 , 1,0 , 1,1 , 1, 2 , 2, 0 , 2,1 , 3, 0}
R = (6)
Then, the space-state diagram and the matrix representation of this sub-system is presented in Figure 3 and Table 1, respectively.
2 1
1 n
2
1
2 n
2
1
s n
After solving the system of equations and obtaining the transition probabilities, the reliability of sub-system i is calculated using:
( )
( )( )
( ) [ , ] ( )
,
, W S 0 , 0
i w s
w s R
R t P t
Î
-=
å
(7)In Equation (7) we note that as the components are non-repairable all the states in the proposed Markov chain are transient, except (0,0). Thus, in steady-state
0 0 1
( , )
P = and P( w ,s ) =0 for all other sates.
2. 2. Technical and Organizational Activities Technical and organizational activities such as maintenance programs and system monitoring are supportive actions considered in this paper to reduce failure rates of the components and consequently to improve system reliability. Assuming 0<ahij <1the
effective value of the technical activity h taken place on the component type j of sub-system i with a failure rate of lijand letting TAhito be 1 if the activity is performed and 0 otherwise, Equation (8) is used to present the reducing value of the failure rate '
ij
l :
' . ; ,
ij ij TAhi hi ij h i
l =l - a l " (8)
Similarly, if 0<bfij <1 is the effective value of the
organizational activity f on the component type j of sub-system i with a failure rate of lijand OAfiis 1 if the activity is performed and 0 otherwise, Equation (9) is used to present the reducing value of the failure rate '
ij
l
' . . ; ,
ij ij OAfi fij ij i f
l =l - b l " (9)
Interested readers are referred to Tian et al. [28] for more details on the effects of these activities.
2. 3. Mathematical Formulation The following notations are used to model the redundancy allocation problem at hand.
i :An index used for a sub-system, i =1 2, ,...,s
s :Number of sub-systems in the system under consideration
i
n :Number of components in sub-system i ,
1 2
i max
n = , ,...,n
R :The system reliability
( )
i
R t :Reliability of sub-system iat time t i
c :Cost of a redundant component in sub-system i
Max
C :Maximum system cost (available budget) i :
q The parameter associated with internal connection cost of a component in sub-system i , the sub-system internal connection cost is assumed
( )
i i n
e q (see Wang et al. [31])
hi
VCTA :Variable cost of technical activity h performed
on a component of sub-system i ; h=1 2, ,..., Hi
hi
CCTA :Constant cost of technical activity h performed
on a component of sub-system i
i
H :Number of available technical activities on a
component of sub-system i
fi
COA :Cost of the organizational activity type
f performed on the components of sub-system i , f =1 2, ,...,Fi
i
F :Number of available organizational activities on the
components of sub-system i
ij:
l Failure rate of type j for the components of sub-system i
' ij:
l Improved failure rate of type j for the components
of sub-system iobtained using technical and organizational activity
TABLE 1. The matrix representation of the example
n=3 (3,0) (2,1) (2,0) (1,2) (1,1) (0,3) (1,0) (0,2) (0,1) (0,0)
(3,0) 0 3l1 3l2 0 0 0 0 0 0 0
(2,1) 0 0 l3 2l1 2l2 0 0 0 0 0
(2,0) 0 0 0 0 2l1 0 2l2 0 0 0
(1,2) 0 0 0 0 2l3 l1 0 l2 0 0
(1,1) 0 0 0 0 0 0 l3 l1 l2 0
(0,3) 0 0 0 0 0 0 0 3l3 0 0
(1,0) 0 0 0 0 0 0 0 0 l1 l2
(0,2) 0 0 0 0 0 0 0 0 2l3 0
(0,1) 0 0 0 0 0 0 0 0 0 l3
hi
TA :A binary variable taking 1 if technical activity type h is taken place for the components of sub-system i , otherwise 0
fi
OA :A binary variable taking 1 if organizational activity type f is performed on the components of sub-system i , otherwise 0
:
hij
a The effective value of the technical activity h
taken place on the component type j of sub-system i , 0<ah ij <1
fij :
b The effective value of the organizational activity
f on the component type j of sub-system
i, 0<bfij <1
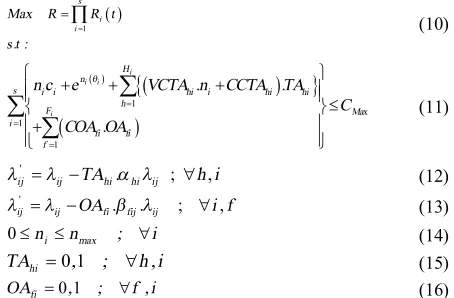
Based on the above notations, the mathematical formulation of RAP at hand becomes:
( ) 1
s
i i
Max R R t
s.t :
=
=Õ
(10)
( )
{
( )}
( )
1
1
1
. .
.
i i i
i
H n
s i i hi i hi hi
h
F Max
i
fi fi
f
n c e VCTA n CCTA TA
C COA OA
q
= =
=
ì + + + ü
ï ï
ï ï £
í ý
ï+ ï
ï ï
î þ
å
å
å
(11)' . ; ,
ij ij TAhi hi ij h i
l =l - a l " (12)
' . . ; ,
ij ij OAfi fij ij i f
l =l - b l " (13)
0£ni £nmax ; "i (14)
0 1
hi
TA = , ; "h ,i (15)
0 1
fi
OA = , ; "f ,i (16)
The objective function in Equation (10) that is to be maximized, is the system reliability obtained by the product of serial sub-systems' reliabilities at time t . Note that the reliability of a sub-system derived in Section 2.1 is a function of the number and the type of its redundant components. The constraint in Inequality (11) shows that the total cost of the system including cost of redundant components, internal connection cost, and technical and organizational activity costs, cannot be bigger than the available budget CMax. Equations (12) and (13) show the improvement of the component failure rates after activating technical and organizational activities.
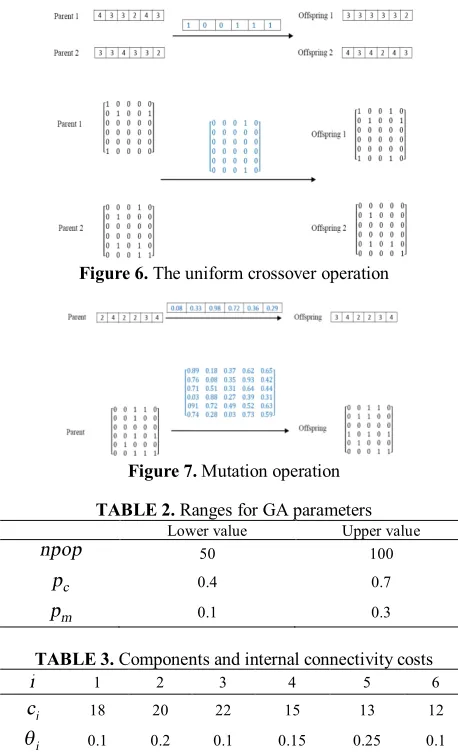
Figure 4. Chromosome structure of sub-system components
Figure 5. Chromosome structure of technical and organizational activities
The number of components in a sub-system is bounded in Inequality (14), and the Equations (15) and (16) define the type of the variable being used. In the next section, a solution procedure is proposed for the NP-hard problem at hand.
3. SOLVING METHOD
As the problem belongs to the class of NP-hard problems, similar to other works introduced in Section 1, the meta-heuristic algorithm of GA is used to solve it.
3. 1. Genetic Algorithm As GA is a popular meta-heuristic to solve many complicated optimization problem such as RAP, it is utilized in this paper with two special structures for chromosomes denoted by
s
n
1´ and ks´(H F+ ) matrices. The first chromosome contains the number of components in each sub-system and the second shows the technical and organizational activities, where all the elements ink
s´(H+F) matrix are binary. A value of 1 in this matrix denotes that a technical or organizational activity is performed and 0 indicates the activity is not employed. Figures 4 and 5 show these chromosomes. As an example, consider four different types of technical and one type of organizational activity available for three sub-systems and their components. Then, the first four columns of thek
3´5 matrix presented in Figure 5 correspond to whether the technical activities are performed on the three subsystems (denoted by 1s) or not (denoted by zeros), and the last column is related to the organizational activity. Note that each row of this matrix corresponds to a sub-system. The "1" in the third row and the second column of the following matrix means technical activity type-2 is performed on the components of sub-system 3. Note that as the other elements all are zero, no other activities are performed.3 5
0 0 0 0 0
0 0 0 0 0
0 1 0 0 0
k´
é ù
ê ú
= ê ú
ê ú
ë û
of operator is presented in the work by Gen and Cheng [32] and [14]. Figure 6 demonstrates this operation.
3. 3. Mutation Operator For the mutation operation of a gene in a chromosome, a real random variable is first produced. If this variable is less than the mutation rate of 0.1, then the gene mutates randomly (see [14]). The mutation operation is illustrated in Figure 7.
3. 4. Initial Condition The required initial information to start GA is:
1. Population size
(
npop)
is the number of chromosomes that are kept in each generation.2. Crossover rate
( )
Pc is the probability of performing a crossover.3. Mutation rate
( )
Pm is the probability of performing mutation.4. A collection of feasible chromosomes is randomly generated as the initial population. Note that feasible chromosomes are the ones that satisfy constraints of the model, especially the constraints (11) and (14).
3. 5. Chromosome Evaluation In GA, as soon as a chromosome is generated, a fitness value must be assigned to it. The fitness in this research is the system reliability shown in (10). Since there are some constraints in the model of the problem, some generated chromosomes may not be feasible. The most popular approach in GA to handle infeasibility is to use penalty functions that penalize infeasible solutions by reducing their fitness values in proportion to their degree of constraint violation [32]. In this research, we use the penalty function approach. If a constraint is satisfied then its penalty is set to zero. Otherwise, the penalty assumes a big non-zero value.
3. 6. Stopping Criterion The final step in the GA methodology is to check if the method has found a solution that is good enough to meet the user’s expectations. Stopping criteria is a set of conditions such that when satisfied, a good solution is obtained. In this research, stopping criterion is defined as the number of generations. When the algorithm reaches a predefined number of generations, the algorithm will be stopped. As the parameters of a meta-heuristic play important roles, in order to find better-quality near-optimum solutions their values are calibrated using response surface methodology.
3. 7. Response Surface Methodology Response surface methodology is a set of useful statistical and mathematical techniques for expansion, improvement, and optimization of a process. The input variables are
called independent variables and the output of the process is the response. Response surfacemethodology combines design of the experiments, regression techniques, and optimization method to adjust the independent variables in order to achieve the best response. In order to tune the parameters of the GA, i.e. the population size(npop), the crossover rate ( )Pc , and
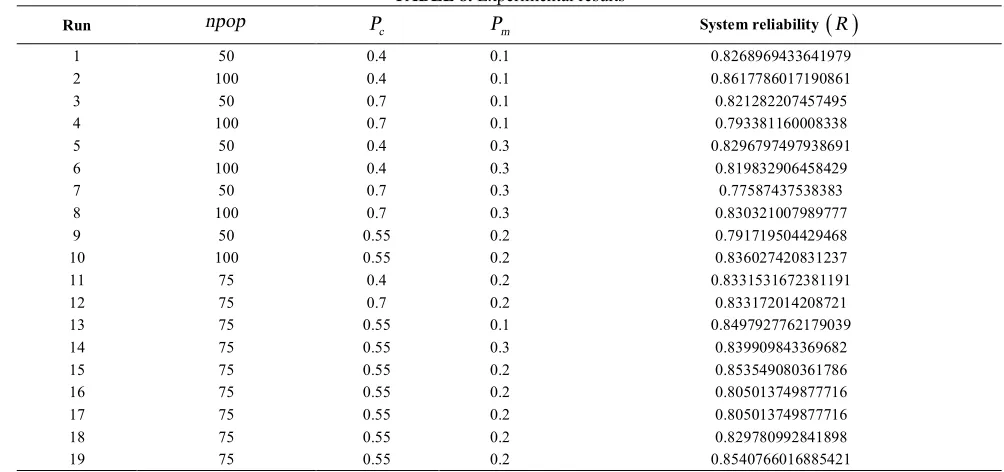
the mutation rate ( )Pm , two levels for each parameter is considered in a 23 factorial design. Besides, in order to investigate the curvature in the response surface, 5 experiments are performed at the center point of the design. In addition, to better estimate the response function 6 pivot points are amended. Thus 19 experiments are performed, in each of which the stopping condition of the algorithm is set 100 iterations. The values of the parameters that maximize the system reliability are selected at the end. The ranges of the input variables are presented in Table 2. In the next section, a numerical example is given to demonstrate the parameter calibration process.
Figure 6. The uniform crossover operation
Figure 7. Mutation operation
TABLE 2. Ranges for GA parameters
Lower value Upper value
npop 50 100
c
p 0.4 0.7
m
p 0.1 0.3
TABLE 3. Components and internal connectivity costs
i 1 2 3 4 5 6
i
c 18 20 22 15 13 12
i
TABLE 4. Variable technical costs and cost of organizational activities
i VCTA1i VCTA2i VCTA3i VCTA4i COA1i
1 5 3 4 2 11
2 4 5 6 3 12
3 2 1 1 3 15
4 5 5 3 2 19
5 2 2 3 3 20
6 6 1 3 3 25
TABLE 5. Constant cost of technical activities
i CCTA1i CCTA2i CCTA3i CCTA4i
1 2 2 1 1
2 1 1 2 2
3 2 2 3 1
4 2 2 3 3
5 4 4 3 5
6 2 2 1 3
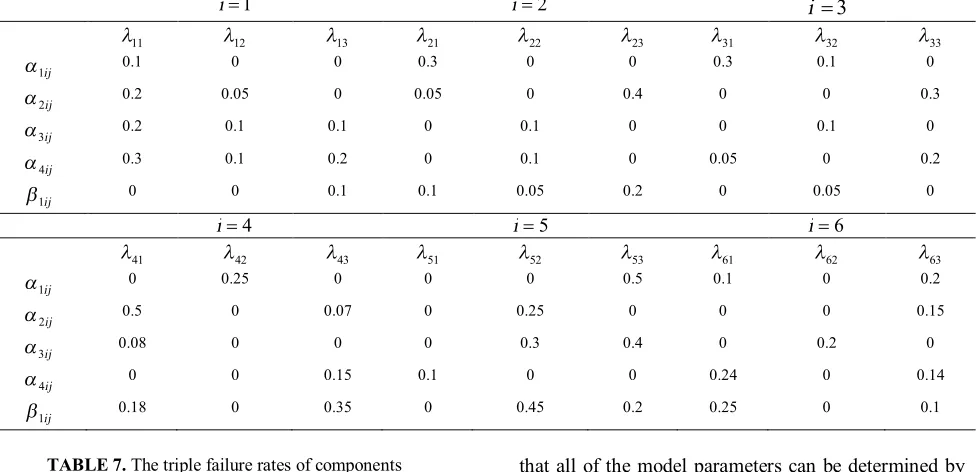
TABLE 6. Effects of technical and organizational activities on sub-systems and their components
1
=
i i=2 i =3
11
l l12 l13 l21 l22 l23 l31 l32 l33
ij
1
a 0.1 0 0 0.3 0 0 0.3 0.1 0
ij
2
a 0.2 0.05 0 0.05 0 0.4 0 0 0.3
ij
3
a 0.2 0.1 0.1 0 0.1 0 0 0.1 0
ij
4
a 0.3 0.1 0.2 0 0.1 0 0.05 0 0.2
ij
1
b 0 0 0.1 0.1 0.05 0.2 0 0.05 0
4
=
i i=5 i=6
41
l l42 l43 l51 l52 l53 l61 l62 l63
ij
1
a 0 0.25 0 0 0 0.5 0.1 0 0.2
ij
2
a 0.5 0 0.07 0 0.25 0 0 0 0.15
ij
3
a 0.08 0 0 0 0.3 0.4 0 0.2 0
ij
4
a 0 0 0.15 0.1 0 0 0.24 0 0.14
ij
1
b 0.18 0 0.35 0 0.45 0.2 0.25 0 0.1
TABLE 7. The triple failure rates of components
i li1 li2 li3
1 0.008 0.0040 0.0060
2 0.006 0.0030 0.0050
3 0.009 0.0045 0.0055
4 0.009 0.0050 0.0070
5 0.005 0.0020 0.0040
6 0.007 0.0020 0.0040
4. NUMERICAL EXAMPLE
Consider a system with 6 sub-systems connected serially. The component costs and the internal connectivity costs are presented in Table 3. Moreover, 4 different types of technical and one organizational activity are available. The costs of these activities are shown in Tables 4 and 5, respectively. Table 6 contains the effects of technical and organizational activities on the performance of the sub-systems and their components. The triple failure rates of the components are shown in Table 7. Moreover, the maximum available cost
(
CMAx)
is considered 350 such that the problem has a solution space. Besides, this value has been chosen based on other model parameters. Notethat all of the model parameters can be determined by the decision maker. The 19 experiments mentioned above, each with different combinations of the parameters were performed using the GA on the Minitab-16 software. The input parameters and the results of these runs are presented in Table 8. The maximum CPU time of running the program is considered 200 seconds. The RSM and the ANOVA results are shown in Tables 9 and 10, respectively. Moreover, the best combination of the parameters are
100
npop= , Pm =01. , and Pc =0 4. . Using these values, the near-optimum solution of the problem is
[
]
1 6 3 3 3 4 3 3
n´ = ,
( )
5 5
0 0 0 1 0 0 0 0 0 0 0 1 1 0 0
100 0 861778601719086 0 0 0 0 0
0 0 0 0 0 0 0 1 0 0
k´ , R .
é ù
ê ú
ê ú
ê ú
=ê ú =
ê ú
ê ú
ê ú
ê ú
ë û
with the
155 255737
Time= . Seconds.
them. The exact number of feasible and infeasible solutions is obtained using Equation (17):
( )
max
(n )s´2s´H F+ (17)
Thus, for systems with 2 and 3 sub-systems, the total number of solutions are 16,384 and 2,097,152, respectively. It can be easily seen that as the number of subsystems increases, the number of solutions to investigate increases exponentially. The input data for the system with 2 sub-systems is the same as the one for the first two sub-systems shown in Tables 3-7. For the system with 3 sub-systems, the data of the first three sub-systems are considered. The maximum available costs for these two problems are set 100 and 150, respectively. The best solutions of the GA and the exact enumeration method with their running times using MATLAB 10 are shown Table 11. Moreover, the optimal solutions obtained using both methods are:
[ ]
1 2 2 5
0 0 0 1 0 2 2
0 1 0 0 0
n´ ; k´
é ù
= = ê ú
ë û
[ ]
1 3 3 5
0 0 0 0 0
3 2 2 0 0 0 0 0
0 1 0 0 0
n´ ; k´
é ù
ê ú
= = ê ú
ê ú
ë û
The results in Table 11 show that both methods provide exact system reliabilities for the two problems under investigation. It means GA was able to find the optimal solutions obtained using the exact method. Note that the solving time of the enumeration method increases rapidly by increasing number of sub-systems. For a system with 6 sub-systems, the number of feasible and infeasible solutions are more than
24
115 10. ´ and the enumeration method is not able to solve the problem even in 172,800 seconds (2 days running time). Hence, the use of a meta-heuristic is justified.
TABLE 8. Experimental results
System reliability
( )
Rm P c P npop Run 0.8268969433641979 0.1 0.4 50 1 0.8617786017190861 0.1 0.4 100 2 0.821282207457495 0.1 0.7 50 3 0.793381160008338 0.1 0.7 100 4 0.8296797497938691 0.3 0.4 50 5 0.819832906458429 0.3 0.4 100 6 0.77587437538383 0.3 0.7 50 7 0.830321007989777 0.3 0.7 100 8 0.791719504429468 0.2 0.55 50 9 0.836027420831237 0.2 0.55 100 10 0.8331531672381191 0.2 0.4 75 11 0.833172014208721 0.2 0.7 75 12 0.8497927762179039 0.1 0.55 75 13 0.839909843369682 0.3 0.55 75 14 0.853549080361786 0.2 0.55 75 15 0.805013749877716 0.2 0.55 75 16 0.805013749877716 0.2 0.55 75 17 0.829780992841898 0.2 0.55 75 18 0.8540766016885421 0.2 0.55 75 19
TABLE 9: Response surface regression: R(t) versus npop, Pm, Pc
P-value T SE coef. Coef. Term 0.275 1.161 0.25394 0.29486 Constant 0.580 0.574 0.00472 0.00271 npop 0.434 0.818 0.92598 0.75786 Pc 0.317 1.060 0.88859 0.94154 Pm 0.309 -1.079 0.00003 -0.00003 npop*npop 0.577 -0.578 0.80717 -0.46687 Pc*Pc 0.657 -0.460 1.81614 -0.83510 Pm*Pm 0.493 0.714 0.00283 0.00202 npop*Pc 0.197 1.394 0.00425 0.00592 npop*Pm 0.053 -.2.228 0.70760 -1.57654 Pc*Pm
PRESS = 0.113630 S = 0.0300207
R-Sq(adj) = 36.16% R-Sq(pred) = 0.00%
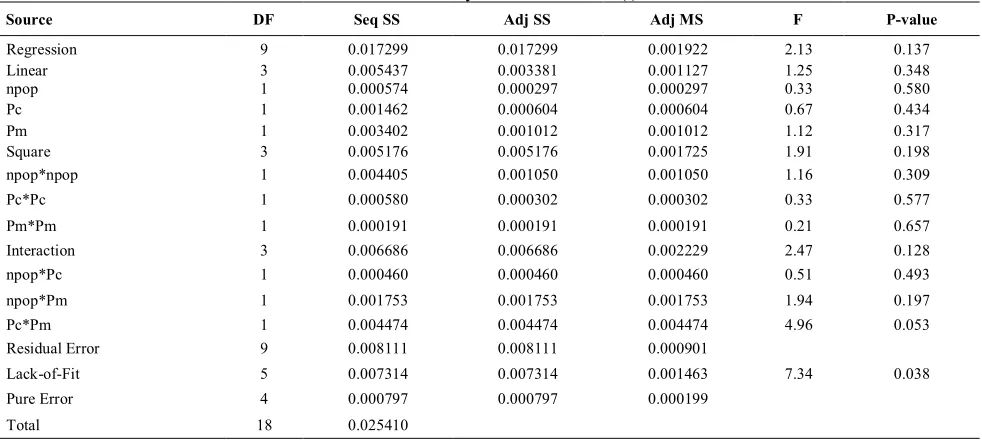
TABLE 10. Analysis of variance for R(t) P-value F Adj MS Adj SS Seq SS DF Source 0.137 2.13 0.001922 0.017299 0.017299 9 Regression 0.348 1.25 0.001127 0.003381 0.005437 3 Linear 0.580 0.33 0.000297 0.000297 0.000574 1 npop 0.434 0.67 0.000604 0.000604 0.001462 1 Pc 0.317 1.12 0.001012 0.001012 0.003402 1 Pm 0.198 1.91 0.001725 0.005176 0.005176 3 Square 0.309 1.16 0.001050 0.001050 0.004405 1 npop*npop 0.577 0.33 0.000302 0.000302 0.000580 1 Pc*Pc 0.657 0.21 0.000191 0.000191 0.000191 1 Pm*Pm 0.128 2.47 0.002229 0.006686 0.006686 3 Interaction 0.493 0.51 0.000460 0.000460 0.000460 1 npop*Pc 0.197 1.94 0.001753 0.001753 0.001753 1 npop*Pm 0.053 4.96 0.004474 0.004474 0.004474 1 Pc*Pm 0.000901 0.008111 0.008111 9 Residual Error 0.038 7.34 0.001463 0.007314 0.007314 5 Lack-of-Fit 0.000199 0.000797 0.000797 4 Pure Error 0.025410 18 Total
TABLE 11. The best solutions and the running times of GA and the exact enumeration method
3 = i 2 = i Time (seconds) R Time (seconds) R 3955.661914 0.762999264223081 48.283402 0.836619040292915 Enumeration algorithm 92.145760 0.762999264223081 75.078759 0.836619040292915 Genetic algorithm
5. CONCLUSION AND FURTHUR STUDIES
In this paper, the redundancy allocation problem of a series-parallel system with three-state failure rates for its components along with technical and organizational activities that can improve the performances of the sub-systems and their components was investigated. As RAP belongs to the class of NP-hard problems, a GA was utilized to solve the problem. The parameters of GA was calibrated using RSM to achieve better solutions. The results of employing the parameter-tuned GA on two instances of small size showed that it was quite capable to find the optimal solution. Another instance of a larger size was used to illustrate the application of the proposed methodology.
For future research in this area, we recommend considering repairable multiple-type components. Moreover, a fuzzy approach to model involved uncertainties can be another topic for future research. In addition, some other assumptions can be added to the problem to draw it closer to real situations.
6. REFERENCE
1. Fyffe, D.E., Hines, W.W. and Lee, N.K., "System reliability allocation and a computational algorithm", Reliability, IEEE
Transactions on, Vol. 17, No. 2, (1968), 64-69.
2. Nakagawa, Y. and Miyazaki, S., "Surrogate constraints algorithm for reliability optimization problems with two constraints", Reliability, IEEE Transactions on, Vol. 30, No. 2, (1981), 175-180.
3. Bulfin, R.L. and Liu, C.Y., "Optimal allocation of redundant components for large systems", Reliability, IEEE Transactions on, Vol. 34, No. 3, (1985), 241-247.
4. Misra, K. and Sharma, J., "Reliability optimization of a system by zero-one programming", Microelectronics Reliability, Vol. 12, No. 3, (1973), 229-233.
5. Chern, M.-S., "On the computational complexity of reliability redundancy allocation in a series system", Operations Research
Letters, Vol. 11, No. 5, (1992), 309-315.
6. Coit, D.W. and Smith, A.E., "Optimization approaches to the redundancy allocation problem for series-parallel systems", in Fourth Industrial Engineering Research Conference Proceedings, Citeseer., (1995), 342-349.
7. Coit, D.W. and Smith, A.E., "Stochastic formulations of the redundancy allocation problem", in Proceedings of the Fifth Industrial Engineering Research Conference., (1996), 459-463. 8. Ida, K., Gen, M. and Yokota, T., "System reliability
optimization with several failure model by genetic algorithm", in Proceeding of the 16th International Engineering Conference, Ashikaga, Japan, (1994).
9. Yokota, T., Gen, M. and Ida, K., "System reliability optimization problems with several failure modes by genetic algorithm", Japanese Journal of Fuzzy Theory and
Systems.(USA), Vol. 7, No. 1, (1995), 119-132.
10. Coit, D.W. and Smith, A.E., "Reliability optimization of series-parallel systems using a genetic algorithm", Reliability, IEEE
Transactions on, Vol. 45, No. 2, (1996), 254-260, 266.
11. Coit, D.W. and Smith, A.E., "Penalty guided genetic search for reliability design optimization", Computers & Industrial
12. Coit, D.W. and LIU, J.C., "System reliability optimization with k-out-of-n subsystems", International Journal of Reliability,
Quality and Safety Engineering, Vol. 7, No. 02, (2000),
129-142.
13. Coit, D.W., "Maximization of system reliability with a choice of redundancy strategies", IIE transactions, Vol. 35, No. 6, (2003), 535-543.
14. Tavakkoli-Moghaddam, R., Safari, J. and Sassani, F., "Reliability optimization of series-parallel systems with a choice of redundancy strategies using a genetic algorithm",
Reliability Engineering & System Safety, Vol. 93, No. 4,
(2008), 550-556.
15. Lisnianski, A. and Levitin, G., "Multi-state system reliability: Assessment, optimization and applications, World scientific, (2003).
16. Barlow, R.E. and Wu, A.S., "Coherent systems with multi-state components", Mathematics of Operations Research, Vol. 3, No. 4, (1978), 275-281.
17. Murchland, J., Fundamental concepts and relations for reliability analysis of multi-state systems, in Reliability and fault tree analysis., (1975).
18. El-Neweihi, E., Proschan, F. and Sethuraman, J., "Multistate coherent systems", Journal of Applied Probability, (1978), 675-688.
19. Ramirez-Marquez, J.E. and Coit, D.W., "A heuristic for solving the redundancy allocation problem for multi-state series-parallel systems", Reliability Engineering & System Safety, Vol. 83, No. 3, (2004), 341-349.
20. Ushakov, I., "A universal generating function", Soviet Journal
of Computer and Systems Sciences, Vol. 24, No. 5, (1986),
118-129.
21. Ding, Y. and Lisnianski, A., "Fuzzy universal generating functions for multi-state system reliability assessment", Fuzzy
Sets and Systems, Vol. 159, No. 3, (2008), 307-324.
22. Gnedenko, B. and Ushakov, I.A., "Probabilistic reliability engineering, John Wiley & Sons, (1995).
23. Ushakov, I., "The method of generalized generating sequences", European Journal of Operational Research, Vol. 125, No. 2, (2000), 316-323.
24. Lisnianski, A., "Estimation of boundary points for continuum-state system reliability measures", Reliability Engineering &
System Safety, Vol. 74, No. 1, (2001), 81-88.
25. Lisnianski, A., Levitin, G., Ben-Haim, H. and Elmakis, D., "Power system structure optimization subject to reliability constraints", Electric Power Systems Research, Vol. 39, No. 2, (1996), 145-152.
26. Kuo, W. and Wan, R., Recent advances in optimal reliability allocation, IEEE Transactions on Systems, Man, and
Cybernetics, Part A: Systems Humans, Vol. 37, (2007),.
143-156.
27. Li, W. and Zuo, M.J., "Reliability evaluation of multi-state weighted k-out-of-n systems", Reliability Engineering &
System Safety, Vol. 93, No. 1, (2008), 160-167.
28. Tian, Z., Levitin, G. and Zuo, M.J., "A joint reliability– redundancy optimization approach for multi-state series– parallel systems", Reliability Engineering & System Safety, Vol. 94, No. 10, (2009), 1568-1576.
29. Ouzineb, M., Nourelfath, M. and Gendreau, M., "Tabu search for the redundancy allocation problem of homogenous series– parallel multi-state systems", Reliability Engineering & System
Safety, Vol. 93, No. 8, (2008), 1257-1272.
30. Pourkarim Guilani, P., Sharifi, M., Niaki, S. and Zaretalab, A., "Reliability evaluation of non-reparable three-state systems using markov model and its comparison with the ugf and the recursive methods", Reliability Engineering & System Safety, Vol. 129, (2014), 29-35.
31. Wang, Z., Chen, T., Tang, K. and Yao, X., "A multi-objective approach to redundancy allocation problem in parallel-series systems", in Evolutionary Computation., CEC'09. IEEE Congress on, (2009), 582-589.
32. Gen, M. and Cheng, R., "Genetic algorithms and engineering design", (1997), John Wily and Sons, New York.
Redundancy Allocation Problem of a System with Three-state Components: A
Genetic Algorithm
P. Pourkarim Guilania, M. Sharifia, S.T.A. Niaki b, A. Zaretalaba
a Faculty of Industrial and Mechanical Engineering, Islamic Azad University, Qazvin Branch, Qazvin, Iran b Department of Industrial Engineering, Sharif University of Technology, Tehran, Iran
P A P E R I N F O
Paper history: Received 06 April 2014
Received in revised form 21 May 2014 Accepted 26 June 2014
Keywords: Reliability Multi-state Systems
Redundancy Allocation Problem Three-state Components Genetic Algorithm
هﺪﯿﮑﭼ
ﻪﻨﯿﻬﺑرد ﺪﯿﻔﻣ وﻢﻬﻣﻞﺋﺎﺴﻣ زا ﯽﮑﯾ دازﺎﻣياﺰﺟا ﺺﯿﺼﺨﺗ ﮥﻠﺌﺴﻣ ﺎﺻﻮﺼﺨﻣ ،ﺎﻬﻤﺘﺴﯿﺳ يزﺎﺳ
" ،ﯽﮑﯾﺮﺘﮑﻟايﺎﻬﻤﺘﺴﯿﺳرد
ﺖﺳاﯽﮑﯿﻧﺎﮑﻣو،ﯽﮑﯿﻧوﺮﺘﮑﻟا .
ﺖﺳاﻪﻨﯾﺰﻫﻞﻗاﺪﺣﺎﺑﻢﺘﺴﯿﺳﯽﯾﺎﯾﺎﭘندﺮﮐﻪﻨﯿﺸﯿﺑﻪﻠﺌﺴﻣﻦﯾافﺪﻫ .
يدﺎﯾزيﺎﻬﺸﻫوﮋﭘلﺎﺣﻪﺑﺎﺗ
ﻣزﻦﯾارد ﺪﺷﺎﺑﻪﺘﺷادﯽﻌﻗاويﺎﯿﻧدرديﺮﺘﺸﯿﺑدﺮﺑرﺎﮐﻪﻠﺌﺴﻣﻦﯾاﺎﺗهﺪﺷمﺎﺠﻧاﻪﻨﯿ .
يﺎﻬﻟﺪﻣردﻢﺘﺴﯿﺳياﺰﺟاﺖﻟﺎﺣﻪﮐﯽﻟﺎﺣرد
ﯽﻣضﺮﻓباﺮﺧوﻢﻟﺎﺳﮏﯿﺳﻼﮐ ﯽﻣضﺮﻓﻪﻟﺎﻘﻣﻦﯾارد،دﻮﺷ
يﺮﺳيﺎﻬﻤﺘﺴﯿﺳﺮﯾزةﺪﻨﻫدﻞﯿﮑﺸﺗيزاﻮﻣياﺰﺟاﺖﻟﺎﺣﻪﮐدﻮﺷ
ﯽﻨﯿﻌﻣدﺮﮑﻠﻤﻋخﺮﻧﺎﺑﮏﯾﺮﻫ،باﺮﺧو،راﺪﻤﯿﻧ،ﻢﻟﺎﺳ ﺪﺷﺎﺑ
. ﯽﻣﯽﻧﺎﻣزﺎﺳوﯽﻨﻓيﺎﻬﺘﯿﻟﺎﻌﻓﻪﮐﺖﺳاﻦﯾاﺮﺑضﺮﻓ،هوﻼﻋﻪﺑ ﺪﻨﻧاﻮﺗ
ادﺮﮑﻠﻤﻋدﻮﺒﻬﺑﺚﻋﺎﺑ ﺟ
ﺪﻨﺷﺎﺑﺎﻬﻤﺘﯿﺳﺮﯾزﻪﺠﯿﺘﻧردواﺰ .
ﻞﺋﺎﺴﻣةﺮﻣزرددازﺎﻣياﺰﺟاﺺﯿﺼﺨﺗﮥﻠﺌﺴﻣنﻮﭼ NP-Hard
راﺮﻗ
ﺖﺳاهﺪﺷهدﺎﻔﺘﺳاﻞﺣياﺮﺑﮏﯿﺘﻧژﻢﺘﯾرﻮﮕﻟاﮏﯾزا،دراد .