University of Kentucky University of Kentucky
UKnowledge
UKnowledge
University of Kentucky Doctoral Dissertations Graduate School
2006
THE GAP BETWEEN WHAT TAXPAYERS WANT AND WHAT TAX
THE GAP BETWEEN WHAT TAXPAYERS WANT AND WHAT TAX
PROFESSIONALS THINK THEY WANT: A REEXAMINATION OF
PROFESSIONALS THINK THEY WANT: A REEXAMINATION OF
CLIENT EXPECTATIONS AND TAX PROFESSIONAL
CLIENT EXPECTATIONS AND TAX PROFESSIONAL
AGGRESSIVENESS
AGGRESSIVENESS
Teresa StephensonUniversity of Kentucky, [email protected]
Right click to open a feedback form in a new tab to let us know how this document benefits you. Right click to open a feedback form in a new tab to let us know how this document benefits you.
Recommended Citation Recommended Citation
Stephenson, Teresa, "THE GAP BETWEEN WHAT TAXPAYERS WANT AND WHAT TAX PROFESSIONALS THINK THEY WANT: A REEXAMINATION OF CLIENT EXPECTATIONS AND TAX PROFESSIONAL
AGGRESSIVENESS" (2006). University of Kentucky Doctoral Dissertations. 278. https://uknowledge.uky.edu/gradschool_diss/278
ABSTRACT OF DISSERTATION
Teresa Stephenson
The Graduate School
University of Kentucky
THE GAP BETWEEN WHAT TAXPAYERS WANT AND WHAT
TAX PROFESSIONALS THINK THEY WANT: A
REEXAMINATION OF CLIENT EXPECTATIONS AND TAX
PROFESSIONAL AGGRESSIVENESS
ABSTRACT OF DISSERTATION
A dissertation submitted in partial fulfillment of the requirements for the degree of Doctor of Philosophy in the College of Business and Economics at the University of Kentucky
by
Teresa Stephenson Lexington, Kentucky
Director: Dr. Cynthia Vines, Professor of Accounting Lexington, Kentucky
2006
ABSTRACT OF DISSERTATION
THE GAP BETWEEN WHAT TAXPAYERS WANT AND WHAT TAX PROFESSIONALS THINK THEY WANT: A REEXAMINATION OF CLIENT
EXPECTATIONS AND TAX PROFESSIONAL AGGRESSIVENESS
The purpose of this dissertation is to resolve an apparent conflict between the services that tax preparers provide and the tax preparation services taxpayers seek. Some literature demonstrates that tax professionals equate client advocacy with taking aggressive tax positions and minimizing taxes. Other literature suggests taxpayers seek to increase accuracy and reduce the probability of tax audit when they hire a tax professional. This difference is an "expectation gap."
The methodology employed to examine this issue is a survey of tax professionals at various levels of expertise. This survey asks tax preparers what they believe motivates their clients to seek professional tax preparation services. It also asks how aggressive a tax professional should be in minimizing clients’ taxes. A similar survey sent to taxpayers who use the services of a tax preparer asked the same questions about taxpayers’ primary motivation in seeking professional tax preparation services and then about how they believe their tax preparer would answer the questions about aggressive tax reporting.
This dissertation extends the research in several ways. In previous studies, taxpayer motivation has been determined by using a simple checklist or an open-ended question. Instead of using these approaches, I developed a scale using methods that rigorously test for validity. In measuring client advocacy, I use a scale that has been recently developed and used in the literature. While previous research has shown the disparity between what tax professionals provide and what taxpayers want, no study has asked each group how they believe the other group will respond. This will provide a measure of the degree of understanding each group has of the other.
This research show that there is an expectation gap between taxpayers and their tax preparers at all levels, and that this gap is statistically significant. However, the actual size of the gap is small; accuracy and client advocacy have the largest gaps. Additional findings are that timesavings is more important to taxpayers with children, that contact with the IRS is correlated with a lower desire to avoid it, and that lower tax knowledge is correlated with stronger desire for an accurate return.
THE GAP BETWEEN WHAT TAXPAYERS WANT AND WHAT TAX
PROFESSIONALS THINK THEY WANT: A REEXAMINATION OF
CLIENT EXPECTATIONS AND TAX PROFESSIONAL
AGGRESSIVENESS
by
Teresa Stephenson
Dr. Cynthia Vines
Director of Dissertation
Dr. Merl Hackbart Director of Graduate Studies
RULES FOR THE USE OF DISSERTATIONS
Unpublished dissertations submitted for the Doctor’s degree and deposited in the University of Kentucky Library are as a rule open for inspections, but are to be used only with due regard to the rights of the authors. Bibliographical references may be noted, but quotations or summaries of parts may be published only with the permission of the author, and with the usual scholarly acknowledgments.
DISSERTATION
Teresa Stephenson
The Graduate School
University of Kentucky
THE GAP BETWEEN WHAT TAXPAYERS WANT AND WHAT TAX PROFESSIONALS THINK THEY WANT: A REEXAMINATION OF CLIENT EXPECTATIONS AND TAX
PROFESSIONAL AGGRESSIVENESS
DISSERTATION
A dissertation submitted in partial fulfillment of the requirements for the degree of Doctor of Philosophy in the College of Business and Economics at the University of Kentucky
By
Teresa Stephenson Lexington, Kentucky
Director: Dr. Cynthia Vines, Professor of Accounting Lexington, Kentucky
2006
DEDICATION
Acknowledgements
This dissertation, while an individual work, has greatly benefited from the insight and direction of a number of people. First, my dissertation chair Dr. Cynthia Vines provided guidance and support throughout this process and my entire doctoral program. My other committee members, Dr. David Hulse, Dr. Thomas Pope, Dr. Scott Kelley, and Dr. William Rayens, all provided direction and good conversations that helped this work progress at a steady rate. Additionally, other faculty members at the Von Allmen School of Accountancy commented during brownbags and early presentations. They include Dr. Dennis Chambers, Dr. Thomas Howard, Dr. Sean Peffer, Dr. Robert Ramsay, and Dr. Dan Stone. The other doctoral students who were in the program with me provided the role models, motivation, and emotional support so very necessary in this process; I would like to thank Dr. Julia Brennan, Dr. Do-Jin Jung, Dr. Stacy Wade, Dr. Mary Phillips, Mary Elizabeth Holbrook, Cameron Cockrell, Tim Mitchell, and Audrey Scarlata. Dr. Infanger and his assistant Carol Eads at the University of Kentucky Tax School graciously allowed me the use of their mailing list.
Dr. Kathy Hurtt gave me great advice from a distance. Dr. Robert Jamison, friend and mentor, provided me a shoulder to cry on, a cheering section, a sounding board, and contacts as needed.
My colleagues at the University of Wyoming also were there to answer questions and give direction; I would like to thank Dr. Penne Ainsworth, Dr. Gary Fleischman, Mike Doherty, Dr. Larry Weatherford, and Kevin Lewis. I also want to acknowledge financial support from the Von Allmen School of Accountancy, University of Kentucky and the College of Business, University of Wyoming.
Finally, my boys: Travis, who had to live with me during most of this process, and Jeremy, who called often and encouraged me to keep going – thank you.
Table of Contents
Acknowledgements... iii
Chapter 1 Introduction ... 1
Chapter 2 Background and Motivation... 3
2.1 Introduction ______________________________________________________________ 3 2.2 Definitions ________________________________________________________________ 4 2.3 Tax Preparation Costs ______________________________________________________ 5 2.4 Tax Preparer Use __________________________________________________________ 6 2.5 Tax Preparer Selection______________________________________________________ 7 2.6 Client Advocacy and Tax Minimization________________________________________ 9 2.7 Service Qualities __________________________________________________________ 11 2.8 Client Expectations________________________________________________________ 12 2.9 Summary ________________________________________________________________ 14
Chapter 3 Taxpayer Priorities Instrument Development ... 16
3.1 Introduction _____________________________________________________________ 16 3.2 Define the Construct_______________________________________________________ 16 3.3 Generate a List of Items____________________________________________________ 17 3.4 Face Validity _____________________________________________________________ 17 3.5 Pilot Testing and Analysis __________________________________________________ 18 3.6 Final Testing and Analysis__________________________________________________ 19 3.7 Summary ________________________________________________________________ 21
Chapter 4 Method and Results ... 35
4.1 Introduction _____________________________________________________________ 35 4.2 Hypothesis Development ___________________________________________________ 35 4.3 Data Collection ___________________________________________________________ 36 4.4 Data Analysis ____________________________________________________________ 38 4.5 Conclusion, Limitations and Future Research _________________________________ 43
References ... 72
Table of Tables
Table 3-1 Demographics in First Round of Scale Development ...22
Table 3-2 Demographics in Second Round of Scale Development ...24
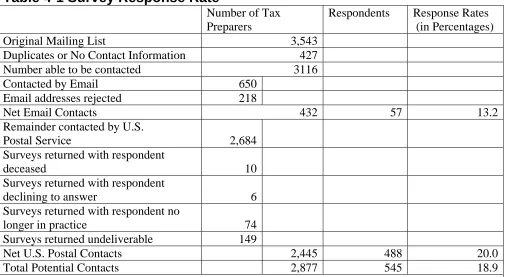
Table 4-1 Survey Response Rate...46
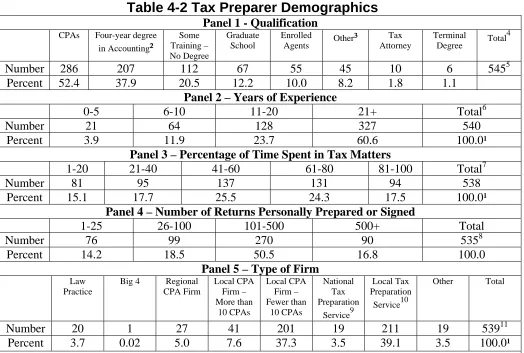
Table 4-2 Tax Preparer Demographics...47
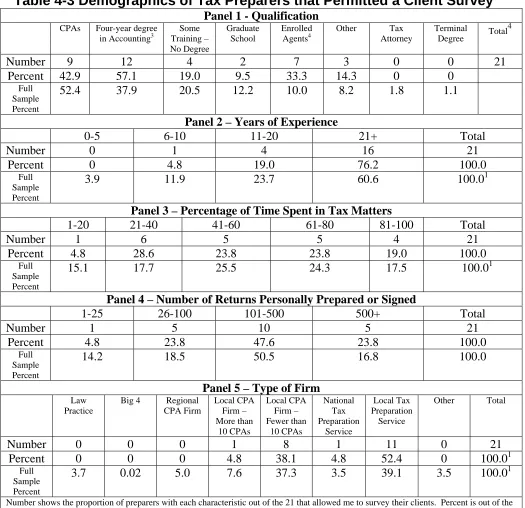
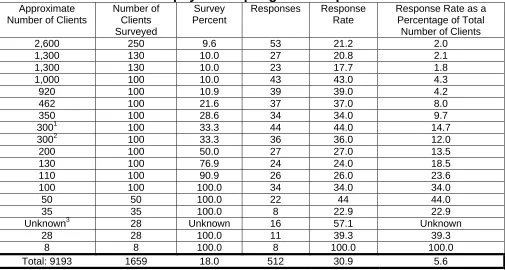
Table 4-3 Demographics of Tax Preparers that Permitted a Client Survey .48 Table 4-4 Taxpayer Sampling and Response Rates ...49
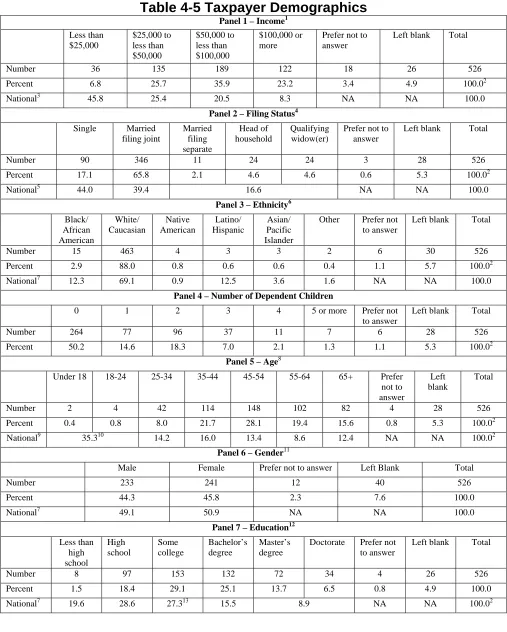
Table 4-5 Taxpayer Demographics...50
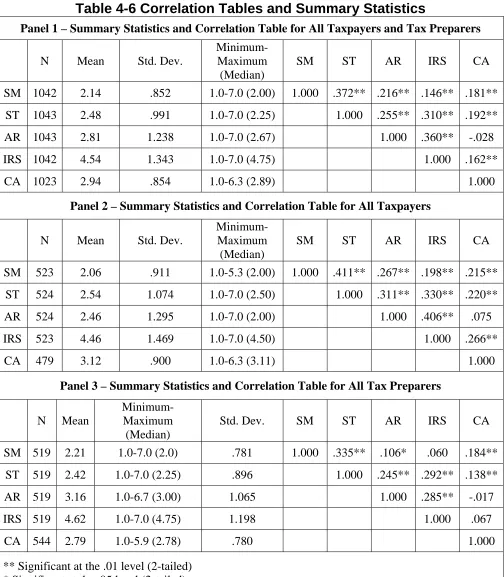
Table 4-6 Correlation Tables and Summary Statistics ...52
Table 4-7 Taxpayer v. Tax Preparer Means...53
Table 4-8 Taxpayer v. Tax preparer Means - Matched Sets...54
Table 4-9 CPAs' v. Non-CPAs' Client Advocacy (CA) Scores ...57
Table 4-10 CPA Clients' v. Non-CPA Clients' Client Advocacy (CA) Scores58 Table 4-11 National Tax Preparation Firms' Clients' v. Other Taxpayers' Accuracy (AR) Scores ...59
Table 4-12 Income’s, Dependent Children’s, and Tax Complexity's Effect on Saving Time (ST) Scores ...60
Table of Figures
Figure 3-1Choosing a Tax Professional...26
Figure 3-2 Initial Pool of Questions...27
Figure 3-3 Round One Scale Development Instrument ...30
Figure 3-4 Round Two Scale Development Instrument ...33
Figure 3-5 Final Tax Client Motivation Scale ...34
Figure 4-1Tax Preparers' Instrument...63
Chapter 1 Introduction
This dissertation examines the relationship between tax professionals and their clients. Specifically, the “expectation gap” between what taxpayers seek when they hire a tax professional and what tax professionals believe they want is examined. Additionally, exploratory research is done to examine the correlations between different characteristics of taxpayers and tax professionals and their taste for tax aggressiveness.
Prior literature shows a mismatch between taxpayers’ objectives and risk preferences and tax professionals’ objectives in preparing tax returns (Schisler and Galbreath 2000; Hite and Hasseldine 2003). Specifically, client advocacy is understood in the accounting literature and tax profession as tax minimization, whereas research shows that most taxpayers seek accuracy as opposed to minimization when they hire a professional (Yankelovich 1984; Collins, Milliron, and Toy 1990). Additionally, taxpayers view tax audit as a failure on the part of their preparer and are more likely to change preparers when audited, yet tax preparers tend to get more aggressive with tax minimization measures as they gain more experience with audits and the Internal Revenue Service (Duncan, LaRue, and Reckers 1989; Schisler and Galbreath 2000). Also, more expert tax practitioners have both the motivation and ability to be more tax aggressive (Jackson, Milliron, and Toy 1988). Finally, some taxpayers may hire tax preparation services to shield themselves from direct interaction with the IRS in case of audit (Dubin, Graetz, Udell, and Wilde 1992; Nichols and Price 2004) or to provide insurance against penalties and other sanctions (Scotchmer 1989; Hite and Hasseldine 2003; Nichols and Price 2004).
This dissertation answers several questions related to the difference between taxpayers’ expectations and tax professionals’ perceptions of those expectations. I develop a scale to identify what taxpayers’ expectations are when they have their taxes professionally prepared. Using that scale, along with a scale developed by Mason and Levy (2001) to measure tax professionals’ client advocacy, I compare the two groups. I use demographics collected on both taxpayers and tax professionals to evaluate how the size of the expectation gap differs among groups. Finally, I determine how well taxpayers choose their tax professional based on these dimensions. This dissertation will inform tax practitioners’ advocacy and aid in increasing client retention and satisfaction. Additionally, if taxpayers desire less aggressive tax advice, more conservative tax- reporting could reduce risk and fees and increase revenue while benefiting the tax practitioner-client relationship.
This dissertation shows that there is an expectation gap between tax preparers at small and regional firms and the taxpayers that hired them. This expectation gap persists between taxpayers and the tax preparers that they hire. Additionally, the data suggest that the levels of client advocacy do not differ between CPAs and non-CPAs as shown in prior literature, that the clients of National Tax Preparation firms have a stronger desire for an accurate return than do other taxpayers, and that taxpayers with children do find saving time to be important. It also shows that lower tax knowledge is correlated with a stronger desire for an accurate return. Finally, the data show that among taxpayers that hire a tax preparer, contact with the IRS reduces the desire to avoid it.
Chapter 2 Background and Motivation
2.1 Introduction
Little research exists on the interaction between tax preparers and taxpayers; more is needed considering the vast amount of time and money spent on tax compliance (Roth, Scholz, and Witte 1989). Hite and Hasseldine (2003) point out that what society expects of tax practitioners does not always correspond with the practitioners’ views or capabilities. If there is an expectation gap – a discrepancy between what the client expects and what the preparer thinks the client expects – as has been found in prior research (Christensen 1992), then there is a hidden cost of risk of audit (and sanctions) being passed on to taxpayers without their knowledge or consent.
Economic theory suggests that when your marginal cost (in time and/or money) to prepare your own tax return exceeds the cost of hiring someone else to do so, you would hire a tax preparer. Empirical evidence supports this concept. Although tax preparation costs billions of dollars, over half of all taxpayers have their returns professionally prepared
(Slemrod and Sorum 1984; Long and Caudill 1987; Collins, Milliron, and Toy 1990; Guyton, O'Hare, Stavrianos, and Toder 2003). Taxpayers are more likely to hire a professional preparer as their return gets more complicated, as their time becomes more limited, and as their income rises (Dubin et al. 1992; Christian, Gupta, and Lin 1993; Ashley and Segal 1997; Arena, O'Hare, and Stavrianos 2002).
We have little information about how taxpayers choose a preparer (McColl-Kennedy and Fetter 1999). Due to the intangible1 nature of tax preparation, the low audit rate and the time between tax preparation and audit, taxpayers have little means of getting objective feedback on their tax preparers (Christensen 1992; Iacobucci 1992; Ostrom and Iacobucci 1995; Myers and Morris 1999). Regardless, taxpayers have shown a tendency to claim accuracy as their main objective in tax preparation (Yankelovich 1984; Collins, Milliron, and Toy 1990).
Tax preparers and tax researchers often equate client advocacy with tax minimization, and efforts toward tax minimization increase with experience and certification (Raby 1983; Ayres, Jackson, and Hite 1989; Reckers, Sanders, and Wyndelts 1991; Hatfield 2000). This tendency towards tax minimization is supported by lower tax liabilities overall for
professionally prepared rather than self-prepared returns (Long and Caudill 1987; Christian, Gupta, Weber, and Willis 1994). Additionally, recent findings show taxpayers represented by tax professionals during audit have lower adjustments to their taxes due than taxpayers representing themselves (Hite and Hasseldine 2003)2.
One contribution this dissertation makes is by extending Christensen’s (1992). She explored the expectation gap between tax practitioners in the (then) Big Six and their clients. She found taxpayers felt their tax preparers did not understand the degree to which
taxpayers wished to avoid audit. Communication problems were another frequent complaint tax clients mentioned during her study.
1
Intangible here is used to mean “incapable of being perceived by the senses” as defined at www.dictionary.com. This is not to be confused with accounting’s sense of intangible as something without physical substance that provides a future value.
2
I extend her research by using tax preparers from small and regional firms. This is a significant contribution as the majority of tax returns that are professionally prepared are not by CPAs and attorneys. A sample of the 1979 Taxpayer Compliance Measurement Program (TCMP) data reveals that less than 20 percent of returns filed with a paid professional’s signature were prepared by CPAs or attorneys (Erard 1993). Also, a 1987 IRS survey shows that about half of all professionally prepared returns are done by preparers who are not attorneys, CPAs or even Enrolled Agents (Cuccia 1995). The market for tax services is highly segmented and the clients’ motivation in hiring a practitioner may well direct the kind of
practitioner they seek (Jackson, Milliron, and Toy 1988).
Additionally, prior research has asked about client motivation using simple checklists, assuming three or four motivations, or with open-ended questions (Yankelovich 1984;
Collins, Milliron, and Toy 1990; Frischmann and Frees 1999). I use established
scale-development procedures to identify motivations and develop a scale to measure them on an individual basis. Using that scale, along with a scale developed by Mason and Levy (2001) to measure tax preparers’ client advocacy, I compare the two groups. Finally, I determine how well taxpayers choose their tax preparers based on these dimensions.
2.2 Definitions
Several terms occur repeatedly in this dissertation. This section defines how those terms are used.
“Accuracy” has been denoted as a primary motivation to hire a tax preparer (Yankelovich 1984; Collins, Milliron, and Toy 1992). Frischmann and Frees (1999) referred to this as “uncertainty reduction.” There are two ways to interpret this. First, it may be the desire to have one’s taxes prepared in such a way as to pay the closest amount possible to the “correct” tax – to reduce the variance around the “true tax” as would be found by a panel of experts3. Second, it may be the desire to have one’s taxes prepared in compliance with rules and regulations in such a way as to avoid coming under scrutiny from the IRS – to err systematically on the side of conservatism. I use the first interpretation as accuracy; the second definition is “audit avoidance” in this dissertation.
“Audit avoidance” means preparing a tax return in such a way as to minimize the likelihood of audit. This implies ambiguities are to be resolved in a conservative manner.
“Client advocacy” implies taking professional care of your clients’ interests. However, this means tax minimization among tax practitioners and in the tax research literature (see for example, Ayres, Jackson, and Hite 1989, Reckers, Sanders, and Wyndelts 1991, and Hatfield 2000). In keeping with the rest of the taxation literature, I will maintain this convention. However, it should be noted that this is a very narrow definition of advocacy and it explicitly assumes that tax clients all wish tax minimization regardless of risk. General economic and finance literature indicate that there is a trade-off between saving money and risk preferences. The tax literature seems to ignore that trade-off and define advocacy strictly in terms of tax minimization.
3
“Expectations Gap” is taken from the marketing literature and means the difference between client expectations and the professional’s perceptions of those expectations and vice versa.
“Tax aggressiveness” involves taking advantage of every legal4 opportunity for tax
minimization (see for example, Schisler 1994, Cloyd 1995, and Spilker, Worsham and Prawitt 1999). Note this does not include tax evasion or fraud. There are vast areas in tax compliance and planning where different interpretations and presentations of facts result in diverse tax liabilities. An aggressive tax preparer would tend to interpret facts to fit client favorable fact patterns and report in such a way as to incur the lowest possible tax as long as the stands taken have at least a one in three chance of judiciary success (See for example Cloyd 1995, and Cloyd and Spilker 1999).
“Tax Gap” is the gap between what taxpayers timely and accurately paid in taxes in a
given year and what they owed.5 For 2001, the GAO estimated it at around $257 billion,
more than triple what it was in 1988 (Fischer, Wartick, and Mark 1992; GAO 2005). When I use this term, I mean gross Tax Gap, or the Tax Gap before collections.
“Tax minimization” refers to efforts made to reduce the overall tax liability of the taxpayer through legal and authorized means. Consequently, this does not include frivolous stands or tax evasion. Any stand taken must be “sustained on its merits” or, in other words, the tax preparer must believe it has at least a one in three chance of judiciary success.6 This definition is similar to “tax aggressiveness7 in that there is a broad definition of “legal and authorized.” The main concept here is that this is different than tax evasion which includes actual misreporting of income and expenses or willfully leaving required items off the tax return.
Freshman and Frees (1999) used "time savings" as a factor for selecting a tax preparer. Time savings occur when a taxpayer spends less time on all compliance related matters by using a tax preparer than with self-preparation.
2.3 Tax Preparation Costs
Paid tax professionals8 provide several services including tax return preparation, ambiguity resolution regarding tax issues, tax planning services, and representation before the IRS in case of audit (Scotchmer 1989). Long and Caudill (1987) state that in 1983 paid preparers prepared 45 percent of tax returns. Slemrod and Sorum (1984) calculated compliance to be at a cost of about $3 billion. Collins, Milliron and Toy (1990) found tax preparation cost rose to $4.4 billion by 1987. Long and Caudill (1993) show tax preparation costs continued to increase to between $7-13 billion in 1989. For 2000, these costs were estimated to be $19.4 billion with an additional 3.4 billion hours of taxpayer time (Guyton, Korobow, Lee, and Toder
4
Legal with the caveat that the law must be interpreted – it is not cut and dried -- and that it is perfectly acceptable to take a questionable position as long as the tax professional has reason to believe it stands at least a one-third chance of being upheld if litigated.
5
This definition and the 2001 amount were taken from Government Accounting Office (GAO) report GAO-050527T which can be found at the GAO website. Of course, there is no definitive answer for what a taxpayer “owes” and so this tax gap amount includes government estimates of tax liability for non-filers and uncollected tax-return liabilities.
6
31 CFT (Code of Federal Regulations) §10.34
7
Indeed, they are virtually synonymous in the tax literature.
8
2005). In 2003, paid preparers signed 61 percent of returns.9 Additionally, tax services constitute about 38 percent of accounting industry revenue (Yancey 1996).
In view of the high costs and great amount of time spent on tax compliance, more research about how taxpayers and tax preparers interact is vital. This dissertation adds to the existing literature by examining how closely tax preparers of all types understand their clients’ expectations and desires and how well taxpayers select their tax preparers.
2.4 Tax Preparer Use
In starting research on the relationship between tax professionals and their clients, it is important to understand who uses tax professionals. Interestingly, paid tax preparer use is over 60 percent, which is an increase from prior years, even while the market for tax software has increased (Guyton et al. 2005). Economic theory would suggest that when it costs more in time or money to perform an action yourself than to hire someone else to do so, you would hire help. The empirical findings that follow support this economic principle.
Prior research shows paid preparer use increases with income, age, self-employment, return complexity, number of dependents claimed, and marginal tax rate and decreases with education and tax knowledge (Slemrod and Sorum 1984; Long and Caudill 1987; Klepper, Mazur, and Nagin 1991; Christian, Gupta, and Lin 1993; Arena, O'Hare, and Stavrianos 2002). Married taxpayers who itemize are less likely to use a paid preparer than other taxpayers (Long and Caudill 1987). As returns become more complex due to increases in income, self-employment and return complexity, or as time becomes more scarce due to increases in age and dependents claimed, it becomes more cost-effective to hire a preparer. The fact that married taxpayers who itemize do not fit this description may be because having two adults doubles the chances that one will have the time and/or knowledge to self-prepare.
Collins, Milliron and Toy (1990) surveyed 700 residents of two states receiving 34
percent usable responses. They split the sample by objective:10 seventy percent claimed
accuracy was their main objective while 25 percent claimed it was tax minimization. About half of each group used a paid preparer. For those with tax minimization as their primary objective, the likelihood of hiring a paid preparer increased with income and age and decreased with tax knowledge and social responsibility. For those with accuracy as their primary motivation, the likelihood of hiring a paid preparer increased with social responsibility and return complexity, and decreased with tax knowledge. These findings are consistent with prior research.
Using 1979 Taxpayer Compliance Measurement Program (TCMP) data, Dubin et al. (1992), showed increases in IRS audit rates, age, or state, local and real estate taxes shift demand for tax preparation services from NTP firms such as H&R Block to CPAs and attorneys. They also found return complexity increases the demand for CPAs and attorneys at the expense of self-preparation. Additionally, contrary to previous research, their study finds the number of exemptions showed the strongest effect in increasing the demand for paid assistance at the expense of self-preparation and non-paid preparers.
Ashley and Segal (1997) introduced a new measure they call absolute positive income (API), which is a total of all positive income reported on the tax return, plus the absolute value of all
9
Tax Year 2003 Taxpayer Usage Study (2004)
10
expenses and deductions taken on the tax return. This, they claim, is a true measure of the tax related dollars, because deductions and expenses affect tax liability as much as income. Using data from the 1988 University of Michigan panel of Individual Tax Returns and a model modified from Christian, et al. (1993) and Long and Caudill (1987) they show 64.7 percent of taxpayers filing a 1040 (long form) used a paid tax preparer as opposed to 46.8
percent overall.11 Because filing a long form is indicative of schedules or attachments
precluding the simpler 1040A or 1040EZ, this supports the finding that greater complexity leads to greater preparer usage.12 Contrary to prior research, they did not find a correlation between marginal tax rate or number of exemptions and paid preparer use.
In summary, the percentage of taxpayers using a paid preparer is increasing. This is likely due to the increasing complexity of the tax laws and the number of taxpayers who have businesses, investments, dependents or other circumstances that increase the cost of self-preparation. With over 60 percent of returns being prepared professionally, more information about the relationship between taxpayers and tax preparers is important and timely. This dissertation will extend the research by evaluating if there are differences in demographics among taxpayers with different primary motivations for seeking a tax preparer.
2.5 Tax Preparer Selection
There is little information about how taxpayers choose a tax preparer. Scotchmer (1989 p.192) notes determining the quality of a given tax preparer is complicated because no certification is required. “Essentially anyone,” she says, “can enter the market and try to find a clientele.” Her analytical model shows tax preparers are hired in order to reduce ambiguity. Bauman and Mantzke (2004) point out that many taxpayers don’t understand the tax law and, therefore, use tax preparers; this leaves the clients ill-equipped to evaluate the tax preparation services.
Two papers looked at tax preparation selection specifically. McColl-Kennedy and
Fetter (1999) used a mail survey with a final usable sample of 340 residents13 of a large
Midwestern city to examine the difference in consumer involvement between professional and non-professional services. As predicted, people are more involved in choosing a movie or a restaurant for a special occasion than they are in choosing tax services or life insurance. Higher income participants were more involved in the choice of tax preparation services than lower income participants were (although still less than the movie or restaurant decisions).
Moser, Colvard, and Austin (2000) used a mail survey with a final usable sample of 528 consumers14 to determine attitudes towards advertising by accountants. The majority of respondents felt advertising was useful and would increase public information, but probably with a higher cost passed on to the consumer. In general, they were more willing to trust the opinion of a friend than advertising, but did not feel suspicious of or deceived by such advertising. They also felt, in general, reputation was more important than paying a low fee.
11
In 2003, according to Tax Year 2003 Taxpayer Usage Study (2004) 61 percent overall used a tax preparer; of 1040 filers it was 66 percent; for 1040A and 1040EZ filers it was 33 and 23 percent respectively.
12
An alternative explanation is that paid preparers prepare the 1040 form even if the taxpayer qualifies for the 1040A or 1040EZ.
13
This was a 22 percent usable response rate.
14
Turning to literature on how consumers choose other professionals, Crane and Lynch (1988) surveyed 100 randomly selected adults as to how they chose their physician and dentist. The top criteria were personal referral, physical facilities, demeanor, and the presence of other patients. Salisbury (1989) sent questionnaires to the newly registered patients of five doctor’s offices located in close proximity; they received 323 responses.15 The most frequent considerations cited were nearest to home, recommended by someone, and other family members go there. Additionally, most participants discovered the practice when someone told them about it or they saw the building. Forty percent of respondents did not know anything about the practice before signing up; forty-nine percent asked family members, co-workers, previous doctors or neighbors about the practice.
Motes, Huhmann, and Hill (1995) surveyed 950 adults16 from both small communities
and large metro areas across the United States. They found wealthier consumers spent less time searching for a dental specialist than less wealthy consumers; there was no difference in search time for routine dental service. College educated consumers used fewer sources of information to find routine dental care than did less educated consumers. Consumers preferred personal sources of information to non-personal sources. The main sources for specialized dentists were referral service, direct visit or call, immediate family, and other relatives. The main sources for routine dental care were referral service, immediate family, and direct visit or call.
Bornstein, Marcus, and Cassidy (2000) surveyed 636 community residents at doctors’ offices, a public shopping area and a women’s organization meeting to assess which factors were most important when choosing a primary care physician. From a list of 23 items, the top five, in order, were board certification, neatness of doctor’s office, neatness of doctor’s personal appearance, recommendations from friends/family, and specialization.
This research indicates when consumers are unable to evaluate the skill level of a professional, they use convenience factors as proxies such as personal referrals, close proximity, or appearance of facilities. As with any other professional, taxpayers have difficulty assessing the competency of a tax preparer. Consequently, one would expect them to choose a tax preparer from factors they are able to assess, such as location, hours, personal referrals, certification, or price. With audit rates low and audits delayed by several years in most cases, it is hard for taxpayers to obtain an objective sense of whether or not their tax preparer is providing the service they desire. Additionally, many people either have no areas of ambiguity in their returns17 or the perception of low or no ambiguity.18 These people will likely believe tax services are homogeneous. This dissertation examines how closely tax preparers understand and provide the type of service their clientele desires. It also evaluates how well taxpayers choose tax preparers providing the type of service for which they are looking.
15
This was a 72 percent response rate.
16
This was a 22.6 percent response rate.
17
For example, those who receive only W-2 income probably have unambiguous returns. This may not be the case if their filing status, qualification for earned income credit, or deductions are unclear.
18
2.6 Client Advocacy and Tax Minimization
The tax literature indicates taxpayer advocacy is the same as tax minimization (Ayres et al. 1989; Reckers et al. 1991). Mason and Levy (2001) developed a scale to measure “client advocacy,” and eight of the nine items on the instrument deal directly with tax minimization. Hatfield (2000 p.112) claims “advocacy results in finding positions that maximize the potential tax savings to the client.” Archival research shows professionally prepared returns have a greater refund due or smaller amount owed than self-prepared returns ceteris paribus (Christian et al. 1994). At the same time, Christensen (1992 p.65) tells us the “services the tax preparer gives the client are based on the preparer’s perceptions of client expectations.” Additionally, tax professionals are aware of the low chances of detection and audit their clients face (Fischer 2002). This allows them to take riskier positions than they otherwise
would knowing the likelihood of audit is low19 (Kaplan, Reckers, West, and Boyd 1988).
Thus, it seems reasonable to predict that most tax preparers believe their clients expect tax minimization efforts.
This seems especially true of experienced tax professionals at the large firms. More experienced tax managers at one of the (then) Big Six firms showed greater tax minimization tendencies than less experienced managers (Pei, Reckers, and Wyndelts 1992). Tax professionals at the large firms have also exhibited confirmation bias when searching for tax law or precedent, which in turns leads to more tax aggressive positions and more confidence in the judicial success of those positions (Johnson 1993; Cloyd 1995; Cloyd and Spilker 1999). Furthermore, increased advocacy is correlated with increased confirmation bias (Johnson 1993). Increased advocacy is also correlated with increasing the weight of factors with favorable outcomes and decreasing the weight of factors with unfavorable outcomes (Davis and Mason 2003).
Making a concerted effort towards tax minimization is denoted “aggression” in the tax literature. Early research assumed tax preparer aggression was due to client aggression; however, when that hypothesis was first tested, the results showed an inverse relationship (Milliron 1988; Duncan, LaRue, and Reckers 1989; Helleloid 1989). Subsequently, researchers found tax preparers increase compliance by resolving perceived ambiguity in
straightforward tax items,20 but are tax aggressive where ambiguities exist in the law
(Jackson, Milliron, and Toy 1988; Klepper and Nagin 1989; Roth, Scholz, and Witte 1989; Klepper, Mazur, and Nagin 1991; Schisler 1994). Still, research shows an important client can convince a tax preparer to sign a return with a more highly aggressive stance than the tax preparer would otherwise take (Reckers, Sanders, and Wyndelts 1991).
Research shows what factors tend to increase tax aggression for different types of preparers. Increasing penalties tend to make CPAs more aggressive, but reduces the
aggression of non-CPAs (Schnee, Bindon, and Ellis 1987).21 CPAs tend to be more
aggressive than non-enrolled preparers (Ayres, Jackson, and Hite 1989). Tax professionals with more (and more successful) experience with the IRS tend to be more aggressive (Duncan, LaRue, and Reckers 1989). Cuccia, Hackenbrack and Nelson (1995) find tax practitioners exploit ambiguity in standards in favor of their client, but when the standards
19
This is known as playing the tax audit ‘lottery.’
20
A personal anecdote exemplifies this: many of my clients believed that if you performed services for less than $600, which does not require the hiring agent to produce and file a Form 1099, the money received was not taxable. This, of course, is clearly false, but is a perceived ambiguous area to some taxpayers.
21
are not ambiguous they assess evidential support in a way that allows them to be just as aggressive. Spilker, Worsham and Prawitt (1999) found tax professionals use ambiguity in tax law to be aggressive in compliance situations, but they are more conservative in planning situations. They explicitly assume taxpayers’ primary motivation is tax minimization and, therefore, advocacy is tax aggressiveness.22
There is no research indicating tax preparers directly communicate with their clientele about risk preferences (Duncan, LaRue, and Reckers 1989; Schisler 1994). Indeed, the IRS
proposed changes to Circular 23023 pointing out the need to inform clients of aggressive
stances.24
As evidence of this tendency towards aggression, a number of studies have examined tax liability on professionally prepared returns and self-prepared returns. Tax liability in 1983 was lower for professionally prepared returns than for self-prepared returns keeping income, filing status, number of dependents, self-employment, age and return complexity constant. Even when factoring in assumed tax preparation fees the results indicated using a tax preparer saves time and money (Long and Caudill 1987). Scotchmer (1989) used analytical modeling to show that when risk-neutral taxpayers lower their risk by choosing to seek professional advice in resolving ambiguity, tax revenues decline. Erard (1993) finds the use of tax professionals -- CPAs and attorneys in particular -- increases non-compliance. Christian et al. (1994) used a two-step switching regression procedure developed to determine the existence of, and correct for, self-selection bias on the SOI Panel Data from 1983. They found paid-preparer returns have a larger refund or smaller payment due than self-prepared returns.
Frischmann and Frees (1999) used the Ernst & Young/University of Michigan Tax Panel data containing information on tax preparer choice for six years and on preparation fees for three years. They classified choice factors into three categories: tax savings, time savings, and uncertainty. The overall results of the study show choosing a tax preparer relates to uncertainty reduction and time savings. The fees charged correlate with time savings and tax savings, but not with uncertainty reduction. Nichols and Price (2004) found representation during an audit reduces the overall final tax assessment charged to the taxpayer by 40 percent.
This section indicates experienced tax preparers and enrolled professionals take aggressive stances more frequently than do other preparers.25 The literature does not make a distinction between CPAs from different sizes or types of firm. This dissertation extends the literature by making more distinctions between the various tax preparers: attorneys, CPAs at the Big Four, CPAs at other large firms, NTP firms, and individual or small company preparers. Tax aggression differences between firms is measured and compared.
22
Clients may be better served by matching tax preparation services to the client’s personal risk preferences, not just making the assumption that tax minimization is each taxpayer’s primary motivation. However, this dissertation will follow the convention of equating advocacy with tax minimization.
23
Circular 230 is entitled, “Regulations Governing the Practice of Attorneys, Certified Public Accountants, Enrolled Agents, Enrolled Actuaries, and Appraisers before the Internal Revenue Service” and it governs the actions of those tax preparers that the IRS recognizes as representatives of taxpayers without the need for a power of attorney.
24
Treasury Issues Rules To Increase Transparency and Halt Abusive Tax Avoidance Transactions (Office of Public Affairs 2003)
25
2.7 Service Qualities
A review of the services marketing literature, as it pertains to tax preparation, can educate us on the way that taxpayers choose a tax preparer. Services marketing became a separate field of academic study in the 1970s (Shostack 1977; Berry and Parasuraman 1993; Fisk, Brown, and Bitner 1993). Services are different from products in several ways; this distinction made its way into the marketing literature in the 1960s (Rathmell 1966). Services have four specific and generally accepted qualities differentiating them from products: heterogeneity, inseparability, perishability, and intangibility (Fisk, Brown, and Bitner 1993; Zeithaml and Bitner 2003). Services are heterogeneous; each experience is likely to be slightly different from any other. In addition, services are inseparable from the purchase experience because they are frequently produced and consumed simultaneously as in receiving a haircut or massage. Services are perishable; they cannot be stocked, returned or
resold. Services are also defined in marketing as intangible;26 they cannot be displayed,
examined or easily communicated.
Tax return preparation services have high levels of all these qualities. They are heterogeneous because the interaction between taxpayer and tax preparer is different for each consumer and each encounter. The interview required to prepare taxes is part of the production/consumption of the service as is the final debriefing after the return is complete. Tax return preparation services are perishable because there is a specific period to which they apply and they cannot be returned or reused. They are intangible; tax preparers make choices that are difficult to communicate fully to the taxpayer. One example of this is a tax preparer making an aggressive choice in an ambiguous situation; even if explained to the taxpayers fully, they would not be able to truly assess the level of risk without a high degree of experience with the Internal Revenue Service (IRS) and knowledge of the specific law.
Goods and services have various attributes consumers use when choosing between alternatives: search qualities, experience qualities, and credence qualities (Zeithaml and Bitner 2003). When searching for goods or services, consumers assess the search qualities -- those attributes that are assessable before purchase -- such as the packaging, texture, color, etc. Experience qualities are only assessable after experiencing the item or service, such as the taste of a particular brand of ice cream, the quality of service at a restaurant, ambience, and the neatness and grooming of employees.
Services tend to be high in the third category; credence qualities are not assessable even after purchase and consumption. A brief discussion of credence qualities is in Zeithaml and Bitner (2003). An example of a service high in credence qualities would be dental work. Usually, even after a filling is in place, patients are unable to assess the quality of the service because they are not qualified to do so. It may take years before the consumer is fully aware of the quality of dental work performed. Credence services rely on trust in many cases and are higher in risk to the consumer.27
Iacobucci (1992) put search, experience and credence qualities on continua. Participants rated 48 goods and services in relation to those continua. Participants rated tax
26
In this sense, the service is intangible until it is consumed or experienced. Although receiving a massage is a tangible experience, you cannot assess that until after the decision to buy has been made. Similarly, a tax return results in a tangible piece of paper, but the service itself is not a tangible good.
27
services about halfway between experience and credence. Few tangible aspects of tax service are assessable ahead of time: office surroundings, employees’ mannerisms and dress, advertising and guarantees are examples. Experience qualities would likely consist of mannerisms of the tax person, sense of authority and empathy with the taxpayer, and the pleasantness of the front office staff. However, it may be several years before the IRS selects a tax return for audit, and a tax preparer may prepare many returns for a client before that happens, if it ever does. Thus, there is little external validation of the quality of a tax preparer's services; the client must rely on trust and other cues such as lack of audit, professional designation and price to proxy for quality.
Ostrom and Iacobucci (1995) examine a number of factors about services. They use four service industries high in credence factors and four low in credence factors on their instrument. Tax preparation was one of the four high credence services. The results from this study show consumers are less price sensitive with high credence services and the authors conjecture price proxies for quality when consumers have no other measure.
If this conjecture holds true, then taxpayers may believe highly paid tax preparers prepare returns that are more accurate without being aware of the differences in aggressiveness between preparers. However, this is probably a poor measure as CPAs are not necessarily more accurate than non-CPAs and there is no correlation between fees and accuracy (Ashton 2000). When faced with the task of finding and trying to evaluate a service, such as tax preparation services, a consumer may take the first suitable alternative28 instead of spending time and resources searching for many alternatives (Zeithaml and Bitner 2003).
Scotchmer (1989) noted tax preparers can be extremely unqualified, can be highly qualified CPAs and attorneys, or can be anything in between. Bauman and Mantzke (2004 p.50) refer to low end tax practitioners with little training or education as “fly-by-night” preparers. There is no federal regulation on who can prepare tax returns for a fee. Scotchmer (1989) points out that insurance or guarantees would help reduce the uncertainty of the quality of the preparer, but this is complicated because the preparer only sees the information the taxpayer wishes to provide and, therefore, moral hazard prohibits complete guarantees.
Taxpayers cannot evaluate tax services objectively; the Internal Revenue Code is objective only insofar as it is not ambiguous. Furthermore, taxpayers who seek professional help are those unfamiliar with tax law and thus uniquely unqualified to evaluate those services (Bauman and Mantzke 2004). Timely filing, competitive fees and lack of audit are also only partial measures of the quality of a tax return (Christensen 1992). This dissertation adds to the literature by examining how well each of the different types of tax preparers know what their clients want as well as how well taxpayers with differing motivations select their tax preparer based on these dimensions.
2.8 Client Expectations
Taxpayers want their tax returns to be accurate. Sixty-three percent of taxpayers in Yankelovich (1984) and 70 percent of taxpayers in Collins, Milliron and Toy (1990) listed accuracy as their primary reason for hiring a tax preparer. Hite and McGill (1992) found tax professionals are more aggressive than their clients want them to be; clients disagreeing
28
with aggressive advice are more likely to change service providers than clients disagreeing with conservative advice. Sakurai and Braithwaite (2001) found that most taxpayers wanted the “low risk, no fuss” preparer who was honest and risk averse. Considering that the Tax Gap in 2001 was around $300 billion, taking aggressive stances can have a significant impact on public finance (GAO 2005). Erard (1993) points out that tax practitioners have an enormous influence on the amount of compliance their clients exhibit.
Christensen (1992) used preparers and clients from a large international accounting firm as survey participants. She sent surveys to 441 clients and the corresponding 31 tax preparers with a 54 and 100 percent response rate respectively. She found differences between client expectations and preparers’ perceptions of those expectations had a direct impact on satisfaction. Overall, clients expect more tax planning advice and strategies, and they perceive the tax preparer as having a poor understanding of their desires. The two largest differences were in the clients’ desire to avoid audit and in communication skills.
Taxpayers seem to disconnect with their tax return after hiring a tax preparer. Evidence to support this comes from two studies. In the first, taxpayers who use paid preparers are less aware of their marginal tax rate than those who do not, showing they were less cognitively involved with the return than taxpayers who self-prepared returns (Rupert and Fischer 1995). Secondly, Tan (1999) found that taxpayers accepted the advice of their preparer regardless of whether it was aggressive or conservative. Such advice did not affect the taxpayer’s intention to continue or terminate the relationship. In addition, Sakurai and Braithwaite (2001) found that 85 percent of taxpayers surveyed thought all their deductions were legitimate, even though over one third did not feel confident about their knowledge of tax matters. Seven percent had no idea if their deductions were legitimate or not because they left it up to someone else to do.
Schisler and Galbreath (2000) used attribution theory in an experimental setting to show taxpayer-participants viewed an IRS audit as failure on the part of the tax preparer, even if the audit outcome was favorable. Furthermore, the taxpayer-participants were less likely to return to that preparer after audit than if they were not audited, regardless of whether the outcome was favorable or not. In their study, taking an ambiguous deduction was part of the instrument for all participants, but the researchers did initially ask if the participants would be likely to take the deduction. No significant difference existed between those who would have taken the deduction and those who would not have when blame was the dependent variable. This shows taxpayers rely heavily on the recommendations of their tax preparers, and will consequently hold them responsible for the decisions made.
transactions they present to their tax preparer. Finally, predicted service plays a role in client expectations. Recent experience with a tax preparer or expectations developed from advertising influence a client's perception of adequate service.
To summarize, taxpayers with higher incomes or more complex returns are more likely to seek out paid tax preparation services than other taxpayers. There is no research showing how those taxpayers find their tax preparers or what criteria they use; however, there is evidence to suggest over half of those seeking paid preparers have accuracy as their main goal and being the subject of a tax audit is viewed as failure on the part of the tax preparer. Finally, the definition of adequate service varies greatly from person to person. I examine the different clienteles to see if tax preparers understand their clients' expectations. I also examine the demographics of the taxpayers to see if differing groups have different motivations for hiring a tax preparer.
2.9 Summary
To add to the existing literature on the relationship between taxpayers and tax preparers, I examine that relationship in greater detail. I also use instruments developed recently and rigorously to analyze both client motivations in seeking professional tax preparation and levels of client advocacy in various types of tax professionals. These instruments should measure client motivations and advocacy more accurately than checklists or open-ended questions. This area of research is important since tax compliance costs a great deal in both time and money and, therefore, is an important part of the way in which the tax system affects taxpayers.
General economic theory suggests that eventually the market becomes efficient and purchasers effectively seek out providers offering the desired services. One broad question in this area is why a difference between taxpayer motivation and what tax preparers provide persists. There are several possible answers to this question. It is possible that the market has become efficient. Because most of the studies of tax preparers used the Big Four accounting firms while taxpayers have come from demographics fitting the population at large, it is possible that the expectation gap does not truly exist, but is just a construct of mismatched samples. Perhaps different clienteles are efficiently seeking out appropriate service providers but researchers have not yet documented this. However, Christensen (1992) found a gap between the tax preparers of a large international firm and their specific clients, making this scenario unlikely.
Sakurai and Braithwaite (2001) found that Australian taxpayers are finding tax professionals who meet their desires. However, this is based on the taxpayers’ perceptions of the qualities their tax professionals possess. It is reasonable to assume that if taxpayers desire a particular quality in a tax professional, and continue to use that person’s services, they would also believe that the professional has that desired quality (or they would change professionals). Their research does not show, however, if that perception is true, or in other words, if an expectation gap exists.
This dissertation extends Christensen’s (1992) findings by using many levels of tax professional, not just those in the Big Four. It also extends Sakurai and Braithwaite’s (2001) findings by measuring differences in taxpayer motivations and client advocacy between matched sets of tax professionals and their clients to see if there is a gap.
population since World War II. With most taxpayers only seeking out this service once a year, and with it being a high credence service, it may not have had enough cycles to clear effectively. Although this does not seem likely, if this is the case, then this dissertation should show a lower expectation gap than Christensen (1992) found as more than a decade has elapsed between the two studies. Mason and Garrett-Levy (2004) recently ran an experiment that showed lower levels of aggressiveness than expected among Big Four tax professionals which may indicate that previously detected levels of tax aggression are declining to better match taxpayers’ desires.
Finally, a lack of understanding on the part of both parties – taxpayers and tax preparers – and a lack of explicit communication about risk preferences compounded with low audit rates and, thus, low evaluative feedback allow the discrepancy to persist. I feel this is the most likely scenario. If this were the case, then those firms with the greatest resources would have the smallest gaps, as they are the ones in a position to do market research to find out what their clientele want. I examine the gap for all sizes of firms.
If clients prefer to minimize audits and to have accurate tax returns, at the expense of an increase in taxes, then less aggressive tax reporting would be cost effective and reduce overall risk. The GAO has made a call for making use of a variety of means to reduce the Tax Gap. Without such reduction, it claims that the fiscal sustainability of the country is in jeopardy (GAO 2005). This research may help to increase conservative interpretations by tax professionals is ambiguous situations, thereby effecting one small way to help reduce the Tax Gap. I would also encourage further research in this area to focus on the varying clienteles with more degrees of differentiation than previously shown.
Chapter 3 Taxpayer Priorities Instrument Development
3.1 Introduction
Mason and Levy (2001p. 82-83) called for additional scales to be developed to provide accounting researchers with an arsenal of instruments that have been tested for validity. The use of these scales by different researchers in different settings will, over time, increase the generalizability of consistent research findings and enrich accounting research.
Roberts (1998) claims that tax accounting academics have a competitive advantage over economists in tax-related judgment and decision making research due to their in-depth technical knowledge of taxes and research ability with cognitive psychology. However, he also recommends that valid scales and instruments need to be developed to exploit this advantage. Valid scales increase the reliability of the experiment and make sure that each researcher is measuring the construct in a similar manner, thus improving the generalizability of results.
The development of such a scale as a part of this dissertation is a methodological contribution to the accounting research community. Such a scale will facilitate future research on taxpayer motivation in hiring tax professionals.
A summary of the literature over the past twenty years shows that the motivations of taxpayers hiring tax preparers can be categorized: accuracy, audit avoidance, money savings, time savings, having a professional to stand between the taxpayer and the IRS either as a form of insurance or to avoid the stress of dealing directly with the IRS (Yankelovich 1984; Scotchmer 1989; Collins, Milliron, and Toy 1990; Christensen 1992; Dubin et al. 1992; Hite, Stock, and Cloyd 1992; Sakurai and Braithwaite 2001; Internal Revenue Service 2002; Hite and Hasseldine 2003; IRS Oversight Board 2004; Nichols and Price 2004).
The various studies that have asked taxpayers their preferences have done so either with an open-ended question (Yankelovich 1984), or with a list from which the taxpayer selected an item (Collins et al. 1990; Christensen 1992). Yet the problem is not as simple as choosing an item from a list. A taxpayer may want an accurate return in order to reduce audit probability, yet these two items have been treated separately in the past. Additionally, tax minimization and accuracy are probably both important to taxpayers, but there is an implicit tradeoff between the two. While this research has yielded interesting results, what is needed is a reliable, tested scale in order to assure that the construct of interest is being consistently measured.
3.2 Define the Construct
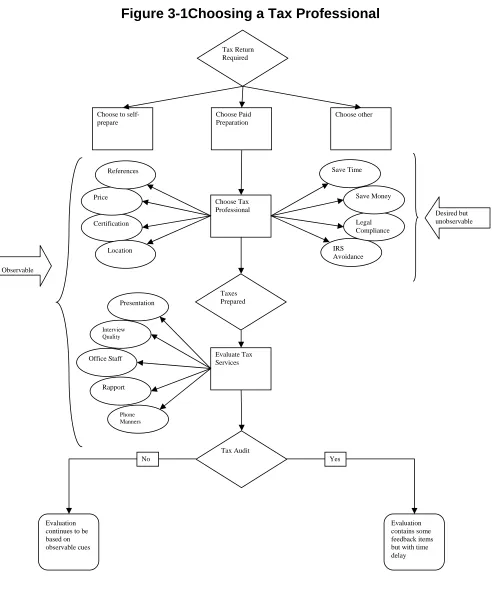
Figure 3-1 was developed as part of this dissertation to show how taxpayers evaluate and select tax professionals. The left hand side of the figure shows the criteria upon which taxpayers are able to evaluate tax professionals’ services. These criteria include those things that a taxpayer can observe and evaluate such as fees, certification, and advertising. This list is not meant to be comprehensive, but to provide an idea of those qualities that are accessible and assessable by an average taxpayer. On the right side are the traits found desirable by taxpayers as a result of this scale development process. If the taxpayer is never audited29 there is never an opportunity to determine if tax minimization, accuracy, etcetera were a function of the professionals’ efforts.30
Understanding the motivations, shown in the right hand side of Figure 3-1, is a significant part of this dissertation. The creation of a scale, which enables tax researchers to accurately measure and define that motivation, is the subject of this section of the dissertation. Having developed the construct, the next step is generating a list of questions.
3.3 Generate a List of Items
Devillis (2003) claims that the ideal in generating an initial item list for a scale is to assume that the universe of potential questions is infinite and that the list generated is a random selection of those questions. This is impossible, of course, but he recommends keeping those criteria in mind when generating the list. Netemeyer, et al. (2003) reiterate that concept, but then say that in practice items are usually generated by selecting questions from the literature and from author generation. These are the methods I used to create the initial list shown in Figure 3-2. The items listed will be given to participants and they will be asked to respond on a Likert-type scale how much they agree with each one. For this reason, they are referred to as questions hereafter.
Some of the questions have been modified from Yankelovich et al. (1984), Collins et al. (1990), and Christensen (1992). Other questions I generated to complete the areas and to juxtapose each criterion against the others. I chose more categories than I expected factor analysis would show as final orthogonal motivations. When factor analysis and principal components analysis were performed, some of the categories merged, such as tax minimization and money savings. However, I left all categories cited in the literature in the initial survey so that a large set of the most common motivations was covered in the first analysis of the instrument. These were all measured using a seven-point Likert-type scale with endpoints of “strongly agree” and “strongly disagree.”
3.4 Face Validity
Netemeyer et al. (2003 p.12) claim face validity induces the “cooperation of the respondents via ease of use, proper reading level, clarity, easily read instructions, and easy-to-use response formats.” They say the instrument should not only be valid but it should look valid. DeVillis (2003) counters by arguing there is the question of to whom it should look valid. He believes that just because a subject does not know the purpose of the question that does not stop the question from being valid.
29
Audit rates have consistently been under 4% for all classes of individual taxpayers since at least 1998 as per IRS
statistics. (Source http://www.irs.gov/taxstats/). Additionally, audit rates declined steadily from 1996 to a low of an average audit rate of .49% in 2000 (White 2001).
30
Both books, however, suggest having a panel of experts review the initial list of questions to make sure they are not ambiguous, do not use jargon, are clearly related to the construct to which they are assigned, and perhaps to suggest alternative wordings or questions as well. My panel of experts consisted of five tax professors and three tax professionals.
After receiving feedback from the expert panel, two questions were eliminated, several were reworded and three were added to the initial list. The length of each question was examined and some were shortened. The difficulty of the words was also examined and technical language was sometimes replaced with shorter, simpler words. Finally, sets of questions that could be asked using the same stem were identified and rewritten to that end. An instrument was then developed and given to the first round of participants. This instrument is represented by Figure 3-3.
3.5 Pilot Testing and Analysis
With an initial item pool of 76 questions, an appropriate sample size for the initial data collection is 200-385 participants (Parasuraman, Zeithaml, and Berry 1988; Clark and Watson 1998).
It is necessary that these participants are acquired from the target population (DeVellis 2003; Netemeyer, Bearden, and Sharma 2003). To find the pool of taxpayers, I put the round-one survey on a website and emailed professors, friends, and students with the URLs of the survey.31 I asked each of them to pass the URLs along to organizations to which they belong and to friends and family with the instructions that anyone who had their taxes professionally prepared would qualify to complete the survey.
Six hundred sixty-one people attempted to do the survey, however 17 were not eligible because they had not had their taxes professionally prepared in the last five years. Another 294 quit before they were done, and two were dropped for giving the same answer to all 76 questions. This left a final usable sample of 348 participants, which is 52.6 percent of the participants who attempted to complete the survey. A response rate is not known because the invitation to complete the survey was done in an informal manner to acquire the highest number of participants possible.
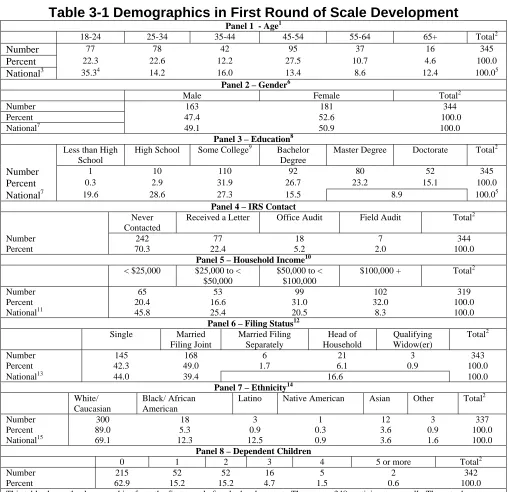
The demographics of the round-one participants are provided in Table 3.1. Accessing Tax Year 2003 Taxpayer Usage Study Report Number 13 (SOI), I compared the demographics of my sample to that of 2003 taxpayers. Not all demographic items are collected from the IRS and, therefore, not all demographic comparisons can be made.
Examining those that can, I found my sample was skewed a bit towards younger taxpayers,32
higher incomes,33 and married taxpayers.34 Finally, SOI data show 37.1 percent of taxpayers with dependent children claimed on their returns compared to 37.2 percent in my sample. However, my sample demographics match national taxpayer statistics fairly closely.
31
Two editions of the same survey were created. The questions are randomized within each page, but the order of the pages is reversed in the two surveys. The combination should eliminate any order effects that may occur.
32
IRS shows 12.69 percent of returns have one filer over age 65; my sample shows 4.6 percent of participants were over 65.
33
IRS data show 70.6 percent of filers with less than $50,000 income; my survey shows 37 percent. IRS shows 20.6 percent between $50-100,000; my survey shows 31 percent. IRS shows 8.8 percent over $100,000; my survey shows 32 percent.
34
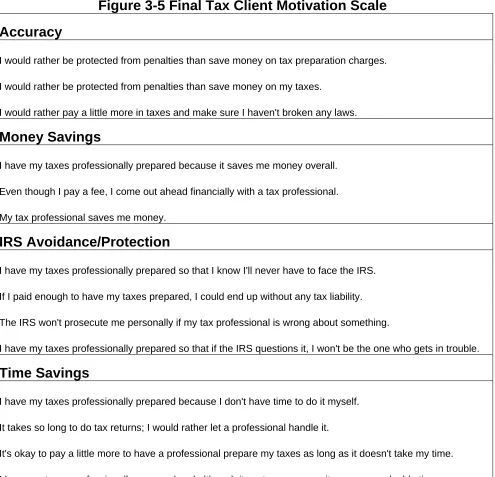
Exploratory factor analysis was used on the data to interpret the factors, determine which items fit into each factor, and to create a limited number of factors. (Dawes 1987). After examining the Eigenvalues and differences between Eigenvalues in the principal components analysis, it was decided to keep four categories. These are described as money savings, time savings, accuracy, and protection from, or avoidance of, the IRS.35
The original 76 questions were subjected to exploratory factor analysis. Twenty questions with loadings above .3 on two factors and three questions with loadings above .2 on three factors were eliminated first. The remaining 53 items were subjected to exploratory factor analysis again. Four factors were retained and the items examined for minimum loading values. Nineteen items were eliminated for loading with values above .2 on more than one factor. Another exploratory factor analysis was run on the remaining 34 questions and the process repeated. Two questions were eliminated in this round for loading on two factors with a greater than .2 value and five questions were eliminated for having primary loadings under .45. This resulted in 27 remaining questions in four categories. The inter-item reliability was evaluated with coefficient alpha resulting in correlations ranging from .90 for time savings down to .78 for accuracy.36
As an incentive to complete this survey, I offered to donate to the charities that received the most votes.37
3.6 Final Testing and Analysis
A second round of responses using the final item pool was collected. This is shown in Figure 3.4. One hundred and eighty participants attempted to complete the survey but 40 were not eligible, since they had not had their taxes completed by a tax professional at least once in the past five years. Complete data were collected from 140 participants, which is 77.8 percent of those who attempted it. As in the first round, a response rate is unknown. This data were analyzed using confirmatory factor analysis and coefficient alpha.
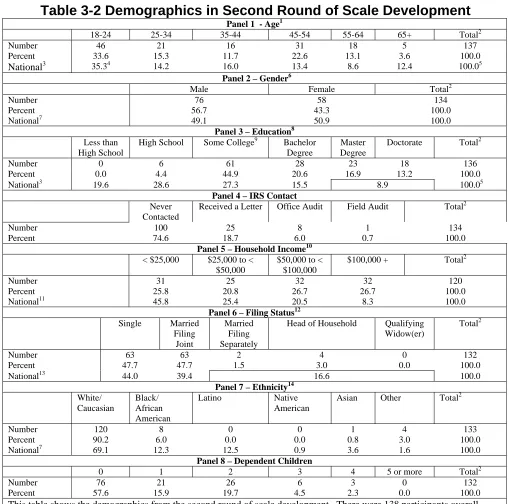
Participants were solicited as in the previous round. Participants were asked not to complete the survey if they had participated in the first. The demographics of this sample are provided in Table 3-2. As in the first round, there are differences between my participants and national averages. Similar to the first round, my sample is younger, wealthier, and
contains more married people.38 There is no reason to assume that the variances would
change the validity of the instrument. Because the IRS statistics cover all filers, not just the ones who use tax preparers, having wealthier respondents may actually increase the validity of the instrument since there is a correlation between income and tax preparer use.
35
These categories correspond somewhat to the ones Sakurai and Braithwaite (2001) found using factor analysis for Australian taxpayers: Low risk/no fuss, cautious minimization/conflict avoidance, creative accounting/aggressive minimization. However, Sakurai and Braithwaite did not ask questions that would have measured the importance of money savings or time savings directly.
36
A coefficient alpha that is too high (above .95) shows that the scale contains redundancies. The lower acceptable end is usually recognized as being about .70, but some academic research accepts scales with coefficient alphas around .60.
37
For round one, 132 people chose American Red Cross, 40 people chose PetsMart Charities, 34 chose March of Dimes, 31 chose Marine Toys For Tots, 26 chose UNICEF, 18 chose American Civil Liberties Union, 17 chose Goodwill, and 48 chose to name their own, but that resulted in no more than six for any particular charity. Accordingly, $100 was sent to the American Red Cross and $50 each to PetsMart Charities and March of Dimes.
38