Ion content and its correlation with some physiological parameters
in olive cultivars in response to salinity
F. Olyaei, B. Baninasab , C. Ghobadi, M. Gholami
Department of Horticulture, College of Agriculture, Isfahan University of Technology, Isfahan, I.R. Iran * Corresponding Author: [email protected]
ARTICLE INFO ABSTRACT- Olive (Olea europaea L.) is one of the most valuable and widespread fruit trees in Iran. Salt stress-induced changes in membrane stability, photosynthesis and antioxidant enzyme activity were examined on four olive cultivars (Dakal, Shiraz, Zard and Amigdalifolia) by emphasizing the correlation between measured parameters and ion (K+, Na+) accumulation. Plants were subjected to four salt treatments (0, 100, 150 or 200 mM NaCl) under greenhouse conditions. The exposure of the olive plants to increased salinity resulted in a decline in relative leaf chlorophyll content (RLCC), photosynthesis rate (Pn), transpiration rate (E) and leaf and root K+ content. NaCl increased superoxide dismutase (SOD) and peroxidase (POX) activity of olive leaves. Increasing the concentrations of NaCl in soil increased the concentration of Na+in the leaves and roots. Differences in the effectiveness of Na+exclusion mechanism among cultivars at high salinity reflected differences in salt tolerance. ‘Zard’, the better-adapted cultivar, displayed tolerance to high internal salt concentrations without apparent cell damage. Relationships between parameters involved in salinity response are discussed in relation to ion accumulation in leaves and roots of olive cultivars.
Article history:
Received 16 April 2014
Accepted 29 June 2015
Available online 19 December 2015 Keywords:
Antioxidant enzyme Ion accumulation Olive
Photosynthetic parameters Salinity
INTRODUCTION
Salinity is one of the most important environmental factors, limiting crop production in arid and semi-arid regions (Sepaskhah and Yarami, 2010). The deleterious effects of salinity on plant growth are associated with low osmotic potential of soil solution (water stress), nutritional imbalance, specific ion effect (salt stress), or a combination of these factors (Ashraf, 1994; Marschner, 1995). Toxicity of Na+ in metabolic
processes results from its ability to compete with K+for
binding sites and to inactivate enzymes and essential cellular functions and, consequently, crops growing in saline soils may suffer the dual injury of Na+ toxicity
and low K+ concentrations (Munns and Tester, 2008).
For most plants to tolerate salinity, Na+and Cl–uptake
must be restricted while maintaining the uptake of macro nutrients such as K+, NO
3–and Ca2+ (Tavakkoli et
al., 2011). One of the harmful changes possibly occurring when plants are subjected to salt stress conditions is the production of reactive oxygen species (ROS) such as superoxide (O2-), singlet oxygen (1O2),
hydroxyl radicals (OH) and hydrogen peroxide (H2O2)
(Misra and Gupta, 2006). These ROSs have the potential to initiate destructive processes such as damage to membrane, nucleic acids and other cellular structures, and consequently photosynthesis reduction and growth inhibition (Agarwal and Shaheen, 2007; Gao et al. 2008). Plants have developed enzymatic and nonenzymatic defense systems against ROSs (Parida and Das, 2005). According to Menvielle-Bourg (2005) superoxide dismutase (SOD) is a powerful antioxidant enzyme that inactivates the O2-by transforming it into
H2O2. therefore, it constitutes the first and one of the
main links of the defense process against free radicals. Electrolyte leakage (EL) from leaf tissues has been reported as an indirect mean of assessing membrane stability (Franklin and Zwiazek, 2004; Goreta et al., 2007). Therefore, such a technique has also been applied to quantify damages to cell membranes in various abiotic stress conditions (Bajji et al., 2002) such as salt stress (Sreenivasulu et al., 2000).
It has been reported that under salinity conditions, excessive accumulation of ions in the cytoplasm or chloroplast of mesophyll cells reduces the photosynthesis rate (Dubey, 2005). On the other hand Jha et al. (2010) found that the ecotype accumulating the lowest shoot Na+
exhibits the lowest salinity tolerance whereas the ecotype accumulates significantly higher concentrations of Na+
maintaining near-normal levels of growth. In addition, salt-induced changes in physiological, morpho-anatomical and biochemical traits are different depending on the crop species (Baum et al., 2000). As with other plants, differences could exist among different own-rooted cultivars of olive in response to salinity stress (Chartzoulakis et al., 2002; Perica et al., 2004). The relation between ion accumulation because of salt stress and diminished growth is not consistent among studies. The use of plant ionic status to identify salt tolerance has been shown to be applicable and its relationship with salt tolerance is considered strong enough to be exploited as a selection tool in the breeding of salt tolerant cultivars (Omielon et al., 1991).
The cultivation of olive in Iran is highly encouraged because of its limited water requirement and its
tolerance towards water salinity. Although there are numerous studies on the salt tolerance of olive cultivars, there is a lack of studies that compare Iranian olive cultivars.
In this paper, the effect of different concentrations of NaCl on some physiological and biochemical parameters and cultivar variability of the response was studied by emphasizing the correlation between measured parameters and ion (K+, Na+) accumulation.
Our aim was to test the differences among the studied cultivars under salinity stress conditions and the relation between ion distribution in leaves and roots and membrane stability, photosynthesis and enzymatic antioxidant system.
MATERIALS AND METHODS
One-year-old rooted cuttings of Iranian olive cultivars (‘Dakal’, ‘Shiraz’, ‘Zard’) and non-Iranian cultivar ‘Amigdalifolia’ were grown in the research greenhouse of Agricultural College, Isfahan University of Technology of Iran. Plants were grown in plastic pots filled with a mixture of soil, fine sand and leaf mould (1: 1: 1, v/v/v). The minimum and maximum temperatures during the experiment period were 19 and 37KC, respectively. A month after sticking the cuttings, the pots with uniform plants were subjected to the treatment with 0 (control), 100, 150 or 200 mM NaCl. The electrical conductivities of these solutions were 0.003, 10.52, 15.43 and 19.55 dS m-1, respectively. To
avoid osmotic shock, the NaCl concentration was increased gradually. The layout was a 4×4 factorial experiment in a complete randomized design, with four replications. The experimental measurements were carried out 8 months after beginning the treatments. Superoxide dismutase (SOD) and peroxidase (POX) Fresh leaves (0.5 g) of plants were ground in 8 mL of 50 mM cold phosphate buffer (pH 7.8) and centrifuged at 15000 g for 20 min at 4 °C. The supernatant was used for the determination of the activities of antioxidant enzymes. SOD activity was measured according to Van Rossun et al.'s (1997) method with a slight modification. Briefly, 3 ml of the reaction mixture contained 13 mM methionine, 0.1 mM EDTA, 50 mM phosphate buffer (pH 7.0), 100 Pl enzyme extract, 1 mM nitroblue tetrazolium chloride (NBT) was added to 2 PM riboflavin. The tubes were shaken and placed below two 30-W fluorescent lamps. The reaction was stopped by turning off the lamps. A tube without enzyme extract was taken as control and a non-irradiated complete reaction mixture served as blank. The absorbance was recorded at 560 nm by Shimadzu, UV-160A spectrometer (Shimadzu Corporation, Kyoto, Japan).
The activity of POX was determined spectrophotometrically according to Rodriguez and Sanchez (1982). POX activity was analyzed in 50 mM phosphate buffer (pH 6.5) containing 40 mM guaiacol and 26 mM H2O2. The increase of absorbance at 420 nm
was recorded within 180 sec after adding H2O2. Total
soluble protein was measured according to the method of Bradford (1976). The enzyme activity was expressed in Pmol min-1mg protein-1.
Electrolyte leakage (EL)
EL was used to estimate membrane permeability. It was measured according to the method of Lutts et al. (1996). Five leaf discs were taken from the youngest fully-expanded leaves on one plant per replicate. After three washes with distilled water to remove surface contamination, the discs were then placed in a test tube containing 15 ml deionized water. Test tubes were vibrated on a shaker at room temperature for 24 h. After incubation, electrical conductivity (EC) of the solutions (EC1) was recorded. The samples were autoclaved for
20 min, cooled to room temperature and the conductivity of solutions was read again (EC2). EL was
calculated from the following formula (Eq: 1)
EL = (EC1/EC2) ×100 (1)
Relative leaf chlorophyll content (RLCC)
RLCC of the youngest fully-expanded leaf was determined just before the harvest by using a chlorophyll content meter (Hansatech Instrument Ltd., King’s Lynn, UK). The chlorophyll meter readings were used as relative values for chlorophyll content.
Photosynthetic rate (Pn) and transpiration (E)
Pnand E were monitored with a portable photosynthesis
system LCi (English instrument Ltd, UK). The measurements were performed on young fully expanded sun exposed leaves between 10:00-14:00 h.
Ion Content
To determine ion content, leaves and roots were washed with distilled water and were oven dried at 75KC for 72 h. A 0.5 g sample of dried tissue was ashed in a muffle furnace at 500KC for 5 h. The ash was then dissolved in 10 ml 2 N HCl and the volume was adjusted to 100 ml with deionized water. Na+ and K+ concentrations were measured using flame photometerry (PEP7, Jenway, Dunmow, UK).
Statistical analyses
Statistical analysis was performed using the SAS program version 9.1 (SAS Institude, Crag, NC). Means were compared using the least significance difference (LSD) test at 5% probably level.
RESULTS AND DISCUSSION
63
obtained in ‘Zard’ whereas the lowest (195.50 Pmol.min -1.mg protein-1) one was observed in ‘Dakal’ (Table 1).
Similar to SOD activity, salt stress increased POX activity significantly, with maximum increase observed in plants grown with 200 mM NaCl (Table 1). A significant difference was observed between cultivars concerning POX activity (Table 1). The highest POX activity was obtained in ‘Zard’ whereas the lowest one was observed in ‘Dakal’ (Table 1).
The identification of cultivars that show differences in the photosynthetic response, exclusion of ions from leaf blades and photo-assimilates use under salt stress conditions is a necessary starting point to study the key regulatory steps in response to salt stress and the involvement of genes related to salt stress tolerance (Nebauer et al., 2013).
Table 1. Effects of salinity, cultivar and their interactions on superoxide dismutase (Pmol min-1 mg protein-1) and peroxidase activity (Pmol min-1 mg protein-1) of one-year olive cuttings.
NaCl (mM)
Cultivars Mean
Dakal
Shiraz AmigdalifoliaZard
Superoxide dismutase (SOD) activity
0 18.04h† 181.85h 193.43g 183.01h 185.33D
100
197.26fg 203.61ef 217.91cd 197.22fg 204.00C
150
201.55fg 223.92c 245.94b 203.87ef 218.82B
200
216.14cd 239.41b 259.09a 211.57de 231.55A
Mean 195.50C 212.20B 229.09A 198.92C
Peroxidase (POX) activity
0 51.41h 181.85h 193.43g 183.01h 185.33D
100
77.54g 203.61ef 217.91cd 197.22fg 204.00C
150
108.06ef 223.92c 245.94b 203.87ef 218.82B
200
122.19bcd 239.41b 259.09a 211.57de 231.55A
Mean 89.80C 212.20B 229.09A 198.92C
Values followed by the same letters within columns and rows are not significantly different at P U0.05. Uppercase and lower -case letters are used for the main and interaction effects, respectively.
The increase in antioxidant enzymes activities show that salinity causes oxidative stress in olive plants. SOD is one of the most important scavengers of ROS which play a primary role in preserving cells via the scavenging of the O2-, a precursor of all other ROSs.
The increase in SOD activity leads to enhanced production of H2O2. POX isozymes are able to scavenge
the H2O2 produced by SOD (Asada, 2006). Thus, in
olive cultivars, the possible H2O2 build-up could be
attended by an increase in the activity of POX.It has been reported that plants with high levels of antioxidants have greater resistance to oxidative damage (Young and Jung, 1999). Our results are in agreement with this finding. The cultivars ‘Zard’ and ‘Shiraz’ were the most tolerant ones, with the highest SOD and POX activities. Meneguzzo et al. (1999) proposed that the mechanism by which salinity affects the antioxidant responses might be via the change in membrane integrity caused by high Na+to Ca2+ ratio.
EL was affected by both salt stress and cultivar (Table 2). Salinity stress induced a dramatically increased leaf electrolyte leakage in the leaves of salt-treated olive plants. At 200 mM NaCl, leaf electrolyte leakage was the maximum compared to those of the control and other salt levels (Table 2). Significant variability was found among cultivars on leaf electrolyte leakage. The lowest increase in leaf electrolyte leakage was obtained in ‘Dakal’, which was reached by 2.9 times at 200 mM NaCl whereas the highest one was observed in ‘Amigdalifolia’ with a 4.8 times increase when compared to untreated control (Table 2).
Salinity stress impaired membrane permeability by inducing electrolyte leakage in leaves (Kaya et al., 2013). EL of all cultivars increased with increasing salinity, but the differences could be due to genetic differences between cultivars. High Na+ accumulation
have been reported to result in an enhanced membrane damage, electrolyte leakage and oxidative damage (Mandhania et al., 2006). The ‘Amigdalifolia’ cultivar was found to be salt sensitive in terms of higher leaf EL and Na+ accumulation under salinity conditions. A
linear relationship between Na+ concentration in olive
leaves with EL (r2= 0.87) suggests that this process is
related to Na+accumulation, and could be used for the
early detection of membrane injury of olive cultivars under salinity stress (Perica et al., 2008).
Salinity stress decreased RLCC of salt-treated olive plants. The lowest RLCC was observed at 200 mM NaCl, which was 66.79% lower than that of the untreated control (Table 2). The effect of salinity on RLCC showed a significant cultivar variation. RLCC was significantly reduced in ‘Amigdalifolia’ at 100 mM NaCl while the negative effect of salt treatments on the RLCC of other cultivars was significant at the 150 mM NaCl. However, results showed that RLCC reduction ranged between 50.38% in ‘Zard’ to 85.21% in ‘Amigdalifolia’ at 200 mM NaCl compared to the untreated control plants (Table 2).
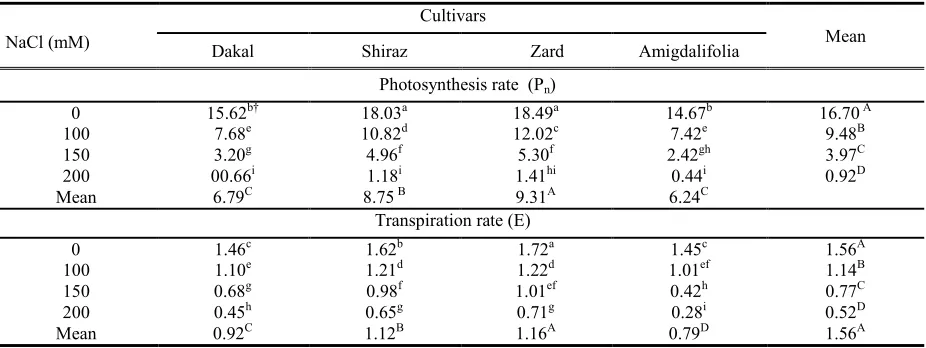
Salt stress significantly reduced the net photosynthetic rate (Pn) and transpiration rate (E), with
of the experiment. The highest reduction in Pn was
observed in ‘Dakal’, which reachedy 50.88% at 100 mM NaCl whereas the lowest one was observed in ‘Zard’ with a 34.99 % decrease when compared to untreated control (Table 3). Significant variability was
found between cultivars on E. The highest (1.16 mmol m-2 s-1) transpiration rate was observed in ‘Zard’
whereas the lowest (0.79 mmol m-2 s-1) one was
observed in ‘Amigdalifolia’ (Table 3).
Table 2. Effects of salinity, cultivar and their interactions on electrolyte leakage (%) and relative leaf chlorophyll content of one-year olive cuttings.
Mean
Cultivars Mean
Dakal
Shiraz AmigdalifoliaZard
Electrolyte leakage (EL)
0 14.62h† 14.29h 13.37h 11.70h 13.49D
100
25.39fg 27.59ef 26.04e-g 24.00g 25.76C
150
29.21de 31.94d 31.36d 44.08c 34.15B
200
42.40c 53.93ab 50.95b 56.52a 50.95A
Mean 28.07D 31.94C 30.27B 34.08A
Relative leaf chlorophyll content (RLCC)
0 201.67a 213.10a 213.92a 207.10a 208.95A
100
176.60a 199.38a 206.88a 162.50bc 186.34B
150
101.65d 153.75c 154.38c 77.50e 121.82C
200
43.83f 96.95de 106.15d 30.63f 69.39D
Mean 130.94B 165.79A 170.33A 119.43C
†Values followed by the same letters within columns and rows are not significantly different at P U0.05.
Upper-case and lower -case letters are used for the main and interaction effects, respectively.
Table 3. Effects of salinity, cultivar and their interactions on photosynthesis rate (mmol m-2 s-1) and transpiration rate (mmol m-2 s-1) of one-year olive cuttings.
NaCl (mM)
Cultivars Mean
Dakal
Shiraz AmigdalifoliaZard
Photosynthesis rate (Pn)
0 15.62b† 18.03a 18.49a 14.67b 16.70A
100
7.68e 10.82d 12.02c 7.42e 9.48B
150
3.20g 4.96f 5.30f 2.42gh 3.97C
200
00.66i 1.18i 1.41hi 0.44i 0.92D
Mean 6.79C 8.75B 9.31A 6.24C
Transpiration rate (E)
0 1.46c 1.62b 1.72a 1.45c 1.56A
100
1.10e 1.21d 1.22d 1.01ef 1.14B
150
0.68g 0.98f 1.01ef 0.42h 0.77C
200
0.45h 0.65g 0.71g 0.28i 0.52D
Mean 0.92C 1.12B 1.16A 0.79D 1.56A
†Values followed by the same letters within columns and rows are not significantly different at P U0.05. Upper-case and lower- case letters are used for the main and interaction effects, respectively.
The salt stress period was paralleled by a decrease in RLCC, Pnand E. Reduction of chlorophyll content by
salinity has been reported by several researchers such as Erturk et al. (2007) and Mousavi et al. (2008). There was a relationship between salt accumulation and photosynthesis reduction in leaves. Thus, photosynthetic sensitivity to salt depended on salt exclusion or compartmentalization in the leaves of the olive cultivars investigated. According to Tavakkoli et al. (2010) high Cl¯ concentration reduces the photosynthesis capacity
due to chlorophyll degradation which may result from a structural impact of high Cl¯concentration on PSII. The lower RLCC and Pnin ‘Amigdalifolia’ and ‘Dakal’ can
be explained by the lower SOD and POX activities, leading to peroxidation of membrane lipids and thus the cooxidation of chlorophyll (Candan and Tarhan, 2003).
The Salt tolerant cultivars as well as the salt sensitive cultivars were similar in photosynthetic capacity. These findings suggest that cultivar variation for salt tolerance in olive was not due to differences in photosynthetic rate and thus it cannot be used as an effective selection criterion for salt tolerance in olive. This has earlier been observed in different crops such as radish (Noreen et al., 2012). The transpiration rate was reduced with the addition of NaCl. The reduction was highest in ‘Amigdalifolia’ (80.7%) compared to other cultivars. Sharma et al. (2005) reported higher reduction in E in salt sensitive cultivar of wheat under salinity stress. Since K+ is the specific ion involved in stomatal
65
greater control of stomatal regulations under such stress compared with other cultivars.
The Na+of the root and leaf increased by increasing
NaCl in all cultivars, although in the root, it showed a saturation trend at 200 mM in ‘Zard’ and ‘Amigdalifolia’ (Table 4). Root Na+concentration in all
cultivars was higher than that of leaves. Root Na+
concentration was the highest in ‘Zard’ while the lowest leaf Na+ was noticed in this cultivar. ‘Amigdalifolia’
showed exactly the opposite pattern of Na+
accumulation. In ‘Dakal’, ‘Shiraz’, ‘Zard’ and
‘Amigdalifolia’, Na+concentration in roots increased by
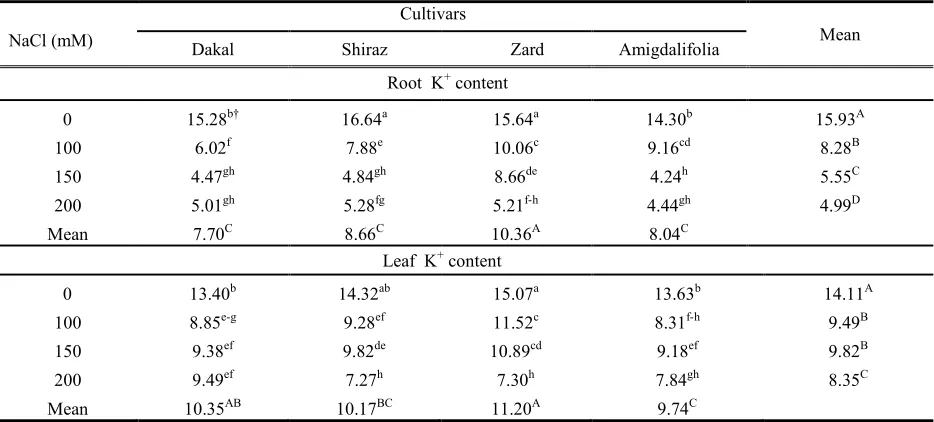
493, 550, 425 and 600 percent, respectively (Table 4). Salinity in root zone led to a significant decrease in K+
concentration in the root and leaf in all olive cultivars, but no significant differences were observed in root K+
concentration between 150 and 200 mM NaCl treatments except in ‘Zard’ (Table 5). At the highest NaCl concentration (200 mM), there were no significant differences in leaf K+ among the three cultivars of
‘Shiraz’, ‘Zard’ and ‘Amigdalifolia’ (Table 5).
Table 4. Effects of salinity, cultivar and their interactions on Na+content (mg g-1) of root and leaf of one-year olive cuttings.
NaCl (mM)
Cultivars Mean
Dakal
Shiraz AmigdalifoliaZard
Root Na+content
0 5.57g† 5.34g 6.46g 3.37h 5.19D
100
15.81f 16.77f 19.60e 15.27g 16.86C
150
22.92d 24.97c 33.04a 22.35d 25.82B
200
30.03b 34.70a 33.90a 23.58cd 30.55A
Mean 15.58C 20.44B 23.25A 16.14D
Leaf Na+content
0 0.24h 0.18h 0.18h 0.26h 0.22D
100
4.29g 3.81g 3.50g 7.13f 4.68C
150
10.23d 8.20e 6.35f 19.41b 11.05B
200
19.25b 15.51c 8.14e 21.68a 16.14A
Mean 8.50B 6.93C 4.54D 12.12A
†Values followed by the same letters within columns and rows are not significantly different at PU0.05. Uppercase and lower -case letters are used for the main and interaction effects, respectively.
Table 5. Effects of salinity, cultivar and their interactions on K+content (mg g-1) of root and leaf of one-year olive cuttings.
NaCl (mM)
Cultivars Mean
Dakal
Shiraz AmigdalifoliaZard
Root K+content
0 15.28b† 16.64a 15.64a 14.30b 15.93A
100
6.02f 7.88e 10.06c 9.16cd 8.28B
150
4.47gh 4.84gh 8.66de 4.24h 5.55C
200
5.01gh 5.28fg 5.21f-h 4.44gh 4.99D
Mean 7.70C 8.66C 10.36A 8.04C
Leaf K+content
0 13.40b 14.32ab 15.07a 13.63b 14.11A
100
8.85e-g 9.28ef 11.52c 8.31f-h 9.49B
150
9.38ef 9.82de 10.89cd 9.18ef 9.82B
200
9.49ef 7.27h 7.30h 7.84gh 8.35C
Mean 10.35AB 10.17BC 11.20A 9.74C
†Values followed by the same letters within columns and rows are not significantly different at P U0.05. Uppercase and lower -case letters are used for the main and interaction effects, respectively.
The selective accumulation of K+ over Na+ was
estimated by the ratio K+/(K++Na+) of these ion concentrations in the olive above ground organs. Although salt treatment led to a significant drop of K+
concentrations in both shoots and roots, the cultivar ‘Zard’ exhibited a strong selectivity for potassium uptake, as shown by Table 6. Indeed, despite decreasing
with higher salt treatments, K+/(K++Na+) selectivity
ratios within the plant organs remained high.
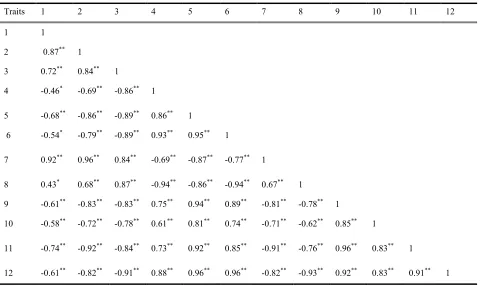
In this study, the correlation between various physiological indices (SOD, POX, EL, RLCC, Pn, E)
and leaf and root K+and Na+and K+/(K++ Na+) ratio in
existed between and among these physiological indices and ion concentrations (Table 7).
It has been proposed that physiological mechanisms underlying salt tolerance, such as ion exclusion, are more relevant criteria for improving salt tolerance in crops (Dionisio-Sese and Tobita, 1998). Both
glycophytes and halophytes cannot tolerate large amounts of salt in the cytoplasm and therefore, under saline conditions they either restrict the excess salts in the vacuole or compartmentalize the ions in different tissues to facilitate their metabolic functions (Yadav et al., 2011).
Table 6. Effects of salinity, cultivar and their interactions on K+/( K++Na+) ratio in roots and leaves of one-year olive cuttings.
NaCl (mM)
Cultivars Mean
Dakal
Shiraz AmigdalifoliaZard
K+/(K++Na+) ratio in root
0 0.73b† 0.76b 0.73b 0.81a 0.76A
100
0.28e 0.32d 0.34d 0.38c 0.33B
150
0.16g 0.16g 0.21f 0.16g 0.17C
200
0.14g 0.13g 0.13g 0.16g 0.14D
Mean 0.33C 0.34BC 0.35B 0.38A
K+/(K++Na+) ratio in leaf
0 0.98a 0.99a 0.99a 0.98a 0.99A
100
0.68c 0.71c 0.77b 0.54e 0.67B
150
0.48f 0.55e 0.63d 0.32h 0.50C
200
0.36g 0.32h 0.47f 0.27i 0.36D
Mean 0.63B 0.64B 0.72A 0.53C
†Values followed by the same letters within columns and rows are not significantly different at P U.05. Uppercase and lower -case letters are used for the main and interaction effects, respectively.
Table 7. Correlation between olive cultivars traits under salinity stress conditions.
Traits 1 2 3 4 5 6 7 8 9 10 11 12
1 1
2 0.87** 1
3 0.72** 0.84** 1
4 -0.46* -0.69** -0.86** 1
5 -0.68** -0.86** -0.89** 0.86** 1
6 -0.54* -0.79** -0.89** 0.93** 0.95** 1
7 0.92** 0.96** 0.84** -0.69** -0.87** -0.77** 1
8 0.43* 0.68** 0.87** -0.94** -0.86** -0.94** 0.67** 1
9 -0.61** -0.83** -0.83** 0.75** 0.94** 0.89** -0.81** -0.78** 1
10 -0.58** -0.72** -0.78** 0.61** 0.81** 0.74** -0.71** -0.62** 0.85** 1
11 -0.74** -0.92** -0.84** 0.73** 0.92** 0.85** -0.91** -0.76** 0.96** 0.83** 1
12 -0.61** -0.82** -0.91** 0.88** 0.96** 0.96** -0.82** -0.93** 0.92** 0.83** 0.91** 1 †Superoxide dismutase activity: (1); peroxidase activity: (2); electrolyte leakage: (3); relative chlorophyll content: (4); photosynthesis rate: (5), transpiration rate: (6); root Na+content: (7); leaf Na+content: (8);
67
In our study, Na+ concentration in leaves and roots increased significantly whereas K+ decreased
significantly, as has also been reported by Chartzoulakis et al. (2002). The accumulation of Na+in roots provides
a mechanism for olive to cope with salinity in the root zone and/or may indicate the existence of an inhibition mechanism of Na+transport to leaves (Chartzoulakis et
al., 2002). Such kind of mechanism has already been observed in salt tolerant cultivars of different crops such as radish (Noreen et al., 2012). It is known that olive cultivars have an effective salt-exclusion mechanism operating in their roots, which limited salt translocation to the leaves (Demiral et al., 2011). The effectiveness of Na+ exclusion mechanism in the roots differed
significantly among studied cultivars, working effectively in ‘Zard’ (by inhibiting translocation of Na+
to the aerial part) and being much less efficient in ‘Amigdalifolia’. ‘Zard’ could maintain growth whilst accumulating high concentrations of Na+ in its leaves.
Activities of antioxidant enzymes involved in oxygen metabolism during salt stress may compensate for Na+
accumulation in the leaves of ‘Zard’. Also the high tissue tolerance of ‘Zard’ is likely to involve sequestration of Na+ into intracellular vacuoles and the
synthesis of compatible solutes that accumulate in the cytoplasm to balance the osmotic potential of the vacuolar Na+(Widodo et al., 2009).
In our study, salt stress led to a significant decrease in K+concentration in all cultivars. The increase in Na+
ion content and decrease in K+ion uptake disturbs ionic
imbalance as observed in most species exposed to salt stress (Khan and Panda, 2008). ‘Zard’ as the more tolerant cultivar may be better adapted to cope with decreased K+ levels in its leaves. Contents of certain amino acid have been observed to increase in arabidopsis leaves and roots when grown under K+
-deficient conditions. Increased levels of amino acids may act to balance the loss of charge due to the strongly reduced K+ levels in those plants (Armengaud et al.,
2009). In our study, the result shows that there is higher uptake of Na+ (600%) and lower uptake of K+ in
‘Amigdalifolia’ than other cultivars. High uptake and accumulation of Na+ and antagonistically low uptake,
translocation and accumulation of K+ could suppress
growth by decreasing the capacity of osmotic adjustment and turgor maintenance or by inhibiting metabolic activities (Khan and Panda, 2008). The
highest decrease of K+ which took place at the root suggests that olive is able to maintain relatively high K+
levels in young leaves, and this may act as the major monovalent cationic osmoticum in the presence of external salt (Chartzoulakis et al., 2002). Compared with other three cultivars, ‘Zard’ had significantly higher leaf K+ levels. Increasing evidence has shown
that K+ can involve osmotic adjustment of salt-stressed
plants (Wang et al., 2013). Concerning K+/Na+
selectivity, our data (Table 3) are consistent with previous studies, showing the presence of a strong relation between potassium and sodium uptake in plant performance under salinity (Ben Amor et al., 2005; Sharbatkhari et al., 2013). Thus, ‘Zard’ capacity to conserve K+ supply when Na+ is high in the medium
constitutes a key feature of its salinity tolerance, as reported by Ben Amor et al. (2005).
CONCLUSIONS
In summary, it seems that ‘Zard’ is salt tolerant ‘Shiraz’ and ‘Dakal’ are intermediate while ‘Amigdalifolia’ is the less tolerant one. Salt-tolerant cultivar ‘Zard’ exhibited a moderate increase in Na+ accumulation in the leaves even at high salinity level whereas the salt-sensitive cultivar, ‘Amigdalifolia’, exhibited high leaf Na+ accumulation resulting in indicators of oxidative
damage such as a small increase in SOD activity, an increase in EL, and decrease in RLCC. Our data confirmed that there are significant genotypic differences in salt tolerance among olive cultivars that seems to be partially related to the salt exclusion mechanisms at the root level, which prevent Na+ and/or
Cl¯ translocation to the above ground parts but more comprehensive studies are needed to more precisely investigate salt resistance of these olive genotypes.
ACKNOWLEDGEMENTS
The authors thank Mr. M. Baghbanha and Mr. R. Mohammadi for their valuable help with this experiment. This research was supported by Isfahan University of Technology.
REFERENCES
Agarwal, S., & Shaheen, R. (2007). Stimulation of antioxidant system and lipid peroxidation by abiotic stress in leaves of Momordica charantia. Brazilian Journal of Plant Physiology, 19, 149-161.
Armengaud, P., Sulpice, R., Miller, A. J., Stitt, M., Amtmann, A., & Gibon, Y. (2009). Multilevel analysis of primary metabolism provides new insights into the role of potassium nutrition for glycolysis and nitrogen
assimilation in Arabidopsis roots. Plant Physiology, 150, 772-785.
Asada, K. (2006). Production and scavenging of reactive oxygen species in chloroplasts and their functions. Plant Physiology, 141, 391-396.
Ashraf, M. (1994). Breeding for salinity tolerance in plants. Critical Review of Plant Sciences, 13, 17-42.
stability as a water stress tolerance test in durum wheat. Plant Growth Regulation, 36, 61-70.
Baum, S.F., Tran, P.N., & Silk, W. K. (2000). Effects of salinity on xylem structure and water use in growing leaves of sorghum. New Phytology, 146, 119-127.
Ben Amor, N., Ben Hamed, K., Debez, A., Grignon, C., & Abdelly, C. (2005). Physiological and antioxidant responses of the perennial halophyte Crithmum maritimum to salinity. Plant Science, 168, 889-899.
Bradford, M.M. (1976). A rapid and sensitive method for the quantification of microgram quantities of protein utilizing the principle of protein-dye binding. Annual Biochemistry, 72, 248-254.
Candan, N., & Tarhan, L. (2003). Relationship among chlorophyll-carotenoid content, antioxidant enzyme activities and lipid peroxidation levels by Mg2+ deficiency in the Mentha pulegium leaves. Plant Physiology and Biochemistry, 41, 35-40.
Chartzoulakis, K., Loupassaki, M., Bertaki, M., & Androulakis, I. (2002). Effects of NaCl salinity on growth, ion content and CO2 assimilation rate of six olive cultivars. Scientia Horticulturae, 96, 235-247.
Demiral, M.A., Aktas Uygun, D., Uygun, M., Kasirga, E., & Karagozler, A. A. (2011). Biochemical response of Olea europaea cv. Gemlik to short-term salt stress. Turkish Journal of Biology, 35, 433-442.
Dionisio-Sese, M.L., & Tobita, S. (1998). Antioxidant responses of rice seedlings to salinity stress. Plant Science, 135, 1-9.
Dubey, R.S. (2005). Photosynthesis in plants under stressful conditions. In M. Pessarakli (Ed.), Handbook of photosynthesis (pp. 717-718). New York: CRC Press. Erturk, U., Sivritepe, N., Yerlikaya, C., Bor, M., Ozdemir, F.,
& Turkan, I. (2007). Response of the cherry rootstock to salinity in vitro.Biologia Plantarum, 51, 597-600. Franklin, J.A., & Zwiazek, J. J. (2004). Ion uptake in Pinus
banksiana treated with sodium chloride and sodium sulphate. Physiologia Plantarum, 120, 482-490.
Gao, S., Ouyang, S., Wang, S., Xu, Y., Tang, L., & Chen, E. (2008). Effect of salt stress on growth, antioxidant enzyme and phenylalanine ammonia-lyase activities in Jatropha curcas L. seedlings. Plant Soil Environment, 54, 374-381 Goreta, S., Bucevic-Popovic, V., Pavela-Vrancic, M., &
Perica, S. (2007). Salinity-induced changes in growth, superoxide dismutase activity, and ion content of two olive cultivars. Journal of Plant Nutrition and Soil Science, 170, 398-403.
Jha, D., Shirley, N., Tester, M., & Roy, S.J. (2010). Variation in salinity tolerance and shoot sodium accumulation in Arabidopsis ecotypes linked to differences in the natural expression levels of transporters involved in sodium transport. Plant Cell Environment, 33, 793-804.
Kaya, C., Sonmez, O., AydemXr, S., & Dikilitas, M. (2013). Mitigation effects of glycinebetaine on oxidative stress and some key growth parameters of maize exposed to salt stress. Turkish Journal of Agriculture and Forestry, 37, 188-194.
Khan, M.H., & Panda, S.K. (2008). Alterations in root lipid peroxidation and antioxidative responses in two rice cultivars under NaCl-salinity stress. Acta Physiologia Plantarum, 30, 81-89.
Lutts, S., Kinet, J. M., & Bouharmon, J. (1996). NaCl induced senescence in leave of rice (Oryza sativa L.) cultivars differing in salinity resistance. Annual of Botany, 78, 389-398.
Mandhania, S., Madan, S., & Sawhney, V. (2006). Antioxidant defense mechanism under salt stress in wheat seedlings. Biologia Plantarum, 50, 227-231.
Marschner, H. (1995). Mineral nutrition of higher plants. (2nd ed.). London: Academic Press.
Meneguzzo, S., Navari-Izzo, F., & Izzo, R. (1999). Antioxidative responses of shoots and roots of wheat to increasing NaCl concentrations. Journal of Plant Physiology, 155, 274-280.
Menvielle-Bourg, F.J. (2005). Superoxide dismutase (SOD), a powerful antioxidant, is now available orally. Phototherapie, 3: 1-4.
Misra, N., & Gupta, A. K. (2006). Effect of salinity and different nitrogen sources on the activity of antioxidant enzymes and indole alkaloid content in Catharanthus roseus seedlings. Journal of Plant Physiology, 163, 11-18. Mousavi, A., Lessani, H., Babalar, M., Talaei, A.R., & Fallahi,
E. (2008). Influence of salinity on chlorophyll, leaf water potential, total soluble sugars, and mineral nutrients in two young olive cultivars. Journal of Plant Nutrition, 31, 1906-1916.
Munns, R., & Tester, M. (2008). Mechanisms of salinity tolerance. Annual Review of Plant Biology, 59, 651-681. Nebauer, S.G., Sanchez, M., Martinez, L., Lluch, Y.,
Renau-Morata, B., & Molina, R.V. (2013). Differences in photosynthetic performance and its correlation with growth among tomato cultivars in response to different salts. Plant Physiology and Biochemistry, 63, 61-69. Noreen, Z., Ashraf, M., & Akram, N.A. (2012). Salt-induced
regulation of photosynthetic capacity and ion accumulation in some genetically diverse cultivars of radish (Raphanus sativus L.). Journal of Applied Botany and Food Quality, 85, 91-96.
Omielon, J.A., Epistein, E., & Dvovak, J. (1991). Salt tolerance and ionic relations of wheat affected by individual chromosomes of salt tolerant Lophopyrum. Genome, 34, 961-974.
Parida, A.K., & Das, A.B. (2005). Salt tolerance and salinity effects on plants: a review. Ecotoxicology and Environment Safety, 60, 324-349.
Perica, S., Brkljaca, M., Goreta, S., Romic, D., & Romic, M. (2004). Vegetative growth and salt accumulation of six olive cultivars under salt stress. Acta Horticulture, 664, 555-560.
Perica, S., Goreta, S., & Vuletin Selak, G. (2008). Growth, biomass allocation and leaf ion concentration of seven olive (Olea europaea L.) cultivars under increased salinity. Scientia Horticulturae, 117, 123-129.
Rodriguez, R., & Sanches, T. R. (1982). Peroxidase and IAA oxidase in germinating seeds of Cicer arientium L. Revista Espanola De Fisiologia, 38, 183-188.
Sepaskhah, A.R., & Yarami, N. (2010) Evaluation of macroscopic water extraction model for salinity and water stress in saffron yield production. International Journal of Plant Production, 4, 175-186.
Sharbatkhari, M., Galeshi, S., Shobbar, Z.S., Nakhoda, B., & Shahbazi, M. (2013). Assessment of agro-physiological traits for salt tolerance in drought-tolerant wheat genotypes. International Journal of Plant Production, 7, 437-454.
Sharma, N., Gupta, K., Gupta, S., & Hasegawa, H. (2005). Effect of NaCl salinity on photosynthetic rate, transpiration rate, and oxidative stress tolerance in contrasting wheat genotypes. Photosynthetica, 43, 609-613.
69
of foxtail millet (Setaria italica). Physiologia Plantarum,109, 435-442.
Tavakkoli, E., Fatehi, F., Coventry, S., Rengasamy, P., & McDonald, K. (2011). Additive effects of Na+and Cl-ions on barely growth under salinity stress. Journal of Experimental Botany, 62, 2189-2203.
Tavakkoli, E., Rengasamy, P., & McDonald, G.K. (2010). High concentrations of Na+ and Cl-ions in soil solution have simultaneous detrimental effects on growth of faba bean under salinity stress. Journal of Experimental Botany, 61, 4449-4459.
Van Rossun, M.W.P.C., Alberda, M., & Van Der Plas, L.H.W. (1997). Role of oxidative damage in tulip bulb scale micropropagation. Plant Science, 130, 207-216.
Wang, M., Zheng, Q., Shen, Q., & Guo, S. (2013). The critical role of potassium in plant stress response. International Journal of Molecular Sciences, 14, 7370-7390.
Widodo, P.J.H., Newbigin, E., Tester, M., Bacic, A., & Roessner, U. (2009). Metabolic responses to salt stress of barley (Hordeum vulgare L.) cultivars, Sahara and Clipper, which differ in salinity tolerance. Journal of Experimental Botany, 60, 4089-4103.
Yadav, S., Irfan, M., Ahmad, A., & Hayat, S. (2011). Causes of salinity and plant manifestations to salt stress: A review. Journal of Environmental Biology, 32, 667-685. Young, C., & Jung, J. (1999). Water deficit-induced oxidative
70
)
1394
(
34
)
2
(
61
-70
!"
# $
$
%
&'$
(
)*
+
, - . / 0
(
(
1
23
&$
45 6
+
7
*
28$
9 : ;<=
: ;<=
7>3=
? @ A +
:
? , A +
: A BC $
D EF
.
.
*
H IJ ? 3J A
!"
-7
(Olea europaea L.)
K $ ,
?+ 7LJ! M L
+? L L7# +M L
N5
.
) /A%N . >0 /735 70: C BO +& P
7A% (
L7 )L* ;Q + J
) ’
S +
‘
:
’
1
‘
:
’
+
‘ ’
. < . @ %
‘ (
+ U 123 O +
ML M L$&L'$ $ V $+ 1
!"
WXU (
NL0 ! * 5 $+ ) 5 76 ) 5 (
.
&LA 8E!Y L1 + L( ! +
1 X ;QZ >
) 0
:
100
:
150 200
) 5 E \ E
(
370 ! *
.
L( ! X
]'5 $ 7
2( ^F $: 1 \ $ (
L _ L> :/73L5 70:` L$ BLJASL 0 E
1& ` $) 5 76
.
) /A%N . >0) 5 E 23
+ J 6 XJ + J 6 5 (
` $
+ +2 /0 7 (
.
` L$ +) L5 L NaEC:b # +) 5 E NaEC2 /0 $
L(
&
N0 2 /0 (
.
+ <
)L* +) L5 W0+)J A ,
:&L>. ' + L L7 L(
%SX / + < cB5
L1 123 &$ (
.
)L*
’
+
‘
&L$ + ;L c L5%d L( L$
H E5 NaEC&$ SX M 7 $: (
+ + A+ # eXA \ $ (
.
L!" M L$&'$
+ L L(
WXU 23 &$45 6 +&>. ' + (
` $
& (
)* (
+ L SL Lf&L$ L7 (
N0 ! *^ $
.
$ %
&
'
$ % () * +
:
N0 +4
: 26 / 1 / 1393
K i64
: 8 / 4 / 1394
5 75+4
: 28 / 9 / 1394
- . /
:
) /A% J 7A%
WXU 7
/735 70 ( 7 6