R E S E A R C H A R T I C L E
Open Access
Bias-corrected estimator for intraclass
correlation coefficient in the balanced
one-way random effects model
Eshetu G Atenafu
1†, Jemila S Hamid
2,4†, Teresa To
3,4,5, Andrew R Willan
3,4,
Brian M Feldman
3,4,5and Joseph Beyene
2,3,4,5*Abstract
Background: Intraclass correlation coefficients (ICCs) are used in a wide range of applications. However, most commonly used estimators for the ICC are known to be subject to bias.
Methods: Using second order Taylor series expansion, we propose a new bias-corrected estimator for one type of intraclass correlation coefficient, for the ICC that arises in the context of the balanced one-way random effects model. A simulation study is performed to assess the performance of the proposed estimator. Data have been generated under normal as well as non-normal scenarios.
Results: Our simulation results show that the new estimator has reduced bias compared to the least square estimator which is often referred to as the conventional or analytical estimator. The results also show marked bias reduction both in normal and non-normal data scenarios. In particular, our estimator outperforms the analytical estimator in a non-normal setting producing estimates that are very close to the true ICC values.
Conclusions: The proposed bias-corrected estimator for the ICC from a one-way random effects analysis of variance model appears to perform well in the scenarios we considered in this paper and can be used as a motivation to construct bias-corrected estimators for other types of ICCs that arise in more complex scenarios. It would also be interesting to investigate the bias-variance trade-off.
Background
The intraclass correlation coefficient (ICC), often denoted byρ, was first introduced by Fisher [1] to study the familial resemblance between siblings. Since then it has obtained a wide range of applications in many areas such as psychol-ogy, epidemiolpsychol-ogy, genetics and genomics. See Donner [2] for an extensive review of inference procedures. In psy-chology, it plays a fundamental role in studying inter-rater reliability [3,4]. It is used as a measure of heritability in classical genetic linkage studies to quantify the propor-tion of variance in traits of interest explained by genetic factors [5]. Intraclass correlation obtained from genome-wide association data has recently been used to provide
*Correspondence: [email protected]
†Equal contributors
2Department of Clinical Epidemiology and Biostatistics, McMaster University, Hamilton, Canada
3Child Health Evaluative Sciences Hospital for Sick Children,Toronto, Canada Full list of author information is available at the end of the article
a better estimate of heritability [6] . Sensitivity analysis is another application whereρ may be used as a means of investigating the effectiveness of an experimental treat-ment [7]. The intraclass correlation has also found some interesting application in genomics where it has been used to assess methodological and biological variations in DNA microarray analysis [8].
The intraclass correlation coefficient also plays a key role in study design such as design of cluster randomized trials where it is traditionally used to quantify the degree of similarity between individuals within clusters [9,10].
Over the last decade, ICCs have received more attention in the literature and there has been an increasing aware-ness and appreciation of methodological issues related to these indices [11-13].
The most fundamental interpretation of ICCs is as a measure of the proportion of variance of a given outcome
variable explained by a factor of interest in an analysis of variance model where it measures the relative homo-geneity within groups [14,15]. The first and essential step, therefore, is to specify an appropriate analysis of variance (ANOVA) model that best describes the study. The choice of the model is dictated by the specific situation defined by the experimental design and conceptual intent of the study [15]. Moreover, various forms of ICCs arise depending on the chosen model and the nature of the study [16,17].
For reasons mentioned above, inference procedures for ρare closely related to the more general statistical prob-lem of variance components [14,18]. It is well known that estimation and hypothesis testing procedures for ICCs are, in general, sensitive to the assumption of normality and are subject to unstable variance [1,19]. One, therefore, needs to consider normalizing and variance-stabilizing transformations on the basis of the rate of convergence to normality when constructing confidence intervals for the ICC. One of the well known and most commonly used normalization technique is Fisher’s Z transformation [1]. Other types of transformations have also been considered for the intraclass correlation coefficient [19,20].
Another important issue concerning ICCs is bias [21,22]. The two most commonly used estimators, max-imum likelihood and least square estimators, are known to be negatively biased. Although a Minimum Variance Unbiased (MVU) estimator for the intraclass correlation coefficient under two normal distributions is derived by [23], use of this estimator has been hindered because of absence of a closed form. Consequently, the MVU esti-mator is less widely recognized while the least square and maximum likelihood estimators are well-known. A com-putationally intensive FORTRAN subroutine is provided by Donoghue and Collins (1990).
The purpose of this paper is, therefore, to provide a bias-corrected estimator for the intraclass correlation coefficient which is much simpler to compute and hence useful in practice. We consider a particular type of ICC in which we consider the estimation problem for ICC result-ing from a one-way random effects analysis of variance model. We approximate the bias using a second-order Taylor series expansion and adjust the estimator to reduce the bias.
The paper is organized as follows. We provide a brief background about the one-way random effects model and define the particular ICC of interest in Section “Methods ’’. In Section “Bias-corrected estimator for the intraclass cor relation coefficient”, we propose a technique for approxi-mating the bias resulting from the conventional estimator of ρ and we derive a new bias-corrected estimator for the parameter. We present simulation results in Section “Simulation Study ’’ and provide a brief discussion in Section “Discussion”. Finally an Appendix consisting of some technical results is given at the end of the paper.
Methods
Consider ntargets measured by k raters (instruments, judges etc.). A commonly used model for inferences con-cerning the intraclass correlation coefficient is the one-way random effects analysis of variance model where the jthtarget measurement by theithrater (j= 1, 2, . . . ,n; i = 1, 2, . . . ,k) can be described as
Yij=μ+ai+eij (1)
where it is assumed thatai∼N(0,σT2), eij∼N(0,σe2).
The total sum of squares (Total SS) for the above model can be decomposed into two independent components as follows
n
i=1
k
j=1
(Yij− ¯Y..)2= n
i=1
k
j=1
(Yij− ¯Yi.)2+
n
i=1
k
j=1
(Y¯i.− ¯Y..)2
Total SS=SSE+SSB,
(2)
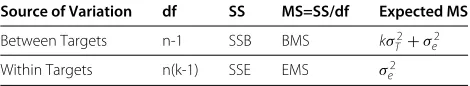
where SSE and SSB represent the within and between target sum of squares, respectively. The above decom-position is summarized in the analysis of variance table provided in Table 1. The table shows the source of varia-tion, degrees of freedom (df ), sums of squares (SS), mean square (MS), and expected mean square. We refer the reader to any standard analysis of variance text book [24] for details about this model.
The intraclass correlation coefficient for the model in (1) is defined as
ρ= σ
2
T
σT2+σ2
e
. (3)
The most commonly used estimator forρ, which is some-times referred to as the analytical estimator, is given by
ˆ ρ= σˆ
2
T
ˆ σT2+ ˆσ2
e
= BMS−EMS
BMS+(k−1)∗EMS. (4)
Note that,
• EMS is an unbiased estimator ofσe2
• (BMS-EMS)/k is an unbiased estimator ofσT2
Although the estimator in (4) is a ratio of unbiased estimators, it need not necessarily be unbiased itself. We consider the bias resulting from this estimator in the next section and provide a new bias-corrected estimator for the intraclass correlation coefficient.
Table 1 Analysis of variance table for one-way random effects model
Source of Variation df SS MS=SS/df Expected MS
Between Targets n-1 SSB BMS kσT2+σe2
Bias-corrected estimator for the intraclass correlation coefficient
Consider the intraclass correlation coefficient defined in (3) and re-write it as
ρ=
σT2 σ2 e
1+ σT2 σ2 e
= F
1+F. (5)
An unbiased estimator for F is provided in the follow-ing theorem, which is useful in approximatfollow-ing the bias for estimating intraclass correlation coefficient. The variance of is also given in the theorem. The theorem has been considered by [25] in a different context.
Theorem 1.Consider F= σT2 σ2
e in equation (5), then
ˆ
F= [n(k−1)−2]∗SSB/SSE−(n−1) k(n−1)
is an unbiased estimator for F. Moreover, its variance is given by
Var(Fˆ)=
n(k−1)−2 k2(n−1)
×
n+1 n(k−1)−4−
n−1 n(k−1)−2
(kF+1)2
A proof of the theorem is provided in the Appendix. Let us now consider the following estimator for the intraclass correlation coefficient which is derived by sub-stituting the unbiased estimator for F given in Theorem 1.
˜ ρ= Fˆ
ˆ
F+1, (6)
As mentioned earlier, the estimator,ρ˜, in (6) need not be unbiased although it is a function of unbiased estima-tors. In fact, the bias is always negative and depends on the degree of correlation and the design size and balance [21]. Now consider (5) and apply log transformation on both sides. The equation reduces to
logρ=logF−log(F+1).
An estimator for logρ, which is obtained by substituting F by its unbiased estimator, can be given as
logρ=logFˆ−log(Fˆ+1).
Note that the above estimator is equivalent to logρ˜. The bias, in log scale can, therefore, be given as
E[ logρ˜−logρ]=E[ logFˆ −logF]
−E[ log(Fˆ +1)−log(F+1)] .
Using a second order Taylor series approximation, we have
logFˆ ≈logF+ 1
F(Fˆ−F)− 1
2F2(Fˆ−F) 2
log(Fˆ +1)≈log(F+1)+ 1
F+1(Fˆ−F)
− 1
2(F+1)2(Fˆ−F) 2.
Consequently, the bias can be approximated as
E[ logρ˜−logρ]≈ −1 2
1 F2 −
1 (F+1)2
Var(Fˆ) (7)
It is important to note that the above approximation for the bias is always negative indicating that we are cor-recting the estimator from the right direction. A bias-corrected estimator for logρis obtained by adjusting for the bias given in (7) and is given by
logρbc=logρ˜+ 1 2
1 ˆ
F2−
1 (Fˆ+1)2
Var(Fˆ),
where the subscript bc indicates that the estimator is bias corrected. Var(Fˆ) is an estimator for the Var(Fˆ) obtained by substituting F in Var(Fˆ) by Fˆ. We obtain a bias-corrected estimator for the intraclass correlation coefficient by transforming the above equation back to the original scale, and it is given by
ˆ
ρbc= ˜ρ∗exp
1 2
1 ˆ
F2−
1
(Fˆ+1)2
VarFˆ
(8)
In situations where F is small, we consider Taylor expan-sion of 1−ρinstead. Consequently,
ˆ
ρbc=1−(1− ˜ρ)∗exp
− 1
2(Fˆ +1)2Var(Fˆ)
.
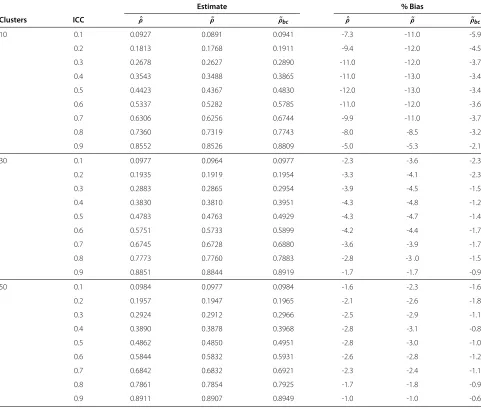
Table 2 Simulation results for the non-normal data
Estimate % Bias
Clusters ICC ρˆ ρ˜ ρ˜bc ρˆ ρ˜ ρ˜bc
10 0.1 0.0927 0.0891 0.0941 -7.3 -11.0 -5.9
0.2 0.1813 0.1768 0.1911 -9.4 -12.0 -4.5
0.3 0.2678 0.2627 0.2890 -11.0 -12.0 -3.7
0.4 0.3543 0.3488 0.3865 -11.0 -13.0 -3.4
0.5 0.4423 0.4367 0.4830 -12.0 -13.0 -3.4
0.6 0.5337 0.5282 0.5785 -11.0 -12.0 -3.6
0.7 0.6306 0.6256 0.6744 -9.9 -11.0 -3.7
0.8 0.7360 0.7319 0.7743 -8.0 -8.5 -3.2
0.9 0.8552 0.8526 0.8809 -5.0 -5.3 -2.1
30 0.1 0.0977 0.0964 0.0977 -2.3 -3.6 -2.3
0.2 0.1935 0.1919 0.1954 -3.3 -4.1 -2.3
0.3 0.2883 0.2865 0.2954 -3.9 -4.5 -1.5
0.4 0.3830 0.3810 0.3951 -4.3 -4.8 -1.2
0.5 0.4783 0.4763 0.4929 -4.3 -4.7 -1.4
0.6 0.5751 0.5733 0.5899 -4.2 -4.4 -1.7
0.7 0.6745 0.6728 0.6880 -3.6 -3.9 -1.7
0.8 0.7773 0.7760 0.7883 -2.8 -3 .0 -1.5
0.9 0.8851 0.8844 0.8919 -1.7 -1.7 -0.9
50 0.1 0.0984 0.0977 0.0984 -1.6 -2.3 -1.6
0.2 0.1957 0.1947 0.1965 -2.1 -2.6 -1.8
0.3 0.2924 0.2912 0.2966 -2.5 -2.9 -1.1
0.4 0.3890 0.3878 0.3968 -2.8 -3.1 -0.8
0.5 0.4862 0.4850 0.4951 -2.8 -3.0 -1.0
0.6 0.5844 0.5832 0.5931 -2.6 -2.8 -1.2
0.7 0.6842 0.6832 0.6921 -2.3 -2.4 -1.1
0.8 0.7861 0.7854 0.7925 -1.7 -1.8 -0.9
0.9 0.8911 0.8907 0.8949 -1.0 -1.0 -0.6
Simulation Study
We carried out extensive simulations to evaluate the per-formance of our bias-corrected estimator(ρ˜bc). The bias resulting from our estimator is compared with bias from the conventional (analytical) estimator using normal as well as non-normal data. It is to be recalled that we based the Taylor expansion aroundρ˜which a variant of the con-ventional estimator. We have, therefore, provided the bias resulting from this estimator for comparison purposes.
Simulation Design
Data were simulated as in [10], with slight modifica-tions to the number of configuramodifica-tions that were allowed to vary. We used 3x8x2 design instead of their 3x4x2 configuration. That is, we considered 3 cluster sizes (10,30,50); 8 intraclass correlation coefficients (0.2, 0.3,
0.4, 0.5, 0.6, 0.7, 0.8, 0.9) instead of only 4 true ICC values used in [10]; and two types of data distributions (normal versus non-normal), for a total of 48 simulation configurations.
For normal outcome, data were simulated according to the framework of the one-way random effects model described in Section “Methods ’’. They were generated as the sum of two independent random variables ai ∼
N(0,σT2) and eij ∼ N(0,σe2) . When simulating
non-normal outcome, the eij alone were generated from a
normal distribution with theaigenerated from a Gamma
distribution with shape parameter α = 1.67 and scale parameter β =
√
var
α so that skewness of the distri-bution will be α2 = 1.2 and a kurtosis coefficient of
6
kurtosis coefficients for a normally distributed random variable are 0 and 3, respectively.
Without loss of generality, the overall mean was fixed at 10. Moreover, the sum of the variance components was constrained to be 1000, for both normal and non-normal data sets. The two variances, σT2 and σe2, were then systematically manipulated to generate data from a pop-ulation with the required ICC value using the following relationship
σT2+σe2=1000, ρ= σ 2
T
σT2+σ2
e
⇒ σT2=1000∗ρ
and σT2=1000−σe2
We simulated 5000 replications of data for each of the 48 scenarios. Different seeds were used for the random
number generator at each replication while keeping it the same across different methods.
Results
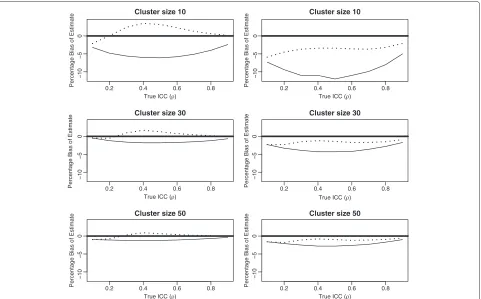
Estimates of ICC along with percentage of bias for non-normal and non-normal data, averaged over 5000 simulations, are summarized in Table 2 and Table 3, respectively. As expected, the bias resulting from the analytical estima-tor is negative both for normal and non-normal data sets. Moreover, the bias gets smaller as the true value of ρ moves further away from 0.5 (see Figure 1). Furthermore, the biases resulting from the conventional estimator (ρˆ) and its variant (ρ˜) for the non-normal sample are larger relative to the normal sample indicating that the estimator is sensitive to the normality assumption. The difference is much larger for small cluster sizes. For cluster size 10 from the non-normal data with moderate correlation
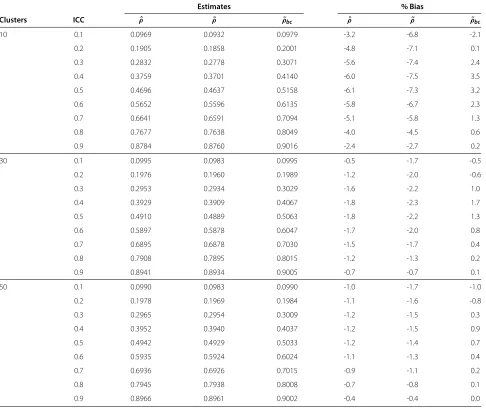
Table 3 Simulation results for the normal data
Estimates % Bias
Clusters ICC ρˆ ρ˜ ρ˜bc ρˆ ρ˜ ρ˜bc
10 0.1 0.0969 0.0932 0.0979 -3.2 -6.8 -2.1
0.2 0.1905 0.1858 0.2001 -4.8 -7.1 0.1
0.3 0.2832 0.2778 0.3071 -5.6 -7.4 2.4
0.4 0.3759 0.3701 0.4140 -6.0 -7.5 3.5
0.5 0.4696 0.4637 0.5158 -6.1 -7.3 3.2
0.6 0.5652 0.5596 0.6135 -5.8 -6.7 2.3
0.7 0.6641 0.6591 0.7094 -5.1 -5.8 1.3
0.8 0.7677 0.7638 0.8049 -4.0 -4.5 0.6
0.9 0.8784 0.8760 0.9016 -2.4 -2.7 0.2
30 0.1 0.0995 0.0983 0.0995 -0.5 -1.7 -0.5
0.2 0.1976 0.1960 0.1989 -1.2 -2.0 -0.6
0.3 0.2953 0.2934 0.3029 -1.6 -2.2 1.0
0.4 0.3929 0.3909 0.4067 -1.8 -2.3 1.7
0.5 0.4910 0.4889 0.5063 -1.8 -2.2 1.3
0.6 0.5897 0.5878 0.6047 -1.7 -2.0 0.8
0.7 0.6895 0.6878 0.7030 -1.5 -1.7 0.4
0.8 0.7908 0.7895 0.8015 -1.2 -1.3 0.2
0.9 0.8941 0.8934 0.9005 -0.7 -0.7 0.1
50 0.1 0.0990 0.0983 0.0990 -1.0 -1.7 -1.0
0.2 0.1978 0.1969 0.1984 -1.1 -1.6 -0.8
0.3 0.2965 0.2954 0.3009 -1.2 -1.5 0.3
0.4 0.3952 0.3940 0.4037 -1.2 -1.5 0.9
0.5 0.4942 0.4929 0.5033 -1.2 -1.4 0.7
0.6 0.5935 0.5924 0.6024 -1.1 -1.3 0.4
0.7 0.6936 0.6926 0.7015 -0.9 -1.1 0.2
0.8 0.7945 0.7938 0.8008 -0.7 -0.8 0.1
Cluster size 10
Cluster size 30
Cluster size 50
Cluster size 10
Cluster size 30
Cluster size 50
Figure 1Plot of the percentage bias against the true value of ICC for the normal (left panel) and non-normal (right panel) data sets, where solid line and dashed line represent the analytical and bias-corrected estimators, respectively.
(ρ = 0.4, 0.5, 0.6), for example, the analytical estimator and its variant gave about 12% and 13% bias, respectively. However, the corresponding biases for normal data with the same cluster size and similarρvalues are 6% and 7%, respectively. It is, therefore, not recommended to use the analytical estimator for non-normal data, especially when there is moderate correlation. It is also important to note that the bias resulting fromρˆ is uniformly smaller than that of ρ˜ where the difference is much larger for small cluster sizes.
In general, a considerable bias reduction has been obtained by using our bias-corrected estimator. This is true for all values ofρ and all cluster sizes although the improvement is much larger for moderate correlations (see Figure 1). Moreover, the improvement obtained for the non-normal sample is relatively larger than that obtained for the normal sample. For the non-normal sample, for instance, using the conventional estimator resulted in 12% bias whereas only 3.4% bias was obtained from our estimator for cluster size 10 and moderate correlations. For the normal sample and the same sce-nario, biases resulting from the conventional estimator and the bias-corrected estimator are 6% and 3%, respec-tively. Improvements are also obtained for small or large ρ values, that is, in situations where the bias from the
conventional estimator is small. For instance, for cluster size 10 from the non-normal sample withρ = 0.2, 9.4% and 12% biases were obtained usingρˆandρ˜, respectively, whereas only 4.5% bias was observed for our estimator. For the normal sample with the same cluster size and correlation,ρˆ andρ˜resulted in 4.8% and 7.1% biases. In this situation, the bias reduced to 0.05% when using our bias corrected estimator. Similar statements can be made for large ICC values.
Discussion
Because ICC estimates have great implications to design considerations, statistical analysis as well as interpretation of study findings, it is critical to use an estimator with minimal bias.
In this paper, we proposed a new bias-corrected esti-mator for one type of intraclass correlation coefficient. We used a variant of the conventional estimator (ANOVA estimator) and applied Taylor series expansion to approx-imate the bias. The approxapprox-imate bias was then used and a new adjusted estimator is proposed. The bias-corrected estimator proposed in this paper is much simpler to compute than the minimum variance unbiased (MVU) estimator of Olkin and Pratt [23]. Moreover, our simulation study shows that our estimator outperforms the conventional estimator by providing a substantial decrease in the bias. For small cluster sizes from normal data, however, a positive bias was introduced although the percentage bias resulted from our estimator is still smaller than that of the ANOVA estimator. This might be improved by using second order Taylor series expan-sion instead of using only the first order adopted in this paper.
Conclusion
We considered a particular type of intraclass correlation coefficient that arises from a one-way random effects analysis of variance model, although the method can be extended to provide bias-corrected estimators for other types of ICCs. Furthermore, the current paper is focused on bias reduction in a balanced data setting, and we plan to investigate other optimality measures as well as the performance of the bias-corrected method for unbalanced data when the number of observations differ from cluster to cluster. Finally, we would like to high-light that ICCs are subject to different interpretations, so the user should apply the various ICCs with caution [17,26-28].
Appendix
Recall from the one-way ANOVA model SSB
kσT2+σ2
e ∼
χ2
(n − 1). Therefore, one can easily show that E[SSB]= (n−1)(kσT2 +σe2) and E[SSB]2= (n−1)(n+1) [kσT2 +σe2]2 Moreover,SSE/σe2 ∼ χ2(n(k−1)) =
Gamman(k2−1), 2 . Consequently,
E ⎡ ⎣ 1 SSE σ2 e ⎤ ⎦=E
σe2
SSE
2−1(n(k−1)/2−1) (n(k−1)/2)
= 1
n(k−1)−2
Which implies thatESSE1 = σ2 1 e[n(k−1)−2].
Moreover, E SSE σ2 e
−22−2(n(k−1)/2−2)
(n(k−1)/2)
= 1
[n(k−1)−2] [n(k−1)−4] As a result we have,
E 1 SSE 2 = 1 (σ2
e)2[n(k−1)−2] [n(k−1)−4]
Now applying results from [24], we get
E SSB SSE = E SSB 1 SSE
=E[SSB]∗E
1 SSE
= (n−1)(kσT2+σe2)
[n(k−1)−2]σ2
e
= (n−1)
n(k−1)−2
kσ 2 T σ2 e +1
After a simple algebraic manipulations, we can show that
E[Fˆ]= 1 k
n(k−1)−2
n−1 E
SSB SSE −1
= σT2
σ2
e
which proves the first part of the theorem. Now consider,
E
SSB
SSE
2
=E[SSB]2∗E
1
SSE
2
=[n (n−1)(n+1)
(k−1)−2] [n(k−1)−4]
kσT2+σe2 σ2 e 2 Consequently, Var SSB SSE =
(n−1)(n+1) [n(k−1)−2] [n(k−1)−4]
−
n−1 n(k−1)−2
2 kσ2
T+σe2
σ2
e
2
Note thatkσT2+σe2 σ2
e =k
σT2 σ2 e
+1=kF+1 The variance is given as
Var(Fˆ)=
n(k−1)−2 k2(n−1)
×
n+1 n(k−1)−4−
n−1 n(k−1)−2
(kF+1)2
Competing interests
The authors declare that they have no competing interests.
Authors’ contributions
Acknowledgements
We would like to gratefully acknowledge a seed grant support provided by the Research Institute of the Hospital for Sick Children, Toronto, Ontario, Canada.
Author details
1Princess Margaret Hospital, Toronto, Canada.2Department of Clinical
Epidemiology and Biostatistics, McMaster University, Hamilton, Canada.3Child
Health Evaluative Sciences Hospital for Sick Children,Toronto, Canada.
4Division of Biostatistics, Dalla Lana School of Public Health, University of
Toronto, Toronto, Canada.5Departments of Pediatrics, Health Policy and
Management, University of Toronto, Toronto, Canada.
Received: 15 August 2011 Accepted: 18 July 2012 Published: 20 August 2012
References
1. Fisher RA:On the “probable error” of a coefficient of correlation deduced from a small sample.Metron1921,1:1–32.
2. Donner A:A review of inference procedures for the intraclass correlation coefficient in the one-way random effects model.Int Stat Rev1986,54:67–82.
3. Cronbach LJ, Gleser GC, Nanda H, Rajaratnam N:The dependability of behavioral measurements: theory of generalizability od scores and profiles. New York: Wiley; 1972.
4. Ebel RL:Estimation of the reliability of ratings.Psychometrika1951, 16:407–424.
5. Visscher PM:On the sampling variance of intraclass correlations and genetic correlation.Genetics1998,149:1605–1614.
6. Visscher PM,et al:Assumption-free estimation of heritability from genome-wide identity-by-descent sharing between full sibilings.
PLoS Genet2006,2(3):e41.
7. Bradley RA, Schumann DEW:The comparison of the sensitivities of similar experiments: applications.Biometrics1957,13:496. 8. Pellis L, Hal NL, von Burema J, Keijer J:The intraclass correlation
coefficient applied for evaluation of data correction, labeling methods, and rectal biopsy sampling in DNA microarray experiments.Physiol Genomics2003,16:99–106.
9. Killip S, Mahfoud Z, Pearce K:What is an intracluster correlation coefficient? Crucial concepts for primary care researchers: crucial concepts for primary care researchers.Ann Family Med2003, 2(3):204–208.
10. Ukoumunne et al:Non parametric bootstrap confidence intervals for the correlation coefficient.Stat Med2003,22:3805–3821.
11. Altaye M, Donner A, Klar N:Inference procedures for assessing interobserver agreement among multiple raters.Biometrics2001, 457:584–588.
12. Ghosh H, Das A:Optimal diallel cross designs for estimation of heritability.J Stat Planning and Inference2003,116(1):185–196. 13. Shoukri MM, Donner A:Efficiency considerations in the analysis of
inter-observer agreement.Biostatistics2001,2:321–336.
14. Fisher RA:Statistical Methods for Research Workers. Edinburgh: Oliver and Boyd; 1925.
15. Shrout PE, Fleiss JL:Intraclass correlations: uses in assessing rater reliability.Psychological Bull1979,86:420–428.
16. Fleiss JL, Cohen J:The equivalence of weighted kappa and the intraclass correlation coefficient as measures of reliability.
Educational and Psychological Meas1973,33:613–619.
17. M ¨uller R, B ¨uttner P:A critical discussion of intraclass correlation coefficients.Stat Med1994,13:2465–2476.
18. Snedecor GW:Statistical Methods. 4th edition. Ames: The Iowa State University Press; 1946.
19. Konishi S:Normalizing and variance stabilizing transformations for intraclass correlation.Ann Inst Statist Math1985,37:Part A 87–94. 20. Weinberg R, Patel YC:Simulated intraclass correlation coefficients
and their z transforms.J Stat Comput Simul1981,13:13–26.
21. Wang CS, Yadell BS, Rutledge JJ:Bias of maximum likelihood estimator of intraclass correlation.Theor Appl Genet1991,82:421–424.
22. Ponzoni RW, James JW:Possible biases in heritability estimates from intraclass correlation.Theor Appl Genet1978,53:25–27.
23. Olkin I, Pratt W:Unbiased estimation of certain correlation coefficients.Ann Mathamatical Stat1958,29:201–211.
24. Snedecor GW, Cochran WG:Statistical Methods. 17th edition. Ames: The Iowa State University Press; 1980.
25. Das A, Ghosh H:Estimation of the ratio of variance components and optimal diallel cross over designs.Indian Statistical Institute2003. Technical Report .
26. Barnhart HX, Haber MJ, Lin LI:An overview on assessing agreement with continuous measurements.J Biopharmaceutical Stat2007, 17:529–569.
27. Chen CC, Barnhat HX:Comparison of ICC and CCC for assessing agreement for data without and with replications.Comput Stat Data Anal2008,53:554–564.
28. Costa-Santos C, Bernardes J, Ayres-De-Campos D, Costa A, Costa C:The limits of agreement and the intraclass correlation coefficient may be inconsistent in the interpretation of agreement.J Clin Epidemiol
2011,64:264–269.
doi:10.1186/1471-2288-12-126
Cite this article as:Atenafuet al.:Bias-corrected estimator for intraclass cor-relation coefficient in the balanced one-way random effects model.BMC Medical Research Methodology201212:126.
Submit your next manuscript to BioMed Central and take full advantage of:
• Convenient online submission
• Thorough peer review
• No space constraints or color figure charges
• Immediate publication on acceptance
• Inclusion in PubMed, CAS, Scopus and Google Scholar
• Research which is freely available for redistribution