R E S E A R C H A R T I C L E
Open Access
Anti-leucine rich glioma inactivated 1 protein and
anti-N-methyl-D-aspartate receptor encephalitis
show distinct patterns of brain glucose metabolism
in
18
F-fluoro-2-deoxy-d-glucose positron emission
tomography
Florian Wegner
1*, Florian Wilke
2, Peter Raab
3, Said Ben Tayeb
1, Anna-Lena Boeck
1, Cathleen Haense
4,
Corinna Trebst
1, Elke Voss
1, Christoph Schrader
1, Frank Logemann
5, Jörg Ahrens
5, Andreas Leffler
5,
Rea Rodriguez-Raecke
1, Reinhard Dengler
1, Lilli Geworski
2, Frank M Bengel
4, Georg Berding
4, Martin Stangel
1and Elham Nabavi
4Abstract
Background:Pathogenic autoantibodies targeting the recently identified leucine rich glioma inactivated 1 protein and the subunit 1 of the N-methyl-D-aspartate receptor induce autoimmune encephalitis. A comparison of brain metabolic patterns in18F-fluoro-2-deoxy-d-glucose positron emission tomography of anti-leucine rich glioma inactivated 1 protein and anti-N-methyl-D-aspartate receptor encephalitis patients has not been performed yet and shall be helpful in differentiating these two most common forms of autoimmune encephalitis.
Methods:The brain18F-fluoro-2-deoxy-d-glucose uptake from whole-body positron emission tomography of six anti-N-methyl-D-aspartate receptor encephalitis patients and four patients with anti-leucine rich glioma inactivated 1 protein encephalitis admitted to Hannover Medical School between 2008 and 2012 was retrospectively analyzed and compared to matched controls.
Results:Group analysis of anti-N-methyl-D-aspartate encephalitis patients demonstrated regionally limited hypermetabolism in frontotemporal areas contrasting an extensive hypometabolism in parietal lobes, whereas the anti-leucine rich glioma inactivated 1 protein syndrome was characterized by hypermetabolism in cerebellar, basal ganglia, occipital and precentral areas and minor frontomesial hypometabolism.
Conclusions:This retrospective18F-fluoro-2-deoxy-d-glucose positron emission tomography study provides novel evidence for distinct brain metabolic patterns in patients with anti-leucine rich glioma inactivated 1 protein and anti-N-methyl-D-aspartate receptor encephalitis.
Keywords:Anti- leucine rich glioma inactivated 1 protein (LGI1), Anti- N-methyl-D-aspartate (NMDA) receptor antibody, Paraneoplastic syndrome, Autoimmune limbic encephalitis, Brain glucose metabolism,18F-fluoro-2-deoxy-d-glucose positron emission tomography (FDG-PET)
* Correspondence:[email protected]
1
Department of Neurology, Hannover Medical School, Carl-Neuberg-Str. 1, 30625 Hannover, Germany
Full list of author information is available at the end of the article
Background
Limbic encephalitis involving the temporomedial lobes and amygdalae is characterized by subacute memory im-pairment, seizures and neuropsychiatric symptoms with variable evidence of cerebrospinal fluid inflammation, anti-neuronal antibodies and a paraneoplastic origin [1-4].
The two most common targets of encephalitis associ-ated pathogenic autoantibodies are the recently identified leucine rich glioma inactivated 1 protein (LGI1), which is extracellularly complexed with voltage-gated potassium channels (VGKC), and the subunit 1 (NR1) of the N-methyl-D-aspartate (NMDA) receptor [5-8]. LGI1 anti-bodies associated with limbic encephalits specifically inhibited the ligand-receptor interaction between LGI1 and ADAM22 (disintegrin and metalloproteinase domain-containing protein 22) and reversibly reduced synaptic AMPA (α -amino-3-hydroxy-5-methyl-4-isoxazolepropio-nic acid) receptor clusters in rat hippocampal neurons [9]. Cerebrospinal fluid samples or purified immunoglobulin G (IgG) from patients with anti-NMDA receptor enceph-alitis led to a marked reduction of NR1 (and NR2B) sur-face expression and NMDA receptor mediated currents in hippocampal cultures [10,11] as well as to increased corti-comotor hyperexcitability in rats [12,13].
While the anti-LGI1 syndrome predominantly reminds of a classic limbic encephalitis with amnesia, (faciobrachial dystonic) seizures and psychiatric manifestations, the anti-NMDA receptor encephalitis is characterized by memory deficits, psychiatric symptoms with psychotic and catatonic features, language disintegration, dyskinetic movements, seizures, decreased consciousness, autonomic and breath-ing instability that often requires intensive care treatment [6,7,13-15]. However, there may be clinical overlaps of the two entities. A tumor association is infrequently found in the anti-LGI1 syndrome, whereas ovarian or other tera-toma were diagnosed in up to 50% of anti-NMDA receptor encephalitis patients [4,6,13,16].
In order to detect underlying tumor manifestations, whole-body 18F-fluoro-2-deoxy-d-glucose positron emis-sion tomography (FDG-PET) is performed in many patients with limbic encephalitis, whereby cerebral FDG uptake can also be determined. Some case reports have published FDG-PET data showing brain metabolic abnormalities of varying degree and localization in adult patients with anti-LGI1 [17] or anti-NMDA receptor encephalitis [16,18-22]. Recently, an FDG-PET study revealed a frontal and temporal hypermetabolism associated with occipital hy-pometabolism in six patients with anti-NMDA receptor encephalitis [23], while a hypermetabolism in the medial temporal lobes and basal ganglia was detected in ten anti-LGI1 encephalitis patients [24]. The aim of our study was to compare cerebral FDG uptake of whole-body FDG-PET imaging in patients with anti-LGI1 and anti-NMDA re-ceptor encephalitis for detailed analysis of brain metabolic
disease patterns that may lead to an improved diagnos-tic accuracy.
Methods
Patients and controls
We obtained an approval from the local Ethics Committee of Hannover Medical School (No. 1625–2012) and pa-tients or their carers gave their written informed consent.
The brain FDG uptake from whole-body FDG-PETs of six anti-NMDA receptor encephalitis patients (6 females, median age 36.5, interquartile range 30.5-47.25, Table 1) and four anti-LGI1 encephalitis patients (4 males; me-dian age 68.0, interquartile range 61–72.75, Table 2) ad-mitted to Hannover Medical School between 2008 and 2012 was retrospectively analyzed.
Diagnostic criteria were the above mentioned typical clin-ical symptoms of limbic encephalitis and detection of either anti-LGI1 or anti-NMDA receptor IgG titer in serum or cerebrospinal fluid (CSF) of at least 1:10. Antibody detec-tion was performed using Mosaik Biochips (Euroimmun, Lübeck, Germany) as described previously [25]. The clinical severity at the time of PET investigation and follow up was staged using the modified Rankin Scale (mRS). All patients with LGI1 syndrome but only one patient with anti-NMDA receptor encephalitis were able to lie quietly in the PET scanner, therefore, five of the latter patients had to be investigated in propofol narcosis. The patient imaging data were compared to separate age and sex matched control groups without neuropsychiatric diseases who received PET due to an extracerebral neoplasm (anti-NMDA controls: 5 females, median age 40.0, interquartile range 37.5-46, anti-LGI1 controls: 4 males/2 females, median age 61.0, inter-quartile range 58.75-64.5). All controls were investigated without narcosis using the same PET acquisition protocol.
FDG-PET
Statistical parametric mapping and volume of interest analysis
Brain images were spatially normalized into the stereotatic standard space according to Montreal Neurological Insti-tute using the Statistical parametric mapping 2 (SPM2) FDG brain template with default parameter settings (stat-istical parametric mapping, Wellcome Trust Centre for Neuroimaging, London, UK). Thereafter each data set was smoothed with an isotropic 3D Gaussian filter kernel with 10-mm FWHM. In group comparisons (e.g. patients vs. controls) proportional scaling to the cerebral global mean was employed and the two sample t-test to detect voxels/ regions with either decreased or increased FDG uptake i.e. glucose metabolism. In single-subject analyses effects were assessed for each patient individually. Moreover, antibody titers and clinical scores were correlated to glucose metab-olism as covariates at a group level. Statistical inferences were based on a p-value of 0.005 uncorrected for multiple comparisons and an extent threshold of 30 voxels. We additionally performed group analyses using pons and motor cortex as reference region for scaling leading to es-sentially the same results. For spatial assignment of signifi-cant changes in SPM analyses volume of interest (VOI)
templates according to Cyceron or reflecting Brodmann areas were used. In order to detect changes in larger brain regions, small VOIs according to Cyceron were summa-rized to large VOIs (Additional file 1: Table S1) and statis-tical analyses for group differences (t-test) and correlations (linear regression analysis) were performed using JMP10 software (SAS Institute). A p-value < 0.05 was used for statistical inferences.
Results
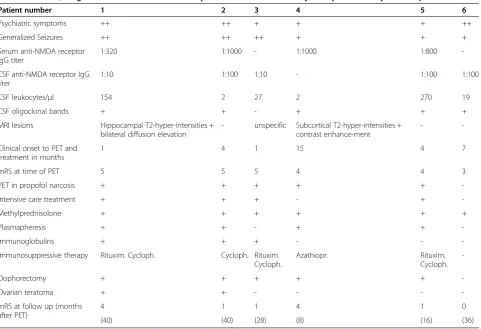
Patient and magnet resonance imaging properties The demographic and clinical data of patients as well as their diagnostic procedures and therapy are summarized in Tables 1 and 2. The variability of PET time points in anti-NMDA encephalitis patients was caused mainly by late admission to Hannover Medical School in the dis-ease course of some patients, however, 5/6 patients were considered to be at the clinical peak of encephalitis at the time of PET. They presented with typical signs and symptoms including generalized seizures which were treated successfully with antiepileptic drugs before PET investigation. At the time of PET the electroencephalog-raphy (EEG) did not record epilepsy specific potentials
Table 1 Clinical, diagnostic and treatment data of patients with anti-N-methyl-D-aspartate receptor encephalitis
Patient number 1 2 3 4 5 6
Psychiatric symptoms ++ ++ + + + ++
Generalized Seizures ++ ++ ++ + + +
Serum anti-NMDA receptor IgG titer
1:320 1:1000 - 1:1000 1:800
-CSF anti-NMDA receptor IgG titer
1:10 1:100 1:10 - 1:100 1:100
CSF leukocytes/μl 154 2 27 2 270 19
CSF oligoclonal bands + + - + + +
MRI lesions Hippocampal T2-hyper-intensities + bilateral diffusion elevation
- unspecific Subcortical T2-hyper-intensities + contrast enhance-ment
-
-Clinical onset to PET and treatment in months
1 4 1 15 4 7
mRS at time of PET 5 5 5 4 4 3
PET in propofol narcosis + + + + +
-Intensive care treatment + + + - +
-Methylprednisolone + + + + + +
Plasmapheresis + + - + +
-Immunoglobulins + + + - -
-Immunosuppressive therapy Rituxim. Cycloph. Cycloph. Rituxim. Cycloph.
Azathiopr. Rituxim.
Cycloph.
-Oophorectomy + + + + +
-Ovarian teratoma + + - - -
-mRS at follow up (months after PET)
4 1 1 4 1 0
(40) (40) (28) (8) (16) (36)
and the modified Rankin Scale (mRS) varied between 3 and 5 (median 4.5, interquartile range 3.75-5.0, n = 6).
PET metabolic abnormalities of anti-NMDA receptor encephalitis patients did not correspond to magnet reson-ance imaging (MRI) lesions that were shown in 4/6 patients: Hippocampal T2-hyperintensities bilaterally with diffusion elevation (patient 1, Figure 1A-B), small single unspecific left paraventricular T2-hyperintensity without contrast enhancement or diffusion restriction (patient 3), multiple very small subcortical T2-hyperintensities with T1-contrast enhancement (patient 4) and faint T2-hyperintensities in both cingular gyri without contrast enhancement (patient 5). In patients 2 and 6 MRI did not display any lesions.
Although ovarian PET and ultrasound were unsuspi-cious, an exploratory oophorectomy [6,26,27] was initiated in 5/6 patients (mRS≥4) after the consent of the caring person had been obtained. Histopathologically a micro-scopic mature ovarian teratoma containing neuronal tissue was detected in 2/5 patients. Clinical outcome at the last follow up after 8–40 months (mRS median 1.0,
interquartile range 0.75-4.0, n = 6) was good with mRS 0–1 (4/6) or showed improvement to a moderate degree (1/6), while one patient did not respond to treatment.
Patients with anti-LGI1 syndrome presented with symp-toms of a classic limbic encephalitis including cognitive deficits and focal seizures. Two patients showed faciobra-chial dystonic seizures that were treated successfully with methylprednisolone and antiepileptic therapy [28]. Rou-tine EEG at the time of PET did not record epilepsy specific potentials. PET tumor screening was negative for neoplasia within a range of 1–12 months after clinical onset, which corresponds to the time from onset to treat-ment initiation. Again this variability of time points was caused by late admission of two patients to Hannover Medical School, however, 3/4 patients were at the clinical peak of the anti-LGI1 encephalitis at the time of PET with a mRS of 2.
PET abnormalities of anti-LGI1 syndrome patients did not correspond to their MRI lesions that were not enhan-cing after gadolinium application: Multiple microangio-pathic T2-hyperintensities in the subcortical white matter
Table 2 Clinical, diagnostic and treatment data of patients with anti-leucine rich glioma inactivated 1 protein encephalitis
Patient number 1 2 3 4
Psychiatric symptoms - + -
-Cognitive deficits + (working memory, attention, construction)
++ + +
(memory) (memory) (memory)
Focal Seizures + (dystonic faciobrachial) + + + (dystonic
faciobrachial)
Anti-LGI1 IgG titer in serum 1:100 1:100 1:100 1:100
Anti-LGI1 IgG titer in CSF - - -
-CSF leukocytes/μl 2 3 2 2
CSF oligoclonal bands - - -
-MRI lesions unspecific bitemporal
T2-hyperintensities
-
-Clinical onset to PET and treatment in months
6 1 12 2
mRS at time of PET 2 2 2 2
PET in narcosis - - -
-Evidence of Tumor - - -
-Intensive care treatment - - -
-Methylprednisolone + + + +
Plasmapheresis + (3 months interval) + +
-Immunoglobulins - - + +
Immunosuppressive therapy - -
Cyclophospha-mide
-mRS at follow up (months after PET) 1 0 3 0
(31) (24) (9) (18)
(patient 1) and bitemporal T2-hyperintensities (patient 2, Figure 1C-D). At the time of PET, the MRI of patient 3 had not displayed any lesions yet, while we detected a right hippocampal T2-hyperintensity 4 months later cor-responding to progressive cognitive deficits (memory, ex-ecutive functions) and generalized seizures, patient 4 did not show MRI lesions.
After first line treatments, two patients received a con-tinuous oral steroid therapy, while patient 3 was treated with cyclophosphamide at mRS of 3. In most patients clinical outcome at the last follow up after 9–31 months (mRS median 0.5, interquartile range 0.25-2.5, n = 4) was good with mRS 0–1 (3/4).
Group analyses of brain glucose metabolism
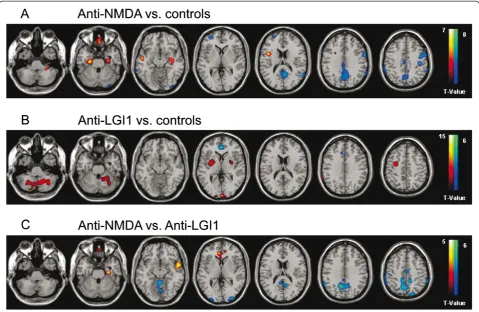
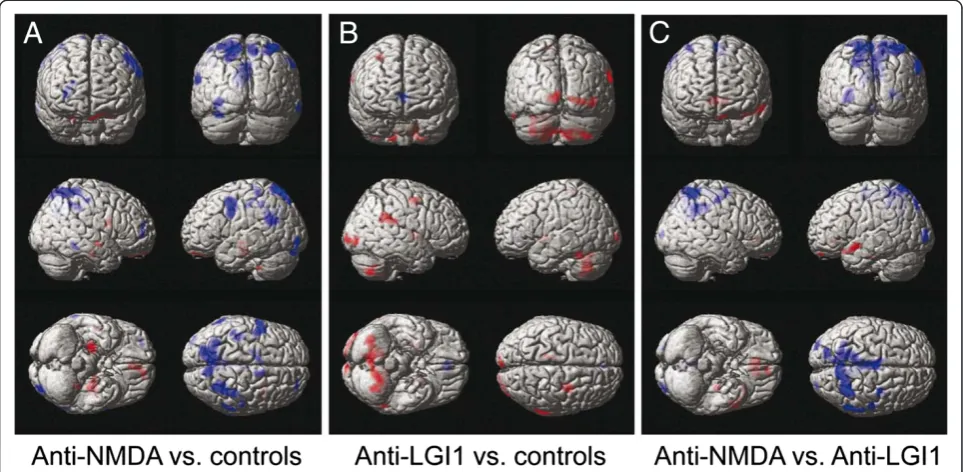
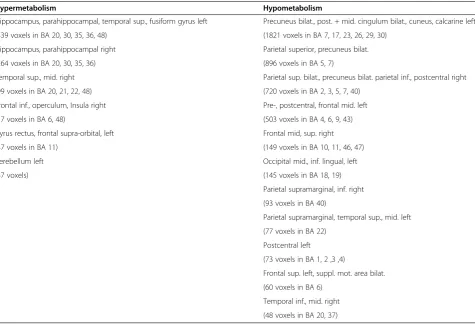
In comparison to the matched reference group FDG-PET of patients with anti-NMDA receptor encephalitis (Figures 2A, 3A) displayed a regionally limited hyperme-tabolism of bitemporal areas including hippocampus and parahippocampus (99–439 voxels within Brodmann areas 20, 21, 22, 30, 35, 36, 48, Table 3) as well as an extensive hypometabolism in the precuneus, the pre- and postcen-tral, the parietal and posterior cingulate cortex (503– 1821 voxels within Brodmann areas 2, 3, 4, 6, 7, 17, 23, 26, 29, 30, 40, 43, Table 4). In patients with anti-LGI1 enceph-alitis (Figures 2B, 3B) we observed hypermetabolism in the cerebellum, basal ganglia as well as in precentral and
occipital regions (191–2286 voxels in the cerebellum, pu-tamen, pallidum and within Brodmann areas 6, 8, 17, 18, 19, Table 4) and hypometabolism limited to the anterior cingulate/frontomesial cortex (232 voxels within Brodmann areas 10, 11, 24, 32, Table 4). Brain regions and Brodmann areas showing significant abnormalities of glucose me-tabolism in patients with anti-LGI1 and anti-NMDA receptor encephalitis are summarized in Table 3 and Table 4. The results of SPM analysis for each individual patient are displayed in the supplemental material (Additional files 2 and 3: Figures S1 and S2 and Additional file 4: Table S2).
Direct comparison between the above mentioned types of encephalitis likewise revealed distinct patterns with a relative hypometabolism in the precuneus, precentral,
parietal, occipital and cingulate cortex (338–2616 voxels within Brodmann areas 2, 3, 4, 5, 6, 7, 10, 19, 20, 23, 26, 30, 39, 40) as well as regionally limited hypermetabolism in frontotemporal areas (40–449 voxels within Brodmann areas 10, 11, 20, 21, 22, 25, 30, 36, 38, 47, 48) of anti-NMDA receptor encephalitis patients compared to the anti-LGI1 associated syndrome (Figures 2C, 3C).
In LGI1-patients the mRS at follow up showed a posi-tive correlation with the precentral metabolism (i.e. in-creasing mRS values with inin-creasing frontal metabolism left, r = 0.95, p = 0.048). Other assessments for correla-tions between brain metabolism and NMDA-/LGI1-antibody titers in serum/CSF or the mRS at follow up did not reveal consistent results of SPM and VOI analyses.
Figure 218F-fluoro-2-deoxy-d-glucose positron emission tomography in patients with anti-N-methyl-D-aspartate receptor and anti-leucine rich glioma inactivated 1 protein encephalitis–tomographic display.Group analysis by statistical parametrical mapping of
18F-fluoro-2-deoxy-d-glucose positron emission tomography shows significant (p < 0.005, two sample t-test uncorrected for multiple comparisons
Discussion
This retrospective study showed distinct brain metabolic patterns in FDG-PETs of anti-LGI1 and anti-NMDA recep-tor encephalitis patients. Analysis of the anti-LGI1 group revealed hypermetabolism in cerebellar, basal ganglia, oc-cipital and precentral regions and hypometabolism limited to the anterior cingulate/frontomesial cortex, whereas in anti-NMDA receptor encephalitis we found hypermetabo-lism in frontotemporal areas and widespread hypometabo-lism in parietal lobes.
The imaging results for anti-NMDA receptor enceph-alitis patients are in agreement with a recent FDG-PET study demonstrating frontotemporal hypermetabolism and occipital hypometabolism [23] despite considerable methodological differences. Our anti-NMDA receptor encephalitis patients with mRS≥4 at the time of PET (n = 5) had to receive propofol narcosis during the whole-body tumor scan to prevent severe artifacts by involuntary movements, while Leypoldt et al. managed imaging acquisition in patients showing similar initial mRS (median 4.5) without sedation or narcosis (F. Leypoldt, personal communication).
The tracer FDG is taken up by active brain neurons as if it was glucose and is then metabolized in the cells to FDG-6-phosphate emitting radioactivity that can be measured using PET. Uptake and metabolic trapping of FDG in the brain as FDG-6-phosphate is completed to 80–90% 32 mi-nutes after the intravenous injection [29]. In an FDG-PET study with healthy volunteers receiving narcosis 25 min be-fore FDG administration and during PET scanning, the re-gional glucose metabolic rate was reduced during propofol anaesthesia in all brain areas to 48–66% (p < 0.01) with highest significant reductions in the occipital lobe, the lin-gual gyrus, parietal lobe, temporal lobe and thalamus [30]. Although we applied FDG one hour before initiation of narcosis and PET scanning, we cannot completely rule out a minor hypometabolic propofol effect on brain metabolism particularly in temporal and parietal areas of our anti-NMDA receptor encephalitis patients. In most affected temporal regions including hippocampus and parahip-pocampus an underestimation of encephalitis-induced hypermetabolism due to propofol narcosis seems possible. In previous FDG-PETs without sedation or narcosis, fron-totemporal hypermetabolism was more pronounced in
anti-NMDA receptor encephalitis with similar mRS [23] suggesting a minor hypometabolic propofol effect in these brain areas of our patients.
VGKC-complex positive encephalitis patients without LGI1 antibodies compose a more heterogenous group than patients with LGI1 encephalitis. In a recent PET study [31], only 1/7 VGKC-positive patients also showed autoantibodies against LGI1 leading to hypometabolism in the association cortices. In the remaining six patients, two scans were rated as normal and four showed different findings mostly involving the basal ganglia [31] suggesting a heterogeneous pattern of brain glucose metabolism in the VGKC-positive subtypes of limbic encephalitis. In pre-vious case reports, the FDG-PETs in encephalitis patients with autoantibodies against the VGKC-complex – LGI1 antibodies were not determined–indicated bilateral tem-poromesial hypermetabolism and/or temporal hypometa-bolism depending on the course of the disease [32-35].
The glycoprotein LGI1 is secreted from presynaptic terminals and associates with synaptic Kv1 VGKCs [36]. LGI1 is highly expressed in the hippocampus and the
neocortex, and mutations in the LGI1 gene cause auto-somal dominant lateral temporal lobe epilepsy [13,37,38]. LGI1 antibodies have been detected predominantly in lim-bic encephalitis, epilepsy and few patients with Morvan’s disease [5,13,36]. Furthermore, LGI1 antibodies were de-tected in a glutamic acid decarboxylase antibody-positive patient suffering from progressive encephalomyelitis with rigidity and myoclonus (PERM) [39].
Recent case reports demonstrated hypermetabolism in the basal ganglia as well as in the left hippocampus and amygdala in two patients 3–8 months after clinical onset of encephalitis associated with LGI1-antibodies [17,40]. Very lately Shinet al. demonstrated temporal and bilateral basal ganglia hypermetabolism in 7/10 anti-LGI1 encephalitis pa-tients (3 days to 2 years between symptom onset and diag-nosis), which had not been compared to a matched control group [24], suggesting that the anti-LGI1-induced brain metabolic pattern may depend on the disease course, time point of diagnosis/therapy initiation and treatment regimen. Our anti-LGI1 patients were investigated without pro-pofol narcosis by FDG-PET 1–12 months after clinical
Table 318F-fluoro-2-deoxy-d-glucose positron emission tomography in anti-N-methyl-D-aspartate receptor encephalitis patients
Hypermetabolism Hypometabolism
Hippocampus, parahippocampal, temporal sup., fusiform gyrus left Precuneus bilat., post. + mid. cingulum bilat., cuneus, calcarine left
(439 voxels in BA 20, 30, 35, 36, 48) (1821 voxels in BA 7, 17, 23, 26, 29, 30)
Hippocampus, parahippocampal right Parietal superior, precuneus bilat.
(264 voxels in BA 20, 30, 35, 36) (896 voxels in BA 5, 7)
Temporal sup., mid. right Parietal sup. bilat., precuneus bilat. parietal inf., postcentral right
(99 voxels in BA 20, 21, 22, 48) (720 voxels in BA 2, 3, 5, 7, 40)
Frontal inf., operculum, Insula right Pre-, postcentral, frontal mid. left
(57 voxels in BA 6, 48) (503 voxels in BA 4, 6, 9, 43)
Gyrus rectus, frontal supra-orbital, left Frontal mid, sup. right
(47 voxels in BA 11) (149 voxels in BA 10, 11, 46, 47)
Cerebellum left Occipital mid., inf. lingual, left
(47 voxels) (145 voxels in BA 18, 19)
Parietal supramarginal, inf. right
(93 voxels in BA 40)
Parietal supramarginal, temporal sup., mid. left
(77 voxels in BA 22)
Postcentral left
(73 voxels in BA 1, 2 ,3 ,4)
Frontal sup. left, suppl. mot. area bilat.
(60 voxels in BA 6)
Temporal inf., mid. right
(48 voxels in BA 20, 37) Abbreviations:Brodmann area (BA).
Brain regions and Brodmann areas displaying significant abnormalities of glucose metabolism in18
onset showing only minor hypermetabolism in temporal areas, whereas hypermetabolic activity was most pro-nounced in cerebellar, basal ganglia, occipital and precen-tral regions. Interestingly, the precenprecen-tral hypermetabolism correlated positively with the mRS at follow up suggesting that increased metabolism in this area may represent a negative prognostic factor in LGI1 patients. The anti-LGI1 metabolic pattern contrasts the PET results of patients with anti-NMDA receptor encephalitis underlining these two etiologically different subtypes of autoimmune limbic encephalitis. In addition to the autoantibody detection as most important diagnostic feature, FDG-PET may prove to be a useful imaging tool, besides whole-body tumor search, for differentiating these subtypes of lim-bic encephalitis.
Two distinct brain metabolic patterns in immunologic-ally mostly undefined (7/9) limbic encephalitis patients have been described in a recent FDG-PET study [41]. Five younger patients including the two NMDA-receptor anti-body positive cases displayed a mixed metabolic pattern characterized by hypermetabolism in the temporal and orbitofrontal cortex as well as occipital hypometabolism. While this pattern in younger patients reminds of brain metabolic changes seen in limbic encephalitis induced by NMDA receptor IgG-antibodies [23], four older
patients presented with subacute cognitive decline show-ing diffuse cortical hypometabolism closely resemblshow-ing Alzheimer’s disease or dementia with Lewy Bodies [41]. This neurodegenerative-like hypometabolism is neither likely to reflect the cognitive decline induced by NMDA receptor IgA-antibodies leading to occipital hypermetabo-lism [42] nor the anti-LGI1 syndrome where Shin et al. and we found predominantly hypermetabolic changes.
Conclusions
In conclusion, our retrospective FDG-PET study provides novel evidence for distinct brain metabolic patterns in patients with anti-LGI1 and anti-NMDA receptor enceph-alitis. In anti-NMDA receptor encephalitis the regionally limited hypermetabolism in frontotemporal areas con-trasted extensive hypometabolism in parietal lobes, whereas the anti-LGI1 syndrome is characterized by hypermetabo-lism in cerebellar, basal ganglia, occipital and precentral areas and minor frontomesial hypometabolism.
Ethical standard
We obtained an approval from the local Ethics Committee of Hannover Medical School (No. 1625–2012) and pa-tients or their carers gave their written informed consent.
Table 418F-fluoro-2-deoxy-d-glucose positron emission tomography in patients with anti-leucine rich glioma inactivated 1 protein encephalitis
Hypermetabolism Hypometabolism
Cerebellum, bilat. Cingulum ant. bilat., mid. frontal sup. med., med. orbital right
(2286 voxels) (232 voxels in BA 10, 11, 24, 32)
Putamen, pallidum right
(322 voxels)
Precentral, frontal mid., sup. right
(210 voxels in BA 6, 8)
Putamen, pallidum left
(191 voxels)
Occipital inf., mid., calcarine right
(191 voxels in BA 17, 18, 19)
Parietal supramarginal, angular, temporal sup. right
(155 voxels in BA 22, 40, 48)
Calcarine, occipital mid., sup. left
(149 voxels in BA 17)
Paracentral lobule, precuneus left
(56 voxels in BA 2, 4, 5)
Temporal inf. left
(37 voxels in BA 20, 37) Abbreviations:Brodmann area (BA).
Brain regions and Brodmann areas displaying significant abnormalities of glucose metabolism in18
Additional files
Additional file 1: Table S1.Volume of interest analyses of18
F-fluoro-2-deoxy-d-glucose positron emission tomography in patients with anti-N-methyl-D-aspartate receptor and anti-leucine rich glioma inactivated 1 protein encephalitis.
Additional file 2: Figure S1.18F-fluoro-2-deoxy-d-glucose positron
emission tomography images of individual patients with anti-N-methyl-D-aspartate receptor encephalitis.
Additional file 3: Figure S2.18F-fluoro-2-deoxy-d-glucose positron
emission tomography images of individual patients with anti-leucine rich glioma inactivated 1 protein encephalitis.
Additional file 4: Table S2.18F-fluoro-2-deoxy-d-glucose positron
emission tomography data of individual patients with anti-N-methyl-D-aspartate receptor and anti-leucine rich glioma inactivated 1 protein encephalitis.
Abbreviations
ADAM22:Disintegrin and metalloproteinase domain-containing protein 22; AMPA:α-amino-3-hydroxy-5-methyl-4-isoxazolepropionic acid; BA: Brodmann area; CSF: Cerebrospinal fluid; CT: Computed tomography; EEG: Electroencephalography; FDG-PET:18F-fluoro-2-deoxy-d-glucose positron
emission tomography; FLAIR: Fluid attenuated inversion recovery; FWHM: Full width at half maximum; IgG: Immunoglobulin G; LGI1: Leucine rich glioma inactivated 1 protein; MRI: Magnet resonance imaging; mRS: Modified Rankin Scale; NMDA: N-methyl-D-aspartate; NR: NMDA receptor subunit;
OSEM: Ordered subset expectation maximization; SPM: Statistical parametric mapping; VOI: Volume of interest; VGKC: Voltage-gated potassium channels.
Competing interests
The authors declare that they have no competing interest.
Authors’contributions
FWe, FWi, PR, CH, GB, EN: study design and data interpretation. FWe, FWi, PR, SBT, CH, RRR, GB, EN: data analysis. FWe, SBT, ALB, CT, MS, EV, CS, FL, JA, AL: patient selection and treatment. FWe, FWi, PR, RD, LG, FMB, GB, EN: manuscript drafting. All authors read and approved the final manuscript.
Acknowledgements
The authors wish to thank Nicole Owsianski-Hille for excellent technical asstistance.
Author details 1
Department of Neurology, Hannover Medical School, Carl-Neuberg-Str. 1, 30625 Hannover, Germany.2Department of Medical Physics, Hannover
Medical School, Carl-Neuberg-Str. 1, 30625 Hannover, Germany.3Institute of Neuroradiology, Hannover Medical School, Carl-Neuberg-Str. 1, 30625 Hannover, Germany.4Department of Nuclear Medicine, Hannover Medical School, Carl-Neuberg-Str. 1, 30625 Hannover, Germany.5Department of
Anaesthesia and Critical Care Medicine, Hannover Medical School, Carl-Neuberg-Str. 1, 30625 Hannover, Germany.
Received: 15 January 2014 Accepted: 17 June 2014 Published: 20 June 2014
References
1. Gultekin SH, Rosenfeld MR, Voltz R, Eichen J, Posner JB, Dalmau J:
Paraneoplastic limbic encephalitis: neurological symptoms, immunological findings and tumour association in 50 patients. Brain2000,123:1481–1494.
2. Graus F, Delattre JY, Antoine JC, Dalmau J, Giometto B, Grisold W, Honnorat J, Smitt PS, Vedeler C, Verschuuren JJ, Vincent A, Voltz R:Recommended diagnostic criteria for paraneoplastic neurological syndromes. J Neurol Neurosurg Psychiatry2004,75:1135–1140.
3. Zuliani L, Graus F, Giometto B, Bien C, Vincent A:Central nervous system neuronal surface antibody associated syndromes: review and guidelines for recognition.J Neurol Neurosurg Psychiatry2012,83:638–645.
4. Rosenfeld MR, Dalmau JO:Paraneoplastic disorders of the CNS and autoimmune synaptic encephalitis.Continuum (Minneap Minn)2012,
18:366–383.
5. Irani SR, Alexander S, Waters P, Kleopa KA, Pettingill P, Zuliani L, Peles E, Buckley C, Lang B, Vincent A:Antibodies to Kv1 potassium channel-complex proteins leucine rich, glioma inactivated 1 protein and contactin-associated protein-2 in limbic encephalitis, Morvan’s syndrome and acquired neuromyotonia.Brain2010,133:2734–2748.
6. Dalmau J, Lancaster E, Martinez-Hernandez E, Rosenfeld MR, Balice-Gordon R:Clinical experience and laboratory investigations in patients with anti-NMDAR encephalitis.Lancet Neurol2011,10:63–74.
7. Lancaster E, Martinez-Hernandez E, Dalmau J:Encephalitis and antibodies to synaptic and neuronal cell surface proteins.Neurology2011,77:179–189. 8. Gold M, Pul R, Bach JP, Stangel M, Dodel R:Pathogenic and physiological
autoantibodies in the central nervous system.Immunol Rev2012,248:68–86. 9. Ohkawa T, Fukata Y, Yamasaki M, Miyazaki T, Yokoi N, Takashima H,
Watanabe M, Watanabe O, Fukata M:Autoantibodies to epilepsy-related LGI1 in limbic encephalitis neutralize LGI1-ADAM22 interaction and reduce synaptic AMPA receptors.J Neurosci2013,33:18161–18174. 10. Dalmau J, Gleichman AJ, Hughes EG, Rossi JE, Peng X, Lai M, Dessain SK,
Rosenfeld MR, Balice-Gordon R, Lynch DR:Anti-NMDA-receptor encephalitis: case series and analysis of the effects of antibodies.Lancet Neurol2008,
7:1091–1098.
11. Hughes EG, Peng X, Gleichman AJ, Lai M, Zhou L, Tsou R, Parsons TD, Lynch DR, Dalmau J, Balice-Gordon RJ:Cellular and synaptic mechanisms of anti-NMDA receptor encephalitis.J Neurosci2010,30:5866–5875. 12. Manto M, Dalmau J, Didelot A, Rogemond V, Honnorat J:Afferent
facilitation of corticomotor responses is increased by IgGs of patients with NMDA-receptor antibodies.J Neurol2011,258:27–33.
13. Vincent A, Bien CG, Irani SR, Waters P:Autoantibodies associated with diseases of the CNS: new developments and future challenges. Lancet Neurol2011,10:759–772.
14. Titulaer MJ, McCracken L, Gabilondo I, Armangué T, Glaser C, Iizuka T, Honig LS, Benseler SM, Kawachi I, Martinez-Hernandez E, Aguilar E, Gresa-Arribas N, Ryan-Florance N, Torrents A, Saiz A, Rosenfeld MR, Balice-Gordon R, Graus F, Dalmau J:Treatment and prognostic factors for long-term outcome in patients with anti-NMDA receptor encephalitis: an observational cohort study.Lancet Neurol2013,12:157–165.
15. Dalmau J, Tüzün E, Wu HY, Masjuan J, Rossi JE, Voloschin A, Baehring JM, Shimazaki H, Koide R, King D, Mason W, Sansing LH, Dichter MA, Rosenfeld MR, Lynch DR:Paraneoplastic anti-N-methyl-D-aspartate receptor encephalitis associated with ovarian teratoma.Ann Neurol2007,61:25–36.
16. Irani SR, Bera K, Waters P, Zuliani L, Maxwell S, Zandi MS, Friese MA, Galea I, Kullmann DM, Beeson D, Lang B, Bien CG, Vincent A:N-methyl-D-aspartate antibody encephalitis: temporal progression of clinical and paraclinical observations in a predominantly non-paraneoplastic disorder of both sexes.Brain2010,133:1655–1667.
17. Kamaleshwaran KK, Iyer RS, Antony J, Radhakrishnan EK, Shinto A:18 F-FDG PET/CT findings in voltage-gated potassium channel limbic encephalitis. Clin Nucl Med2013,38:392–394.
18. Iizuka T, Sakai F, Ide T, Monzen T, Yoshii S, Iigaya M, Suzuki K, Lynch DR, Suzuki N, Hata T, Dalmau J:Anti-NMDA receptor encephalitis in Japan: long-term outcome without tumor removal.Neurology2008,70:504–511. 19. Maeder-Ingvar M, Prior JO, Irani SR, Yoshii S, Iigaya M, Suzuki K, Lynch DR,
Suzuki N, Hata T, Dalmau J:FDG-PET hyperactivity in basal ganglia correlating with clinical course in anti-NDMA-R antibodies encephalitis. J Neurol Neurosurg Psychiatry2008,32:235–236.
20. Mohr BC, Minoshima S:F-18 fluorodeoxyglucose PET/CT findings in a case of anti-NMDA receptor encephalitis.Clin Nucl Med2010,35:461–463. 21. Naeije G, de Hemptinne Q, Depondt C, Pandolfo M, Legros B:Acute
behavioural change in a young woman evolving towards cerebellar syndrome.Clin Neurol Neurosurg2010,112:509–511.
22. Morooka M, Kubota K, Minamimoto R, Furuhata M, Abe T, Ito K, Okasaki M, Ishii K, Ishiwata K:18 F-FDG and 11C-methionine PET/CT findings in a case with anti-NMDA (NR2B) receptor encephalitis.Clin Nucl Med2012,37:400–402. 23. Leypoldt F, Buchert R, Kleiter I, Marienhagen J, Gelderblom M, Magnus T, Dalmau J, Gerloff C, Lewerenz J:Fluorodeoxyglucose positron emission tomography in anti-N-methyl-D-aspartate receptor encephalitis: distinct pattern of disease.J Neurol Neurosurg Psychiatry2012,83:681–686. 24. Shin YW, Lee ST, Shin JW, Moon J, Lim JA, Byun JI, Kim TJ, Lee KJ, Kim YS,
encephalitis: clinical manifestations and response to immunotherapy. J Neuroimmunol2013,265:75–81.
25. Wandinger KP, Saschenbrecker S, Stoecker W, Dalmau J: Anti-NMDA-receptor encephalitis: a severe, multistage, treatable disorder presenting with psychosis.J Neuroimmunol2011,231:86–91.
26. Johnson N, Henry C, Fessler AJ, Dalmau J:Anti-NMDA receptor encephalitis causing prolonged nonconvulsive status epilepticus. Neurology2010,75:1480–1482.
27. Boeck AL, Logemann F, Krauss T, Hussein K, Bültmann E, Trebst C, Stangel M:Ovarectomy despite negative imaging in anti-NMDA receptor encephalitis: effective even late.Case Rep Neurol Med2013,2013:843192. 28. Irani SR, Stagg CJ, Schott JM, Rosenthal CR, Schneider SA, Pettingill P,
Pettingill R, Waters P, Thomas A, Voets NL, Cardoso MJ, Cash DM, Manning EN, Lang B, Smith SJ, Vincent A, Johnson MR:Faciobrachial dystonic seizures: the influence of immunotherapy on seizure control and prevention of cognitive impairment in a broadening phenotype. Brain2013,136:3151–3162.
29. Alkire MT, Haier RJ, Barker SJ, Shah NK, Wu JC, Kao YJ:Cerebral metabolism during propofol anesthesia in humans studied with positron emission tomography.Anesthesiology1995,82:393–403.
30. Schlünzen L, Juul N, Hansen KV, Cold GE:Regional cerebral blood flow and glucose metabolism during propofol anaesthesia in healthy subjects studied with positron emission tomography.Acta Anaesthesiol Scand
2012,56:248–255.
31. Baumgartner A, Rauer S, Mader I, Meyer PT:Cerebral FDG-PET and MRI findings in autoimmune limbic encephalitis: correlation with autoantibody types.J Neurol2013,260:2744–2753.
32. Ances BM, Vitaliani R, Taylor RA, Liebeskind DS, Voloschin A, Houghton DJ, Galetta SL, Dichter M, Alavi A, Rosenfeld MR, Dalmau J: Treatment-responsive limbic encephalitis identified by neuropil antibodies: MRI and PET correlates.Brain2005,128:1764–1777.
33. Fauser S, Talazko J, Wagner K, Ziyeh S, Jarius S, Vincent A, Schulze-Bonhage A:
FDG-PET and MRI in potassium channel antibody-associated non-paraneoplastic limbic encephalitis: correlation with clinical course and neuropsychology.Acta Neurol Scand2005,111:338–343.
34. Chatzikonstantinou A, Szabo K, Ottomeyer C, Kern R, Hennerici MG:
Successive affection of bilateral temporomesial structures in a case of non-paraneoplastic limbic encephalitis demonstrated by serial MRI and FDG-PET.J Neurol2009,256:1753–1755.
35. Gast H, Schindler K, Z’graggen WJ, Hess CW:Improvement of non-paraneoplastic voltage-gated potassium channel antibody-associated limbic encephalitis without immunosuppressive therapy.Epilepsy Behav
2010,17:555–557.
36. Schulte U, Thumfart JO, Klöcker N, Sailer CA, Bildl W, Biniossek M, Dehn D, Deller T, Eble S, Abbass K, Wangler T, Knaus HG, Fakler B:The epilepsy-linked Lgi1 protein assembles into presynaptic Kv1 channels and inhibits inactivation by Kvbeta1.Neuron2006,49:697–706.
37. Poza JJ, Saenz A, Martinez-Gil A, Cheron N, Cobo AM, Urtasun M, Martí-Massó JF, Grid D, Beckmann JS, Prud’homme JF, López de Munain A:Autosomal dominant lateral temporal epilepsy: clinical and genetic study of a large Basque pedigree linked to chromosome 10q.Ann Neurol1999,45:182–188. 38. Morante-Redolat JM, Gorostidi-Pagola A, Piquer-Sirerol S, Sáenz A, Poza JJ,
Galán J, Gesk S, Sarafidou T, Mautner VF, Binelli S, Staub E, Hinzmann B, French L, Prud’homme JF, Passarelli D, Scannapieco P, Tassinari CA, Avanzini G, Martí-Massó JF, Kluwe L, Deloukas P, Moschonas NK, Michelucci R, Siebert R, Nobile C, Pérez-Tur J, López de Munain A:Mutations in the LGI1/Epitempin gene on 10q24 cause autosomal dominant lateral temporal epilepsy. Hum Mol Genet2002,11:1119–1128.
39. Shugaiv E, Leite IM, Sehitoğlu E, Woodhall M, ÇavuşF, Waters P,İçöz S, Birişik Ö, Uğurel E, Ulusoy C, Kürtüncü M, Vural B, Vincent A, Akman-Demir G, Tüzün E:Progressive encephalomyelitis with rigidity and myoclonus: a syndrome with diverse clinical features and antibody responses. Eur Neurol2013,69:257–262.
40. Nakaoku Y, Maki T, Kanazawa K, Matsumoto R, Fukuyama H, Takahashi R, Ikeda A:A case of smoldering anti-leucine rich glioma inactivated 1 (LGI1) antibody-associated limbic encephalitis with faciobrachial dystonic seizure.Rinsho Shinkeigaku2013,53:706–711.
41. Fisher RE, Patel NP, Lai EC, Schulz PE:Two different18F-FDG brain
metabolic patterns in autoimmune limbic encephalitis.Clin Nucl Med
2012,37:213–218.
42. Prüss H, Höltje M, Maier N, Gomez A, Buchert R, Harms L, Ahnert-Hilger G, Schmitz D, Terborg C, Kopp U, Klingbeil C, Probst C, Kohler S, Schwab JM, Stoecker W, Dalmau J, Wandinger KP:IgA NMDA receptor antibodies are markers of synaptic immunity in slow cognitive impairment.Neurology
2012,78:1743–1753.
doi:10.1186/1471-2377-14-136
Cite this article as:Wegneret al.:Anti-leucine rich glioma inactivated 1 protein and anti-N-methyl-D-aspartate receptor encephalitis show distinct patterns of brain glucose metabolism in18F-fluoro-2-deoxy-d-glucose
positron emission tomography.BMC Neurology201414:136.
Submit your next manuscript to BioMed Central and take full advantage of:
• Convenient online submission
• Thorough peer review
• No space constraints or color figure charges
• Immediate publication on acceptance
• Inclusion in PubMed, CAS, Scopus and Google Scholar
• Research which is freely available for redistribution