ISSN: 2231-5381
http://www.ijettjournal.org
Page 61
Fault Current Mitigation using Solid State Fault
Current Limiter at Bonite Botlers Ltd
Exaud SaulTweve1, Nicholaus George Moyo2
Assistant Lecturers, Department of Electronics and Telecommunication Engineering Mbeya University of Science and Technology
Abstract
Continuous growth of electrical energy demands leads to increase in the fault current level.In some cases fault current levels are exceeding the interrupting capability of the existing transmission and distribution substations circuit breakers. Long term outage leads to increased operational cost to the utility company. Sometimes circuit breakers cannot handle the intensive level of faults current, so they fail to ‘break’ and force a system to collapse. The application of solid state faults current limiter (SSFCL) in power system offers an active way to overpower faults current and result in significant saving in the investment of high capacity circuit breakers. The additional feature of SSFCL is the improvement of power quality by reducing the voltage sag during the fault. Various control strategies have been developed to mitigate voltage sag/swell and unbalance voltage dips. In this paper full outlook of voltage sag, with background theory and guidelines on measurement procedures and problems solving techniques are presented. The capability of SSFCL is demonstrated using MATLAB SIMULINK simulation model. Simulation results show that SSFCL effectively limits the current during fault occurrence and also suppress voltage drop.
Keywords: voltage sag, Solid-state fault current limiter, Simulation, power quality.
I. INTRODUCTION
Currently the growth of electric power consumption has caused an increase in the magnitude of the fault. Some of the requirements of a good distribution system are proper voltage, availability of power on demand and reliability [1]. With the ever increasing use of sophisticated controls and equipment in industrial, commercial institutional and government facilities, the continuity, reliability, and quality of electrical services has become extremely crucial to many power users [2].Electrical system are subjected to a wide variety of power quality problems which interrupt production processes, affect sensitive equipment and cause downtime, plight and capacity loss [3]. BoniteBotlers Limited(BBL) faces unexpected voltage reduction (voltage sag) every time when there is
fault at some part of the distribution system, which affect its sensitive load such as Programmable Logic Controller (PLC), personal computers(PCs), adjustable speed drives (ASD), and high intensity discharge lighting system. The distribution line that feed Bonite is of radial type. The problems of radial distribution system arise whenever fault occurs on either a feeder or a distributor, all consumers are connected to that distributor will be affected. There would be an interruption of supply to all those consumers [4]. Since the distribution line is very long the short circuit current is very heavy and the consumers at the distant end of the distributor such as BBL are subjected to serious voltage fluctuations when the load on the distributor changes. Fault currents led to voltage variations which are undesirable for consumers with sensitive loads.The main objective of this paper is to determine the capability of a fault current limiter in power quality improvement at BBL. In order to achieve the objective the following are the specific objectives:
(i) To study the effects of voltage variation caused by fault current to sensitive loads of Bonitebotlers limited.
(ii) To model and simulate a line diagram of distribution line without SSFCL and that incorporating SSFCL in MATLAB SIMULINK
II. LITERATURE REVIEW
ISSN: 2231-5381
http://www.ijettjournal.org
Page 62
quality of supply of power systems, in addition to others such as power flow control, power system stability enhancement, and mitigation of subsynchronous resonance. The power quality improvement considered both voltage sags and the associated phase angle jumps are presented by [6]. This study focuses on the proper selection and design of suitable SSFCL configurations for application on the power systems to mitigate voltage sags in term of voltage magnitudes and phase angle jumps. Sensitivity analysis was also performed to determine the effects of varying fault current limiter (FCL) parameters on its performance in term of voltage supporting capability, phase angle jump reduction and fault current reduction. Reference [7] was presented waveform analysis of the bridge type SFCL during load changing and fault time. In fault conditions, the peak value of the waveforms is considered in calculating the voltage drop at load terminal during the load changing time. The analysis can be used in selecting an appropriate inductance value for designing such SFCL.‟
A. Voltage Sag Study in Radial Power System
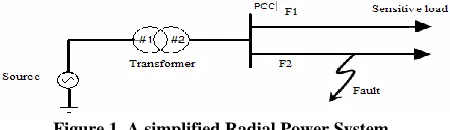
Fig. 1 shows a simplified radial power system. Feeder F1 supplies a sensitive load. With a fault in feeder F2, Point of Common Coupling (PCC) voltage reduces sharply. In case of three phase fault at the beginning of line, PCC voltage becomes almost zero and sensitive load supplying interrupts.
Figure 1. A simplified Radial Power System
Positive sequence equivalent circuit of such system is shown in Fig. 2. To calculate the voltage sag, simple voltage divider method is introduced in [8].
Figure 2. Positive Sequence Equivalent Circuit of Study System at Fault Condition
PCC voltage can be expressed by (1):
𝑉𝑃𝐶𝐶 =𝑍 𝑍𝐾
𝐾+(𝑍𝑆+𝑍𝑡)𝑉𝑆
(1) Where:
Zt: Transformer impedance
ZS : Source impedance VS : Source voltage
ZK : Equivalent impedance of parallel feeders i.e.
𝑍𝐾 = 𝑍𝐿1+ 𝑍𝑆𝐿 𝑃𝑎𝑟𝑎𝑙𝑙𝑒𝑙 𝑡𝑜(𝑍𝐿2+ 𝑍𝑓) (2)
In normal state, ZK is greater than (𝑍𝑆+ 𝑍𝑡) . Thus
PCC voltage almost is equal to source voltage. At fault condition in feeder F2, ZK changes as follow:
𝑍𝐾 = 𝑍𝐿1+ 𝑍𝑆𝐿 𝑃𝑎𝑟𝑎𝑙𝑙𝑒𝑙 𝑡𝑜(𝑍𝐿2+ 𝑍𝐹) (3)
Where:𝑍𝐹-Fault impedance
In three phase fault condition, ZF equals to zero and according to (3), ZK will be small. Consequently, referring to (1), magnitude of PCC voltage at fault interval falls strongly and sensitive load experiences a voltage interruption. To prevent this voltage sag, a proper solution, is introducing large limiting impedance between PCC and the fault. This solution is base of FCL‟s operation.
B. Solid-State Fault Current Limiters (SSFCL)
The important characteristic of SSFCL is fault current limitation. SSFCL use a combination of inductors, capacitors and Thyristor or IGBT to achieve fault limiting functionality. Fault current limiter is a variable impedance device connected in series with a circuit to limit the current under fault conditions [9]. The SSFL should have very low impedance during normal operating condition and high fault impedance under fault conditions [10]. Fig. 3 is the type of limiter, with a capacitor placed in parallel with an inductor and a pair of Thyristor [11]
Fig.3 SSFCL
C. Reduction of voltage sag using SSFCL
Voltage sag is the result of short circuit current by limiting the short circuit current definitely the voltage sag is reduced. The role of the FCL is to limit prospective fault current levels to a manageable value without a significant impact on the distribution system. Consider a simple power system models as shown in Figure 3and Figure 4, [12]. Fig.4 consisting of a source with voltage Vs, internal impedance Zs, andload Zload.
ISSN: 2231-5381
http://www.ijettjournal.org
Page 63
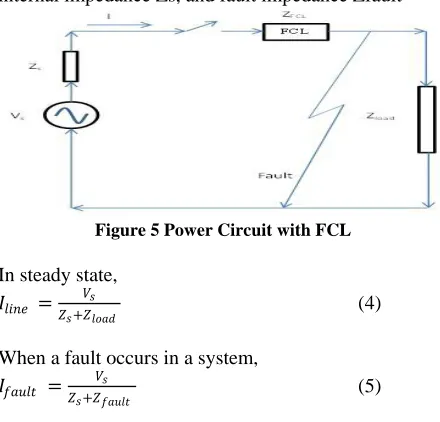
And Figure 4, consisting of a source with voltage Vs, internal impedance Zs, and fault impedance Zfault
Figure 5 Power Circuit with FCL
In steady state,
𝐼𝑙𝑖𝑛𝑒 = 𝑉𝑠
𝑍𝑠+𝑍𝑙𝑜𝑎𝑑 (4)
When a fault occurs in a system, 𝐼𝑓𝑎𝑢𝑙𝑡 =𝑍 𝑉𝑠
𝑠+𝑍𝑓𝑎𝑢𝑙𝑡 (5)
Where, Zfault<<Zload
Since the supply impedance is much smaller than the load impedance, Equation 5 shows that the short circuiting of the load will substantially increase the current flow. However, if a FCL is placed in series, as shown in the modified circuit, Equation 6 will hold true;
𝐼𝑓𝑎𝑢𝑙𝑡 =𝑍 𝑉𝑠
𝑠+𝑍𝐹𝐶𝐿+𝑍𝑓𝑎𝑢𝑙𝑡 (6)
equation (3) tells that, with an insertion of a FCL, the fault current will now be afunction of not only the source Zs and fault impedance Zfault, but also the impedance of the FCL. Hence, for a given source voltage and increasing ZFCL will decrease the fault current 𝐼𝑓𝑎𝑢𝑙𝑡. Under normal operation, SSFCL is controlled to be zero impedance device, power quality compensator, harmonics filter, or stabilizer.
III. METHODOLOGY
This part describes the methodology adopted in the study. It describes the location of the study area, data collection and other necessary information from the field and measurement of voltage sag using power quality recording instruments.
A. Data Collection
Throughout data collection, the researchers were dealt with carrying out the following activities:
Measurements of voltage sag using Power quality Recorder (PQR) instruments. They are permanent connected to a power network, and left alone to record power quality unattended for weeks, months and years at a time. Recordings are stored in internal non-volatile memory. Supply interruptions
will stop recording, but no recordings are lost and recording continues as soon a supply is restored. The recorders have no user interfaces, such as screens and keyboards, since they are used in an unattended manner. Instead, the recorder interacts with its operator by means of a personal computer (PC).
Electricity consumption based on monthly metering.
B. Data Analysis
During the study, the essential data were collected. Thereafter editing, classifying according to the requirement of each specific objective, tabulating and computing was done to facilitate interpretation and analysis. The analysis intended to accomplish the objectives.
C. The Proposed System of SSFCL
The most beneficial property of this configuration is simplicity of structure and control, low steady state impedance, fast response and high impedance fault. Figure 7 shows a general configuration of the solid-state fault current limiter. It consists of a fast solid state switch, current limiting impedance, voltage limiting element and series mechanical switch. [13]. The GTO thyristors are used as the fast solid state switch and the current limiting impedance is connected in parallel with these. The GTO thyristors are used to interrupt a current instantly upon receiving a turn-off signal and the current limiter impedance is used as way for passing the fault current when the solid state switch interrupt a fault current. But a sudden interruption of current is likely to cause an overvoltage in the circuit, so the voltage limiting element is used to prevent this [14]. The overcurrent detector and control device detect a fault and produce turn-off and turn-on signals for the GTO thyristor
Figure 7 Basic configuration of SSFCL (MOV: Metal Oxide Varistor)
IV. DATA PRESENTATION, ANALYSIS AND DISSCUSSION OF THE RESULTS
A. Effects of voltage sag on Adjustable Speed Drives(ASD)
ISSN: 2231-5381
http://www.ijettjournal.org
Page 64
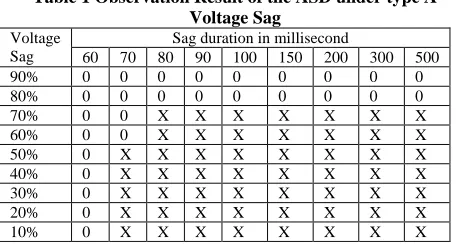
disconnected. The DC voltage drop depends on the characteristics of the voltage sag, its magnitude, duration, balance, unbalance and phase jump, on the capacity available at the DC bus and the power consumed by the load. When the DC bus voltage drops exceed setting value of under voltage relay, the ASD will trip. Table 1 shows the result of ASD under type A voltage sag. This table represents points 0 and X which ASD is operating at normal and disrupt conditions respectively. From the table it is observed that when the voltage sag is 90% and 80% regardless the sag duration variation ASD is operating in normal conditions. When the voltage sag is reached 70% and sag duration is 80milliseconds the ASD is in disruption condition.
Table 1 Observation Result of the ASD under type A Voltage Sag
B. Analysis of Revenue Losses due to Power Quality Disturbances
Data collected for sampled industrial monthly bill energy consumption were analyzed to obtain the calculatedaverage energy consumption in kWh of BONITE. Table 2 shows billed total energy consumption for three years under study(2015 to 2017)
Table 2 Energy Charges for Bonite Bottlers Ltd
Month 2015 kWh
2016 kWh
2017 kWh January 2461061 2382909 2452052 February 2490907 2534507 3480951 March 2457719 3470836 3351045 April 3245034 3486516 3424034 May 2439135 2420994 2673159 June 2537291 3273671 3340928 July 2626123 2527113 3452875 August 3497704 2439375 2545987 September 2365485 240255 2483754 October 2526867 2477407 2751025 November 3208542 3406412 2155494 December 3544938 3251676 3516016 Total 33400806 31911671 35627320 Average 2783400.5 2659305.9 2968943.3
In order to compute calculated average consumed energy at full operations by industrial customer (Bonite Bottlers Ltd) the following parameters were taken into consideration:
The industrial is working 24 hours every day The industrial power factor is 0.86
The industry operate at an average of 30 days per month
The installed capacity of the industry is 12000 kVA
The TANESCO standard norms for industrial load range between 0.4 up to 0.6. Load factor of 0.4 is for 18 hours operating industries, and load factor of 0.6 is for 24 hours operating industries. Equations (7) and (8) show maximum energy in kWh units at full operations without any interference for load factors of 0.4 and 0.6 respectively [3].
𝐸𝑚𝑎𝑥 = 0.4𝐿𝑖𝑛𝑠 × 𝐶𝑝𝑓 (7)
𝐸𝑚𝑎𝑥 = 0.6𝐿𝑖𝑛𝑠 × 𝐶𝑝𝑓 (8)
Equation (9) compute calculated consumed energy in kWh units at full operation without power quality disturbances (voltage sag)
𝐴𝐸𝑚𝑎𝑥 = 𝐸𝑚𝑎𝑥 × 24 × 30 (9)
Where:
E
max= Maximum energy consumed in kWh units at full operationsins
L
= Industrial installed load capacitypf
C
= Industrial power factormax E
A
= Calculated consumed energy in kWh units at full operation withoutPowerquality disturbance and power outage for a month of 30 days. Using equation (9) the calculated consumed energy in kWh units for Bonite Bottlers Ltd is𝐴𝐸𝑚𝑎𝑥 = 0.6 × 12000 × 0.86 × 24 × 30 = 4,458,240
kWh
Average energy loss is obtained by taking the difference between calculated average consumed energy and average consumed energy from TANESCO. From table 2 the average consumed energy from TANESCO for three years under study is 2,803,883.3kWh.
∴ 𝐴𝑣𝑒𝑟𝑎𝑔𝑒 𝑒𝑛𝑒𝑟𝑔𝑦 𝑙𝑜𝑠𝑠
= Calculated average consumed energy in kWh − average consumed energy in kwh
= 4,458,240𝑘𝑊 − 2,803,883.3𝑘𝑊 = 1654356.7𝑘𝑊
𝐿𝑜𝑠𝑠 𝐹𝑎𝑐𝑡𝑜𝑟 𝐾 =
𝐴𝑣𝑒𝑟𝑎𝑔𝑒 𝑒𝑛𝑒𝑟𝑔𝑦 𝑙𝑜𝑠𝑠 𝑖𝑛 𝑘𝑊(𝑧)
𝐶𝑎𝑙𝑐𝑢𝑙𝑎𝑡𝑒𝑑 𝐴𝑣𝑒𝑟𝑎𝑔𝑒 𝐶𝑜𝑛𝑠𝑢𝑚𝑒𝑑 𝐸𝑛𝑒𝑟𝑔𝑦 𝑖𝑛 𝑘𝑊(𝑌) (10)
Voltage Sag
Sag duration in millisecond
60 70 80 90 100 150 200 300 500
90% 0 0 0 0 0 0 0 0 0
80% 0 0 0 0 0 0 0 0 0
70% 0 0 X X X X X X X
60% 0 0 X X X X X X X
50% 0 X X X X X X X X
40% 0 X X X X X X X X
30% 0 X X X X X X X X
20% 0 X X X X X X X X
ISSN: 2231-5381
http://www.ijettjournal.org
Page 65
𝐿𝑜𝑠𝑠 𝐹𝑎𝑐𝑡𝑜𝑟 𝐾 =1654356.7
4,458,240 = 0.37𝑜𝑟 37%
The loss factor of 0.37 obtained in this study reveals that the utility company TANESCO is losing up to 37% of total revenue due to power quality disturbances (voltage sag)
C.Model In Matlab/Simulink
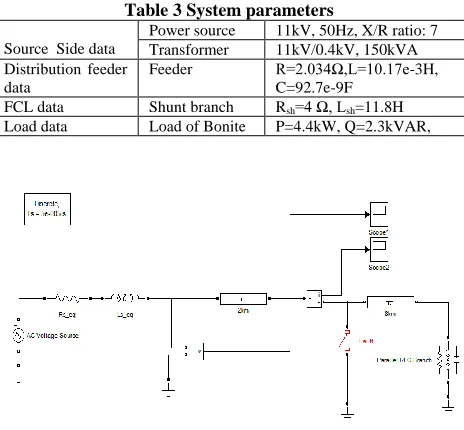
The single line diagram of existing distribution line was modeled in MATLAB/SIMULINK by using Simpower System.The system parameters for simulation are indicated in table 3. Two cases were considered, the first case was the simulation without SSFCL and the second case was modeled by incorporating with SSFCL as shown in figures 8 and 11 respectively.
Table 3 System parameters
Source Side data
Power source 11kV, 50Hz, X/R ratio: 7 Transformer 11kV/0.4kV, 150kVA Distribution feeder
data
Feeder R=2.034Ω,L=10.17e-3H, C=92.7e-9F
FCL data Shunt branch Rsh=4 Ω, Lsh=11.8H
Load data Load of Bonite P=4.4kW, Q=2.3kVAR,
Figure 8 Single line diagrams without incorporating SSFL
From the simulation result in figure 9 it is assumed that fault current occurs at 𝑡 = 0.2𝑠.the test case scenario performed with a time interval of 0.4𝑠. It is evident that, at this interval line current rises to a high value( from 100A to 500A) and Simulation result in figure 10 shows that bus voltage rapidly droped to a low level close to zero during faults.
Figure 9 Simulation results of fault current without SSFL
Figure 10 Simulation results of Bus Voltage without SSFL
D. Single line diagram of proposed distribution line incorporated with SSFCL
Depending on the current level, the SSFCL can limit higher current by a proper design of the limiting reactor. An automatic resetting is provided by the control system such that the SSFCL continues to limit the fault current as long as the fault continues and return it to the normal condition automatically after the fault is cleared. In order to detect fault clearance, current magnitude has to be monitored. If the current magnitude is below its reference value, clearance is assured and „turn on‟ signals are given to the GTO. In figure 11 the „LC‟ circuit acting as fault current limiter. From the simulation results figure 12 shows that fault current is limited to a significant level (i.e. decreased from 500A to 400A). Simulation results of figure 13 shows a slight rise of bus voltage with time (from close to zero to 100V)
Figure 11 Single line diagram incorporating SSFCL
Figure 12 Simulation results of fault current with SSFL
Figure 13 Simulation results of Bus Voltage with SSFL
V. CONCLUSION
ISSN: 2231-5381
http://www.ijettjournal.org
Page 66
modeled in MATLAB/SIMULINK by using Simpower System, Two cases were considered, the first case was the simulation without SSFCL and the second case was modeled by incorporating with SSFCL. The function of SSFCL in power system is to work asa circuit breaking element aswell as limiting the fault current to a safe value. SSFCL is considered asthe solution to the increment of short circuit current level in power system. It is the most economical optional compared to other conventional solution to overcome this matter. The effect of voltage sag variation caused by fault current was studied and data collected from distribution line was analyzed. Simulation results proved that SSFCL effectively limits the current during fault occurrence
ACKNOWLEDGEMENT
The authors wish to express gratitude to BBL and TANESCO administration for providing us with guidance and all compulsory data needed for this study.
LIST OF ABBRIVIATIONS AND ACRONYMS ASD Adjustable Speed Drive
BBL BoniteBotlers Limited FCL Fault Current Limiter PC Personal Computers PCC Point of Common Coupling PLC Programmable Logic Controllers PQR Power quality Recorder
SSFCL solid state faults current limiter TANESCO Tanzania Electric Supply Company. TCSC Thyristor Controlled Series Capacitors
REFERENCES
[1] Mehta V.K,(2004), Principle of Power System, New Delhi, Macmillan.
[2] Short T, Taylor L. and Power D,(2004) Practical Approaches to Reliability Improvement Transmission and Distribution World,3rdEdition, London, Pitman.
[3] Kisika .E.K, (2012), The Effects of Power Quality Disturbance and Power outage in Industries, Mbeya.
[4] Pansini A.J, (2005), Guide to Electrical Power Distribution Systems, Sixth Edition ,Pritoria, Intellectual Press.
[5] Sarmiento H. G, Tovar C, and Molero E, ( 1995), "A feasibility study for a fault current limiter to reduce voltage sags at sensible loads," in Industrial and Commercial Power Systems Technical Conference,. Conference Record, Papers Presented at the 1995 AnnualMeeting.,1995 IEEE, 1995, p. 99.
[6] Chang C. S. and. Loh P. C, (2001), "Integration of fault current limiters on power systems for voltage quality improvement," Electric Power Systems Research, vol. 57
[7] Salim K. M, Hoshino T,Kawasaki A. Muta I., and Nakamura T, (2003)"Waveform analysis of the bridge type SFCL during load changing and fault time," Applied Superconductivity, IEEE Transactions on, vol. 13, pp. 1992-1995,
[8] Conrad, L. E, (1994), “Proposed chapter 9 for predicting voltage sags
[9] (Dips) in revision to IEE std. 493, The Gold Book,” IEEE Transactions on Industry applications. Pp.805-821.
[10] Saeed W, (2013), Reducing the impacts of Distributed Generation in Transmission and Distribution Network Protection Using Fault current Limiter, Engineering and Technology Journal, Volume 31, Part A
[11] Chang C.S, and Loh P.C, (2001), Integration of fault current Limiters on Power System for Voltage Quality Improvement. Electric Power systems research, Volume 9.
[12] Kulworawanichpong T, (2003), “Modeling and Simulation of a Solid-state Breaker for Medium-voltage Feeder Protection using MATLAB‟s Power System Blockset”, in Proc. 2003 IEEE Bologna PowerTech Conference, pp. 30-35
[13] Verma M,(2009) A Comprehensive overview behavioral model and simulation of fault current Limiter. Blacksburg, Virginia. [14] Shahriari SAA, Abapour. M, Yazdian. A, Haghifam M.R,
(2010), Minimizing the Impact of Distributed Generation on Distribution Protection System by Solid State Fault Current Limiter. IEEE PES on Transmission and Distribution Conference and Exposition pp. 1-7.