http://www.sciencepublishinggroup.com/j/sr doi: 10.11648/j.sr.20180604.11
ISSN: 2329-0935 (Print); ISSN: 2329-0927 (Online)
The Research on the Flow Pattern Optimization of Biogas
Anaerobic Digester Using CFD Method
Ruyi Huang
1, 2, 3, Zili Mei
1, Yahan Yang
1, Enshen Long
2, Ziyun Wang
2, Jun Wang
2, Chuixue Kong
1, *1
Biogas Institute of Ministry of Agriculture & Key Laboratory of Development and Application of Rural Renewable Energy, Ministry of Agriculture, Chengdu, China
2College of Architecture and Environment, Sichuan University, Chengdu, China 3
Rural Energy Office of Sichuan Province, Chengdu, China
Email address:
*
Corresponding author
To cite this article:
Ruyi Huang, Zili Mei, Yahan Yang, Enshen Long, Ziyun Wang, Jun Wang, Chuixue Kong. The Research on the Flow Pattern Optimization of Biogas Anaerobic Digester Using CFD Method. Science Research. Vol. 6, No. 4, 2018, pp. 48-53. doi: 10.11648/j.sr.20180604.11
Received: September 26, 2018; Accepted: October 24, 2018; Published: November 12, 2018
Abstract:
The biogas plant provides high-quality, clean and renewable energy, reduces carbon emission, and can sovle rural energy shortage and mitigate environmental pollution. However, it has some defects in practice, such as poor liquidity, low biogas production rate, bad discharge, which limit its wide application . The critical method for solving this problem is agitation, but the methods of agitation must be well-designed, otherwise the biogas production could not be increased, even consuming more energy. Taking advantage of computational fluid dynamics (CFD), the flowing progress of biogas fermentation material fluid in the anaerobic digesters can be reappeared, the distribution curve of flow pattern can be obtained, the visualization of flow pattern can be achieved, the features and defects of flow configuration can be differentiated on the basis of the flow pattern visualization. In this present study, one 0.5 m³ anaerobic digester was chosen and the two water configuration modes of bottom agitation and dispersed exports were analyzed by CFD. The influence of the optimal design on the flow pattern was obtained. The results show that the optimization are different under different raw material conditions. Therefore, the agitation config could be well-designed based on the flow pattern which can be visualized using CFD method. Through the demonstration of this design opitimization, this paper introduces a general method to optimize the mixing config design of biogas plants using CFD method.Keywords:
Biogas, Mixing, Anaerobic Digester, CFD, Flow Pattern1. Introduction
Biogas plants produce high-quality, clean and renewable energy though digesting urban and rural organic wastes [1]. Meanwhile, collecting the powerful greenhouse gas methane (CH4) is greatly benefittial for environmental protection,
energy consumption and carbon emission reduction, it is a well and practical technology to solve rural energy shortage and environmental pollution [2]. But the biogas plants take the static fermentation process, lacking enough manual intervention and effective mixing, which cause poor liquidity, low efficiency fermentation and difficult discharges [3], limiting its wide application and format industrialization chain. The key to solve this problem is to analyze on the fermented liquid flow flied and eliminate the static fermentation and
optimize the flow flied [4]. But for a long time, a large number of biogas plants use poor mixing technology, which causes a little gains to the raise of biogas production, even consumes more energy [5]. One of the most important reasons is that the biogas anaerobic digesters should seal off in the strict anaerobic environment. However, people can not get the exact test for inner flow pattern, what causes that constructors add some mixing measures without understanding flow pattern, then the form of real flow pattern is too bad and not suited to digesters shape or raw material features [6]. For another hand, numerical simulation method can help people to get known about its theoretical flowing progress and flow pattern [7].
outlets on eliminating static fermentation and redistributing flow was simulated by the Computational Fluid Dynamics (CFD), which is the most popular method in the area of simulating the biogas fermentation fluid flow pattern [8]. Using CFD method, researchers can visualize the flow field formed by agitation [9], thus verifying and guiding the design of mixing mode more accurately [10-11], CFD has been become one of the advanced research areas of biogas field in the 21st century [12]. Prospects of the research and applications of this technology were discussed. According to simulate and construct the flow field of anaerobic digester using CFD method, and then optimize the design of mixing flow pattern, the effect of bottom inlet and decentralized pressure outlets rectifier water distribution technology is expounded, the method of optimal design of mixing scheme using CFD is also introduced.
2. Methods
2.1. Simulation Object and Conditions
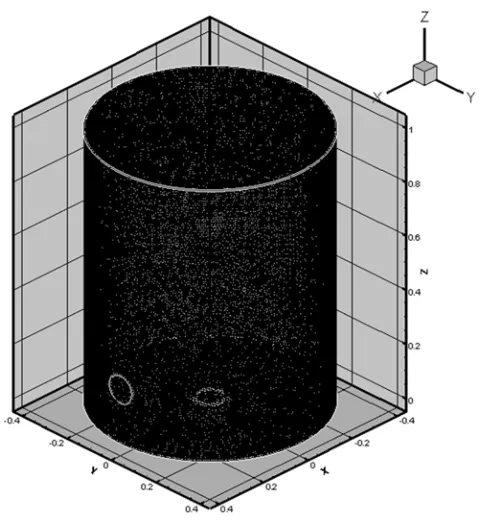
At first, a closed loop system is constructed, with each a hole each in the bottom and side. The power is provided by a pump, forming a hydraulic agitation. The study object of this article is limited to the liquid portion of the biogas fermentation tank, without considering the rest part of gas and the closed loop system. Therefore, only the object material liquid part of 1m height is chosen as the simulation calculation region. The model is simplified as a liquid column with 1 m height and two 0.1 m diameter circular holes, as shown in Figure 1.
1. liquid pipe 2. liquid zoom 3. gas zoom. 4. gas pipe 5. outlet 6. pump 7. inlet
Figure 1. Biogas fermentation device closed cycle system and liquid model diagram.
2.2. Mathematical Model
Ordinary water is used as the medium, the basic flow pattern in anaerobic is simulated and the rule of flow fields in diversified digesters is analyzed.
The fluid flow continuity equation is as follow.
0 (1)
The momentum equation is as follow.
⋅ ρu u ρf (2)
⋅ ρu u ρf (3)
⋅ ρu u ρf (4)
In the formula, the ▽ is Hamilton differential operator:
i j k (5)
2.3. Numerical Methods
The control volume method is applied. According to the grid, 1,000 grids on each side and in total 3,383,839 grid elements are generated, the grid model is shown in Figure 2.
Figure 2. The grid of fermentation liquid.
3. Selection of Velocity Entrance
Direction
3.1. Choosing the Agitating Mode
ways, pointed out that, while the concentration was low, the effect of each agitating modes on enhancing the biogas production rate was not obvious. But while the concentration of TS (Total Solid) reached 10%, the biogas production rates of three agitating modes were higher than that of no agitating mode by 22%, 29% and 15%, respectively, which illustrated the hydraulic agitation was perhaps the best agitating mode. Regarding the agitating position, mainly two controversy opinions exist, lateral inserted agitation or bottom agitation [15]. In this paper, the velocity entrances of hydraulic agitation are respectively set to the lateral and bottom, the fluidization effect is simulated with the CFD and the optimal model is tested further, in order to make the comparative analysis.
3.2. The Pattern of Lateral Inflow and Bottom Outflow
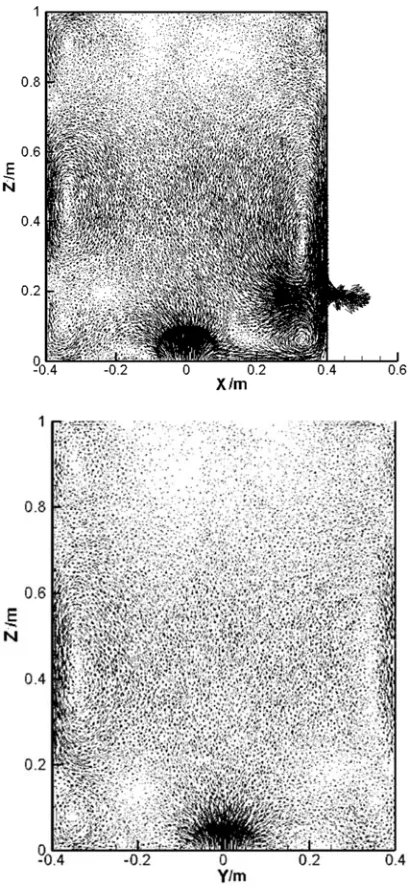
Figure 3. Lateral inflow, the velocity vector diagrams of y = 0 and x = 0 sections.
The boundary condition for the inlet velocity is set as 1 m/s.
The gravity acceleration is set as 9.81 m/s2. The simulation results are shown in Figure 3. It can be found that the velocity distribution is not uniform seriously, the hydraulic path between the inlet and outlet is very obvious. Meanwhile, the velocity of remaining zoom is very low, especially in the high zoom.
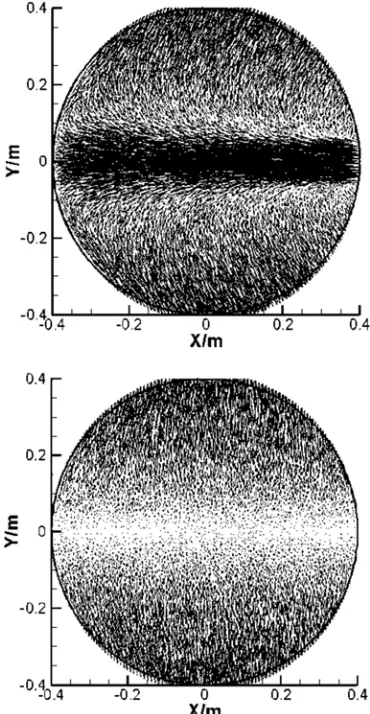
Figure 4. Lateral inflow, the velocity vector diagrams of z = 0.2 and z = 0.8 sections.
Two sections of 0.2 m and 0.8 m height are intercepted in order to compare, given in Figure 4. The velocity of high zoom is far less than that of the low. Perhaps it is due to that the acceleration of gravity is perpendicular to the initial velocity, so the deviation of acceleration is very serious.
3.3. The Pattern of Bottom Inflow and Lateral Outflow
Figure 5. Bottom inflow, the velocity vector diagrams of y = 0 and x = 0 sections.
Figure 6. Bottom inflow, the velocity vector diagrams of z = 0.2 and z = 0.8 sections.
The simulation results are shown in figure 6. The velocity gap between two sections of 0.2 m height and 0.8 m height is far less than that of the last agitating mode. Perhaps it is owing to that the acceleration of gravity directs to initial velocity in the vertical direction, so it doesn’t cause serious deviation of flow in one side of a direction.
3.4. The Pattern of Bottom Inflow and Top Outflow
Through the comparison of the above two kinds of water inflow direction, the flow field distribution of bottom inflow is more uniform and the influence range is larger. Therefore, for the choice of agitating mode, bottom agitation is better than lateral inserted agitation.
4. Optimal Designing of Pressure Outlets
4.1. Design of Dispersed Exports
Figure 7. Distributed pressure outlet design schematic diagram.
1. liquid pipe; 2. liquid zoom; 3. gas zoom; 4. gas pipe; 5. Outlet; 6. Inlet; 7. pump
zoom to be little, and the flow velocity of the zoom to be higher than that of the lateral pipe sharply, nearly close to zero, which indicates that the fluidization effect in the total zoom is not ideal. Therefore, the design needs to be changed. The water outlet pipe is set from bottom to the height of 0.8 m, composed with four exports, so it is expected to form a plurality of circulation loop in the zoom, redistribute velocity, pressure and flow, as shown in figure 7.
4.2. Basic Flow Field Simulation and Optimal Design
The flow field of bottom inflow model is simulated according to the optimal design. The control volume method is still set up. According to the grid, 300 grids on each side and in total 2,921,029 grid elements are generated, the grid model is shown in Figure 8.
Figure 8. Schematic diagram of dispersed exports model grid.
The initial condition for the inlet velocity is set as 1m/s and acceleration of gravity is 9.81 m/s2. The simulation results are shown in Figure 9. The higher zoom acquires more kinetic energy than that of the original model. The velocity distribution is much more uniform.
Figure 9. Dispersed exports, velocity vector diagrams of y = 0 and x = 0 sections.
The simulation results are given in Figure 10, the velocity of the 0.8 m high section is larger than that of the 0.2 m section and their distribution is very uniform. In this case, while agitation is stopped, the liquid will sink along the direction of gravity; while agitation restarts, it rises up again, which is extremely beneficial for the uniform mixing.
The simulation results are shown in figure 10, the velocity of the cross section with height of 0.8 m is larger than that of the 0.2 m section and their distribution are all uniform. In this case, as stopping stirring, liquid will sink along the direction of gravity; while restarting up again after mixing repeatedly, tumbling is formed, which is extremely beneficial for the uniform mixture [16].
5. Conclusions
As hydraulic agitation model, the direction of the inflow can not be vertical with the gravity, or it will cause the acceleration deviate from the vertical direction and result in uneven distribution of flow field. On one hand, it could avoid the velocity being unparallel with the acceleration. On the other hand, it could form tumbling at the time of intermittent. Therefore, it is reasonable to arrange the velocity of entrance opposite to the direction of the gravity acceleration. In general biogas plant, the outlet is close to the bottom of the anaerobic digester in order to discharge residues unhindered. As hydraulic agitation model, the pressure outlet should be higher in order to avoid uneven flow field, to expand the influence range of hydraulic agitation and to promote mixture of all zooms. It could form a plurality of pressure outlets by dispersed discharging pipes, and form a plurality of hydraulic circulation pathways in the anaerobic digester which cross each other. It can greatly optimize the flow field in digester by redistributing velocity, pressure and flux.
Acknowledgements
The authors gratefully acknowledgement the financial support from the Agricultural Science and Technology Innovation Program (ASTIP) of Chinese Academy of Agricultural Sciences; the National Nature Science Foundation of China under Grant No.51308361 and the National Key Technology Support Program (2015BAD21B03).
References
[1] Kougias P G, Angelidaki I. Biogas and its opportunities—A review [J]. Frontiers of Environmental Science & Engineering, 2018, 12(3):14-25.
[2] Ruiz D, San G M, Corona B, et al. Environmental and economic analysis of power generation in a thermophilic biogas plant. [J]. Science of the Total Environment, 2018, 633:1418-1428.
[3] Qiu L, Wang LY, Yang P. Control on the dynamic fermentation technology of rural biomass project [J]. Renewable energy resources, 2005, (1):47-49.
[4] Huang R Y, Feng L, Guo T, et al. Research Progress in Promoting Biogas Fermentation Efficiency by Stirring [J]. China Biogas, 2017, 35(5):43-49.
[5] Luan D, Qiao C, Zhou S. Numerical Simulation and Analysis of Power Consumption and Metzner-Otto Constant for Impeller of 6PBT [J]. Chinese Journal of Mechanical Engineering, 2014, 27(3):635-640.
[6] Zhongqian H, Brief introduction of design of small tank methane tank [J]. China Biogas, 2000: 18(4):33-34.
[7] Binxin Wu. Advances in the use of CFD to characterize, design and optimize bioenergy systems. Computers & Electronics in Agriculture, 2013, 93(2):195–208.
[8] Fleming J G. Novel simulation of anaerobic digestion using computational fluid dynamics [D]. Raleigh: North Carolina State University, 2002.
[9] Mendoza A M, Martínez T M, Vicente Fajardo Montañana, et al. Modeling flow inside an anaerobic digester by CFD techniques [J]. International Journal of Energy & Environment, 2011, 2(6):963-974.
[10] Stamou AI. Improving the hydraulic efficiency of water process tanks using CFD models [J]. Chemical Engineering & Processing Process Intensification, 2008, 47(8):1179-1189. [11] Fei S, Tian L, Yuan H, et al. Improving the mixing
performances of rice straw anaerobic digestion for higher biogas production by computational fluid dynamics (CFD) simulation [J]. Applied Biochemistry & Biotechnology, 2013, 171(3):626-642.
[12] Jun Wang, Qingwen Xue, Ting Guo, Zili Mei, Enshen Long, Qian Wen, Wei Huang, Tao Luo, Ruyi Huang. A review on CFD simulating method for biogas fermentation material fluid [J]. Renewable & Sustainable Energy Reviews, 2018, 97:64-73.
[13] Yang H, Deng LW, Zhang GZ, Lei YH, Shi GZ. A review on effects of stirring on biogas production of anaerobic digestion [J]. China biogas, 2010, 28(4), 3-10.
[14] Karim K, Hoffmann R, Klasson T, et al. Anaerobic digestion of animal waste: waste strength versus impact of mixing. [J]. Bioresource Technology, 2005, 96(16):1771-1781.
[15] Cai X J, Wu L Z. Explore the structure of the lateral inserted agitator [J]. Petro-Chemical Equipment, 2001, 5(30): 45-46. [16] Luo T, Long Y, Li J, et al. Performance of a novel downward