TECHNOLOGICAL PROCESSES AND STAGES OF PLANT GROWTH AND
DEVELOPMENT
Assoc. prof. Mitev G.V. Principal assistant Bratoev K.P. ―Angel Kanchev‖University of Ruse – Ruse, Bulgaria
[email protected], [email protected]
Abstract: The importance of agriculture lies in the fact that its organic substances are an irrevocable source of energy without which the existence and everyday life of man and a substantial part of the animal world are impossible. Man, as a higher biosystem, defines the nature and importance of agriculture as a production sector.
KEY WORDS: PLANT GROWTH, NATURE, DEVELOPMENT
1.
Introduction
The importance of agriculture lies in the fact that its organic substances are an irrevocable source of energy without which the existence and everyday life of man and a substantial part of the animal world are impossible. Man, as a higher biosystem, defines the nature and importance of agriculture as a production sector.
2.
Materials and method
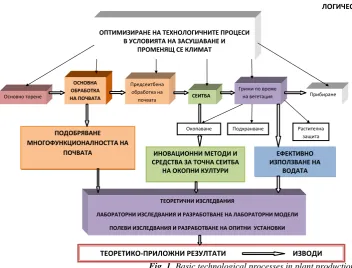
The main technological processes to be carried out in field production with the necessary quality and volume in the cultivation of crop production are mainly fertilization, mainly soil reversal, pre-sowing soil treatment, pre-sowing, care during vegetation and harvesting. Their success, as well as the technique used, depends on the success of the entire production in agriculture. The logical framework of the technological sequence is presented 1.
ЛОГИЧЕСКА РАМКА НА ИЗСЛЕДВАНИЯТА
ОПТИМИЗИРАНЕ НА ТЕХНОЛОГИЧНИТЕ ПРОЦЕСИ В УСЛОВИЯТА НА ЗАСУШАВАНЕ И
ПРОМЕНЯЩ СЕ КЛИМАТ
Основно торене
ОСНОВНА ОБРАБОТКА НА ПОЧВАТА
Предсеитбена обработка на
почвата СЕИТБА
Грижи по време
на вегетация Прибиране
ПОДОБРЯВАНЕ МНОГОФУНКЦИОНАЛНОСТТА НА
ПОЧВАТА
Подхранване Растителна защита
ЕФЕКТИВНО ИЗПОЛЗВАНЕ НА
ВОДАТА ИНОВАЦИОННИ МЕТОДИ И
СРЕДСТВА ЗА ТОЧНА СЕИТБА НА ОКОПНИ КУЛТУРИ
Окопаване
ТЕОРЕТИЧНИ ИЗСЛЕДВАНИЯ
ЛАБОРАТОРНИ ИЗСЛЕДВАНИЯ И РАЗРАБОТВАНЕ НА ЛАБОРАТОРНИ МОДЕЛИ ПОЛЕВИ ИЗСЛЕДВАНИЯ И РАЗРАБОТВАНЕ НА ОПИТНИ УСТАНОВКИ
ТЕОРЕТИКО-ПРИЛОЖНИ РЕЗУЛТАТИ ИЗВОДИ
Fig. 1. Basic technological processes in plant production
Coordination of technological processes with the
biological features of plants
Successful activity in the field of agricultural production would be a real magnitude if we take into account and determine the correlation between the growth and the development of the plants applied technological processes.
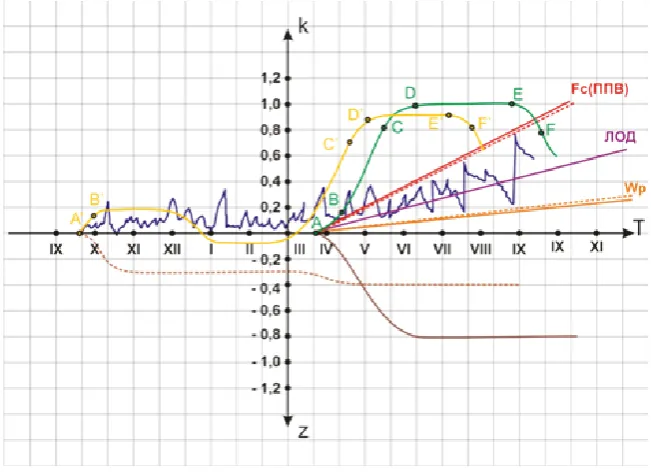
In crop plants, the following more important phases are known: sprouting, germination, third leaf, braking, spraying, decapitation, flowering, grain formation and pouring, and maturation, fig.2.
For their proper development correspond technological processes, which should be carried out in optimal agrotechnical terms and with the necessary quality.
The main fertilization, the basic and the pre-sowing treatment of the soil ensure the execution of quality sowing. After the sowing, the first germinating phase is activated, (¯AB of Figure 2). It begins with the swelling of the nipple and ends with the appearance of the germ root and swears. Optimum moisture, temperature and oxygen are needed for seed germination and their values vary by crop type. For the sap, the seeds should absorb about 50% of their mass.
The second most important factor is the temperature. It has been proven that wheat and barley can germinate at 1-2 oC. The
lower the temperature, the slower the germination occurs and vice versa.
The presence of oxygen has a significant effect on germination. Its absence stops the conversion of insoluble substances into soluble and the seed does not germinate. The air is insufficient in the over-moistened heavy, fractured and formed crust soils.
In the conditions of Bulgarian agriculture, the biggest problem is the humidity, especially in winter cereal crops. On dry soil the seed may remain for a long time without damaging it. Seed sowing is very dangerous in so-called. "Colorful moisture" where part of the seeds germinate and die, resulting in a rare and uneven crop.
injury, causing disturbance to growth. The distribution of the root system in depth and sideways depends both on climatic conditions and on those created in the soil, depending on the applied soil
cultivation technology. The choice of variety or hybrid also affects.
Fig. 2. Coordination of technological processes with the stages of growth and development of plants
green color - annuals; yellow color - wintering. point A - sowing; ¯AB - period of germination and germination; - beginning of a third-phase third-phase; ¯B a period of rapid growth; tC - beginning of braking, (spindle, flowering); ¯D - yield betting period; ieD - shaping of the teats, (class, cat); ¯DE - accumulation of yields; ie - reaching technological (waxy) maturity; ¯EF - optimal agro-technical time for harvest;
F - completion of the cultivation and harvesting technology of a given crop and preparation of the next crop
Consequently, depending on the biological pests of crops grown, a specific technology for plant nutrition, soil cultivation and sowing should be applied.
Typically, about 30-35% of the keno system is located in the 0-0.05 m layer, 50-60% at a depth of 0.35-0.55 m and about 10% in the deeper layers. This feature should be taken into account when determining the type and depth of soil treatment.
From the point C (beginning of flowering, twisting, grinding) there is another critical period related to the presence of sufficient nutrients and water, although the availability of sufficient water is an important condition. In the climatic conditions of the Republic of Bulgaria, the optimum soil moisture must be maintained in the bush 70-75% of the MFA. During blooming (spraying, grinding), soil moisture should be 80-85% of PFF in the
soil layer to a depth of 0.50 m. The amount of water required depends on calculating the water balance in the soil, reaching values of 600 - 670 mm.
After shaping the clams, the soil and the nutritional status of the soil should be maintained around the optimum yield line (Figure 2 - LOD).
Stages of plant development and their water needs Interest in modeling of processes is the development of annual plants, which are the main representatives of plant growing.
Three phases of development can be distinguished during their vegetation period - an exponential phase, a phase of full development, and a phase of maturation and dying growth. (Figure 3)
Еxponential phase Linear phase
Growth attenuation (maturation and dying)
Time
Fig. 3. Schematic representation of the growth of annual plants as a function of time (dashed line and accumulation of biomass over the three periods - continuous line
In mild climate conditions, the three phases of development usually coincide with the spring, summer and autumn seasons. They also limit the length of periods.
are the basis for a deeper analysis that can be done when physiological processes are dealt with in detail.
The main methods for classical analysis of plant growth and development can be applied after relatively more schematic models are developed.
3. Phases of growth and development
When plants are in their exponential phase of development, most of the space around them is still not filled with other plants. The appearance of each new sheet helps to absorb more light and thus increases the growth rate of the plant. There is still no overshadowing and the contribution of the newly formed leaves is assumed to be equal to that of the existing ones. Therefore, the growth rate remains unchanged. Plants are still green in this exponential part. Later, when the leaves begin to gradually
self-glance and the leaf index (LAI) reaches 3 m2/m2 or more, the newly
formed leaf surface contributes to a large extent to the absorption of the light rays. From now on, this first (exponential phase) goes into the phase of linear development. This does not mean that the index will no longer increase. When optimal amounts of water and nutrients (especially nitrogen) are present, LAI may reach values of
6 m2 or more, but these values do not contribute to the accumulation
of additional biomass, growth remains linear. During this period dry matter build up.
The final phase of plant growth begins when it begins to reduce the absorption of light from the leaves and the leaf index value falls below 3 m2/m2. The LAI reduction, for example, of 6 m2/m2 means that the process of transferring nutrients from the foliage to the storage organs (grain, roots, tubers, etc.) has begun. Holding LAI at values slightly higher than m2 / m2 has a relatively
small effect on plant growth. Values below 3 m2/m2 show a strong
reduction in plant growth and degeneration of the photosynthetic system. There are also slight differences in the accumulation of dry matter when the yellowing leaves remain on the plant. This can be observed in cereals.
Figure 4 shows the relationship between dry matter accumulation and leaf index of plants. The dry mass w accumulates as a value s that can be calculated during the exponential phase by data for itself or by the value of the relative increase rm. During the linear phase s depends on the maximum linear increment cm. Therefore, c can be determined by the amount of absorbed light I, which in turn is dependent on LAI.
w
cm tb
Time
Fig.4.Exponential growth curve (w - accumulation of biomass, [gm-2], cm - the maximum increase value, [g m-2 d-1], tb - the moment when the linear development phase begins [d]
LAI can be defined in two quite different ways:
• One is by using the relationship between the leaf area and the accumulated dry matter, so dL/dt depends on c;
• The second is to use the temperature instead of dL/dt to
determine dry accumulation values.
These two ways are extremes that can be used, but there are a number of others. Who to implement is a matter of experiment and analysis of results.
For the first (exponential) development phase the equation describing the exponential development of plants is:
m
wr
dt
dw
[g m-2 d-1]; (1)) (r t o
m
e
w
w
[g m-2] (2)where:
w is the accumulated biomass, [dry matter, gm-2];
wo– the start of the biomass accumulation, [gm
-2
];
rm - the value of relative biomass accumulation during plant growth,
[gg-1d-1];
t – the time, [d].
Exponential development is only possible when the plant
cover is relatively small or approximately when about 100 gm-2
biomass is accumulated. The value of relative biomass accumulation during plant growth, rm, is completely dependent on temperature, solar radiation and the type of crop. The numerical value is rm = 0.1 gg-1d-1 at the beginning of the period. Doubling of the value can be expected after one week (ln (2) /0.1d) and tenfold increases in 23 days (ln (10) /0.1d).
Linear phase of plant growth The equation for the linear phase is
m
c
dt
dw
[g m-2 d-1]; (3))
(
bm
t
t
c
w
[g m-2] (4)where:
w is the accumulated biomass, [gm-2];
cm - maximum growth value, [gm
-2
d-1];
t – the time [d];
fb - the time of the plants entering the linear phase, [d].
The determination of the time of plant passage in its linear phase of development is based on observations. The beginning of this transition is the day when the plant cover completely covered the soil.
The easiest way to determine the amount of biomass accumulated at this time is by comparing the values obtained at the exponential and initial stages. For practical purposes, it can be assumed that the moment of transition has occurred when the maximum growth value (cm) reaches values of 20 [gm-2d-1]. If we
take into account the relative growth value, which is 0.1 [gg-1d-1],
200 gm-2d-1 accumulated biomass will be obtained at the time of the
linear phase transition.
Transition from exponential to linear growth
If it is assumed from a purely theoretical point of view that plant growth can be divided into a purely exponential and purely linear phase, the moment of transition from one phase to the next could be described by equality:
m m
w
c
r
[g m-2 d-1] (5)The ratio values
m m
r
c
determine when the transition from
one phase to the other occurs. The amount of biomass that accumulates to reach this ratio is assumed with the same productivity as the one already accumulated, whereas after the critical point has passed, the accumulated biomass no longer influences the increase in the growth rates. This kind of growth process is not very common. An example of this is the plants that have leaf rosettes and horizontally arranged leaves and vertical standing. In this case, each new sheet absorbs the same amount of light as when the whole soil surface covers a plant cover.
absorb more light, but mutual shading will arise from planting upward. This gradual transition can be described by an exponential growth equation.
( )
1
ln
rm t tbm m
e
r
c
w
[g m-2] (6)Equation 6 gives an accurate description of the moment of transition from the exponential to the linear phase.
It is known that the process of plant photosynthesis and transport of asymylates to plant organs and tissues depends entirely on the intensity of light. This part of the light rays that reach the surface of the soil is a loss for photosynthetic activity usually reduced in exponential dependence on the foliar index of plants (LAI).
) * ( K LAI o
b
I
e
I
[J m-2 s-1] (7)where:
Ib is that part of the photosynthetic active radiation that reaches the surface of the soil and is a loss for the plants, [PAR, Jm-2s-1];
Io – the photosynthetic active radiation,, [PAR, Jm
-2
s-1];
K –the radiation attenuation factor, [m2 soil surface, m-2 leaf surface];
LAI – the index [LAI, m2 leaf area, m-2 soil area].
The degree of light absorption increases with increasing LAI, thus increasing the value of the assimilates. But if it is expressed through LAI, growth will gradually decrease. The value of K depends on the light, the positioning of the leaves and their characteristics. For PAR values, K = 0.7 is taken as the mean value.
The Monteith (1981) trials show that daily growth rates correlate with the daily amount of light absorbed by plants. Since PAR is about 50% of the total solar radiation, the calculation can be used for the convenience of calculations.
Monteith determines the relationship between PAR and total radiation.
GR
PAR
(8)Expressed in this way, it takes values between 0.8 for
leguminous crops and 1.5 [
gJ
1] for mixed crops (wheat).Maximum growth rates, cm, can be established if they are
proportional to
I
o(
c
m
I
о)
and then dependence can beobtained:
m
fc
dt
dw
[g m-2 d-1] (9)where:
f is the fraction of the total radiation absorbed by the plants expressed by the exponent of LAI and the radiation attenuation factor:
) * (
1
e
K LAIf
(10)The method for assessing plant growth values works well if:
- a known LAI. LAI can be determined by measurements during vegetation by direct measurements or destructive (plants are destroyed after measurements);
- the intensity of light above and below the plant cover is known;
- using modern remote measurement technique (satellite connection).
The cost of obtaining this data is considerable.
Another approach that could be used if there is no instrument for direct measurement of the leaf area without destroying the plant is the introduction of a supplementary unit weight - leaf weight index (LWR). It is a ratio of the total leaf biomass relative to the total dry matter mass of the whole plant. This quantitative approach can be realized by periodic harvesting of plants (destructive method).
The same approach can be applied to the so-called a specific leaf area (SLA) that grows in the ratio of the leaf area and the accumulated biomass in the leaves of the plants.
The same characteristics can also be obtained by using static and dynamic coefficients describing the state of the dry matter and the specific leaf area. The static coefficients refer to the total amount of dry matter accumulated and the dynamic ones to that accumulated in the last formed leaves.
Models describing the growth and development of plants The main task of the developed models describing plant growth is to enable the description of a possible larger number of crops. At the same time, each culture has unique values of the parameters included in the models.
The actual growth of plants from sowing / planting to harvesting depends on the accumulated temperature.
A Mitchel equation was used to describe the temperature model (Mitchel G. et al., 1997).
The growth of plants from a given crop is based on the accumulated daily temperature.
j k
k n
к
k
Tb
T
T
HU
max, min, ,1
2
HUk 0 (11)
where:
• HUkis the amount of heat accumulated during the growing season;
• Tmax, k- maximum temperature on day k, [oC];
• Tmin, k- the minimum temperature on day k, [oC];
• Tb, j- the specific temperature above which is observed
for culture development j, [oC]; (no development below or equal to
that temperature Tb);
n - the number of days in the growing season.
Perennials maintain their root system throughout the year, although they may be forced to rest if severe colds occur. They resume development when the average daily temperature exceeds the temperature minimum.
PHUj
HU
HUI
i
k k
i
1 (12)where:
• HUIi is the heat index for day i;
• PHUj - the potential thermal minimum required to maintain a
culture j.
The heat index changes from 0 at sowing to 1 at harvesting 1.0. The PHU values can be calculated using the model for the normal sowing and harvesting dates. The harvest date, leaf growth and ripening, optimal nutrient concentration, and distribution of accumulated dry matter between the roots, stem, leaves, and yield are influenced by HUI. In a number of cases, information can be found in the reference literature.
This approach is used to segment crops according to their specific heat and climate requirements in a given region or country.
Potential development of plants
j
j
j
RA
LAI
PAR
0
.
5
1
exp
0
.
65
(13)where:
• PARj is the total solar radiation reaching the surface of the leaves
for day j, [MJ m-2]; (Rn)
• RAj- the denticulated radiation for day j, [MJ m
-2
]; (R5) • LAIj – the leaf area index for the day j.
The constant 0.5 is used to convert solar radiation into photosynthetic active radiation (Monteith, 1973). Attempts show that the declining coefficient changes and depends on plant cover, sunlight, line spacing, line orientation, and latitude. (Thornley, 1976). Values around f (0.65) are typical for crops with small line spacing (Uchijima et al., 1968). Smaller values (0.4 - 0.6) refer to tropical areas where the average sun angle is high and the line spacing is greater. (Begg et al., 1964; Bonhomme et al., 1982;
Muchow et al., 1982).
Using the (Monteith, 1977) approach, the potential daily growth of biomass can be determined by the equation:
j
ij
p
BE
PAR
B
,
0
.
01
(14)where:
• Δp is the daily potential growth of biomass, [t/ha]; • BE – the plant parameter to convert energy into biomass, [kg/ha MJ/m2]
• The conversion of energy into biomass depends on the vapor pressure deficit (VPD) and the level of CO2 in the atmosphere.
The plant parameter for converting energy into biomass BE is determined by the Stockle equation (1992)
1 2 2
2
2
exp
100
*
CO
bc
bc
CO
CO
BE
(15)where:
• CO2 is the level of CO2 in the atmosphere, [ppm]
• bc1 and bc2 are the parameters of the culture.
The correction of the VPD vapor pressure can be done with the equation:
1
*
3
BE
bc
VPD
BE
VPD 0.5 (16)where:
• VPD is the vapor pressure deficiency, [kPa]; • bc3 - the parameters of the growth plants.
4.
Conclusions
:
All plant growing processes are important, but the planting is among the first. Ensuring favorable conditions for joint emerging lead to normal development of all plants and based on that the technologist can implement other processes on time and to reduce the yield losses.
The space and soil volume that each plant need for its normal development can be ensured y the correct adjustment of the planting machine. So, the LAI and other parameters will depends on this action and the plant growing models can be build accordingly.
5.
References
:
1. Александров В., Н. Славов. 1998. Колебания на
добива на царевица в зависимост от
метеорологичните условия. Растениевъд ни науки, т.35 1, стр. 11 - 17.
2. Василев, К. Ат. Технологии в земеделието, Русе,
2012
3. Върлев, И., П.Петков, З.Дянков, 2004.
Напояването – основен фактор за намаляване на
пораженията от сушите в земеделието. Водно дело 1-2, стр.22-28.
4. Колев, Б., Русева, С., Димитров, Д. 1992. Оценка
на стандартна почвена информация за целите на моделирането и технологичното проектиране в растениевъдството. Почвознание, агрохимия и екология, 27. (2): 15-18.
5. Колева К. 1987. Многогодишни колебания в хода
на температурата на въздуха и валежите в България. Сп. Проблеми на мет. и хидр., кн. 2 стр. 27 - 40.
6. Лозанова Л., Русева Св. 2011. Динамика на
почвената влажност по време на моделен дъжд върху карбонатен чернозем при наличие на уплътнен слой под почвената повърхност,
Международна конференция ―100 години
почвена наука в България‖,311-314.
7. Митев, Г.В., Технологии и системи за земеделско
производство, (Първа част: Основи на
технологиите в земеделието, Академично
издателство на Русенския университет, 2018).
8. Митев, Г.В., Подобряване водозадържащите
свойства на почвата. Проект No:1, НФНИ, Русенски университет „Ангел Кънчев― Scientific report—Improving soil water holding capacity, unpublished, (1) (2012) 34-40.
9. Славов Н.,В.Александров. 1998. Използване на
математични модели на агроекосистеми за устойчиво производство в земеделието. Сп. Почвознание, агрохимия, екология. т.XXXII кн.6,стр.15-16.
10. Allen, R.G., Pereira, L.S., Raes, D., Smith, M., 1998. Crop evapotranspiration: guidelines for computing crop water requirements. In: United Nations FAO, Irrigation and Drainage Paper 56. FAO, Rome, Italy.
11. Bhalla, N. (1991). Object-oriented data models: a
perspective and comparative review. Journal of information Science, 17: 145-60.
12. Bowen, I.S., 1926. The ratio of heat losses by conduction
and by evaporation from any water surface. Physics Rev. 27, 779–787.
13. Businger, J.A., Miyake, M., Dyer, A.J., Bradley, E.F.,
1967. On direct determination of turbulent heat flux near the ground. J. Appl. Meteorol. 6 (6), 1025–1032. 14. Campbell, D. J., and K. Hensland, 2000. In: K.A. Smith
and C.E. Mullins (eds) ―Soil and environmental Analysis‖, Physical Methods‖, Second edition, marcel and Dekker, Inc. New York: 325-348.
15. Evett, S.R., Tolk, J.A., Howell, T.A., 2006. Soil profile water content determination: sensor accuracy, axial response, calibration, temperature dependence, and precision. Vadose Zone J. 5 (3), 894–907.
16. Mitev, G.V., Kr. Bratoev, J. Demirev. 2013.
Improvement of Plant Growing Techniques in Drying up and Watrer Scarsity Conditions, Journal of Environmental and Science Engineering A, (2013) Vol. 2, 593 – 606.
17. Popova, Z., S. Eneva, L.S. Pereira, 2006. Model
![Fig.4.Exponential growth curve (w - accumulation of biomass, [gm-2], cm - the maximum increase value, [g m-2 d-1], tb - the moment when the linear development phase begins [d]](https://thumb-us.123doks.com/thumbv2/123dok_us/8586812.1720099/3.595.48.286.298.396/exponential-growth-accumulation-biomass-maximum-increase-moment-development.webp)
