SCHEME OF TREATMENT AND ITS EFFECT ON THE STRAIN HETEROGENEITY
AND STRUCTURAL CHANGES IN BILLETS OF LOW-CARBON STEEL
СХЕМА НАГРУЖЕНИЯ И ЕЕ ВЛИЯНИЕ НА НЕОДНОРОДНОСТЬ ДЕФОРМАЦИИ И СТРУКТУРНЫЕ
ИЗМЕНЕНИЯ В ЗАГОТОВКАХ ИЗ НИЗКОУГЛЕРОДИСТОЙ СТАЛИ
V.I. Semenov1, 2, G.A. Aleshin2, A.G. Raab2, N. Tontchev3, V. Kamburov3, E. Yankov4 1
Institute of Strategic Studies, Ufa, Russia 2Ufa State Aviation Technical University, Ufa, Russia, 3
Todor Kableshkov Higher School of Transport, Sofia, Bulgaria
4
University of Ruse Angel Kanchev, Ruse, Bulgaria
Annotation: The paper presents the results of numerical modeling of the conventional drawing and free torsion processes of rods made of
low-carbon steel using the "DEFORM-3D" software package. The heterogeneity of the strain intensity distribution in the investigated processes revealed in the model basically corresponds to real physical experiments with similar parameters of the structural heterogeneity. A mutual correspondence of the ductility diagram to the character of the structural changes in the samples deformed by free torsion is established, and the limiting values of the ductility margin, the excessof which leads to the development of fracture processes.
KEYWORDS: SEVERE PLASTIC DEFORMATION, MATHEMATICAL MODELING, DRAWING, FREE TORSION, MICROSTRUCTURE, STRAIN HETEROGENEITY, MICROHARDNESS, DUCTILITY DIAGRAM.
1. Introduction
Severe plastic deformation (SPD) is one of the most effective ways to enhance the complex of physicomechanical properties of metallic materials by refining the structure to ultrafine-grained (UFG) and nanocrystalline (NC) states. For the formation of UFG and NC structures, as a rule, complex deformation schemes are used: high pressure torsion, equal-channel angular pressing, screw extrusion, etc. [1-3].
Despite the differences in the loading conditions, all these schemes combine one thing - the structure refinement occurs due to active shear deformation of the metal under constrained conditions under the joint action of compression and tension. Further development of SPD methods involves the creation of combined loading schemes with the obligatory inclusion of the shear component of the deformation.
The most known and widespread scheme of pure shear is free torsion [4]. The combination of this scheme with the reduction scheme used for drawing can be promising for dispersing the structure, and as a result, increasing the complex of mechanical properties.
In this connection, the present paper aims to study the effect of two different loading schemes, conventional drawing and free torsion, on the change in the intensity of deformation and the transformation of the structure corresponding to these changes occurring in low-carbon steel with the selected treatments, as well as establishing the relationship between these changes and mechanical properties. To solve this problem, it is proposed to estimate the intensity distribution of plastic deformation using numerical simulation, which will allow comparing the results of calculations with the observed changes in structure and properties.
2. Material and methods of research
Low-carbon steel Fe-0.1C in the as-received condition - a calibrated rod with a diameter of 10 mm in accordance with RF standard 10702-78 – was used as the material for investigation. When developing a numerical model, the rheological properties of low-carbon steel Fe-0.1C were selected according to the recommendations in [5].
To implement the procedure of numerical simulation, the standard software package "DEFORM-3D" was used.
In order to carry out the simulation in"DEFORM-3D" software package, 3D models were previously created in the software product "Compass-3D".
2.1. Accepted assumptions to the drawing model
1) the material of the billet in the as-received state is isotropic and there are no initial stresses and strains in it;
2) the temperature of the deformation environment was assumed to be 20° C;
3) the tool is absolutely rigid, and the geometry of the tool is automatically recorded;
4) the material of the initial billet was assumed to be ductile; 5) for modeling, 100 steps were selected, taking into account the full passage of the billet in the dies and obtaining a stable result; 6) the billet is divided into 45,000 trapezoidal elements; 7) coefficient of friction between the billet and the tool according to Siebel is 0.12;
8) drawing speed – 0.95 mm/sec; 9) the number of transitions is 6;
10) the degree of deformation on one pass is 15 ... 20%.
2.2. Accepted assumptions to the free-torsion model
1) the tool is an absolutely rigid body;
2) the material of the initial billet was assumed to be ductile; 3) diameter of the initial billet is 10 mm, length 250 mm; 4) the number of finite elements is 35,000;
5) the simulation was carried out in 180 steps with a time step of 1 sec. and a rotation speed of 12.5 rpm;
6) processing temperature is 20° C; 7) the number of revolutions is 16.
For in-situ tests, drawing through conical dies was used. Free torsion of the samples was carried out on a lathe with cantilever fixation of both ends of the billet in a rotating and stationary cartridge.
Rods from low-carbon steel Fe-0.1C were subjected to two types of deformation treatment [6, 7] - conventional drawing and shear deformation by free torsion. In the process of research, the effectiveness of the deformation effect on the structure was compared with conventional drawing and free torsion. Loading schemes are chosen in such a way that in the future it will be possible to analyze the structural and strength changes in the realization of two different types of deformation - compression with shear (when drawing) and shearing (with free torsion).
Traditional drawing was carried out in several passes in a drawing mill with a force of 30 kN with a step-wise reduction in diameter from 10 mm to 7 mm. Torsional deformation (pure shear) was carried out on a lathe with a variable speed of rotation, changing the speed from 10 to 30.
ε =[( So– S1)/So]х100%, (1)
where So – cross-sectional area of rod before drawing, S1 – after drawing [6-8]
The degree of shear deformation intensity (in the physical experiment) at torsion was determined as
Λ′ = tg φ, (2)
where φ – angle of twist of the original generator [7], i.e. the angle between the tangent to the generator and the projection of the axis of the rod to the tangent plane (Fig. 1).
Fig. 1. Scheme for determining the twist angle and the view of the
rods after deformation by free torsion: φ - angle of twisting of the rod: a) - 10 revolutions; b) 16 revolutions; c) 22 revolutions.
It should be noted that the quantity Λ', calculated from formula (2),
characterizes the intensity of the accumulated strain directly in the surface layer of the rods. In the volume of rods, the change in Λ 'can
be represented in the form
l
D
2
ϕ
=
Λ′
[9], where D is the diameter,l is the length of the working part of the rod.
The number of passes for drawing (nd) and the number of
revolutions at torsion (nrev), as well as the diameters and degrees of
deformation of the rods are given in Table 1.
Table 1. Deformation regimes of rods from low-carbon steel
Fe-0.1C
Simple drawing Torsion (Ø = Øо)
nd Ø, mm ε % nrev φ Λ′
1 9.6 7 10 57о 1,5
2 9.4 12 16 68о 2,5
3 8.0 36 22 70о 3,5
4 7.7 42
5 7.0 51
The initial diameter of the rods is Ø0 = 10 mm, tdef. = 20° C. Ø - diameter of rods after deformation, ε% - cumulative deformation at drawing.
To reveal the features of the microstructure of the material in the as-received and deformed states, metallographic analysis was performed on light, as well as scanning and transmission electron microscopes. Mean size of grains, features of cellular and dislocation structure of ferrite were determined, the nature of the location of microcracks was studied, and the size and distribution of Fe3C particles were estimated [10]. In addition, the microhardness
HV was measured at a load of 1 N and a holding time of 10 sec in the cross-section of the rods before and after deformation. The error of measurements of these values did not exceed 12%.
3. Results of experiments and their discussion.
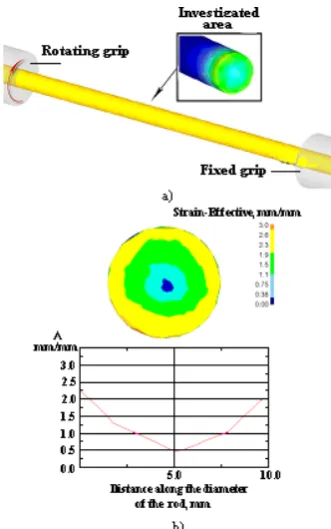
On the basis of the obtained results of mathematical modeling, the
deformation intensity Λ by the diameter of the rod was determined, for the sake of clarity, presented in a graphical form in Fig. 2. The
graph shows a slight change in the exponent Λ from the periphery
to the center of the sample. Thus, one can testify to the "softness" of such a deformation scheme as simple drawing.
Fig. 2. Mathematical modeling of the distribution of deformation
intensity Λ when drawing rods from low-carbon steel Fe-0.1C, the fifth passage: a) general view of the deformable rod, steady-state stage, longitudinal section; b) the change in Λ along the diameter of
the rod in the cross section.
Fig. 3 shows the distribution of the intensity of the accumulated strain along the surface, and also in the cross-section of the rod after free torsion. As follows from this figure, the degree of deformation
Λ increases nonlinearly from the value Λ ≈ 0.5 at the center to Λ ≈
2.3 in the peripheral region of the rod, which is a characteristic feature of the development of shear deformation [7]. A similar character of the inhomogeneous distribution of Λ in the radial direction was observed by the author of [11] with free torsion of cylindrical samples from a titanium alloy Ti-6Al-4V
Fig. 3. The pattern of the distribution of the strain intensity of Λ in
For the analysis and interpretation of the results obtained in the numerical model, field experiments on simple drawing and free torsion were carried out according to the method described above, observing the processing regimes adopted in the model.
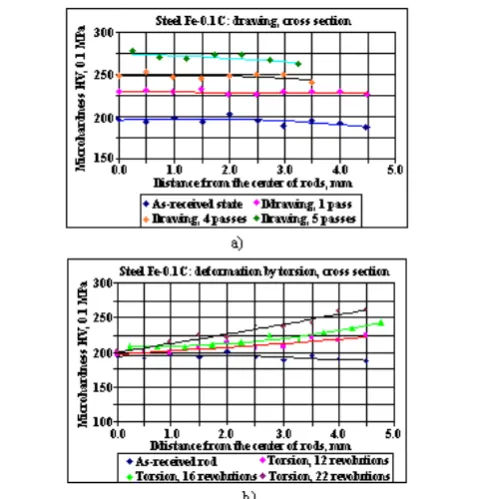
In order to reveal the peculiarities of plastic deformation in the volume of deformed rods, the microhardness HV was measured by the diameter of the cross-section of the rods. Graphs of variation of HV along the radius of the cross-section of deformed rods are shown in Fig. 4.
Fig. 4. Changing of microhardness of low-carbon steel Fe-0.1C on
the diameter of the cross-section of the rod after deformation processing: a) by drawing; b) by free torsion
As can be seen from the presented graphs, the values of microhardness in the as-received rods of low-carbon steel Fe-0.1C are approximately the same in the central and peripheral areas of the rods. After simple drawing with an increase in the degree of deformation (the number of passes) the values of HV grow almost uniformly throughout the cross section of the rods (Fig. 4a). This indicates a relatively homogeneous character of the deformation by simple drawing along the entire volume of rods, which is confirmed by the results of structural studies. The data presented correspond basically to the results of modeling and indicate a correlation between the intensity of deformation and mechanical properties. A more heterogeneous character of the change in microhardness is observed with torsional deformation (Fig. 4b). Thus, in the central regions of the rods after torsion, the values of microhardness remain at the level of the as-received samples. At the same time, at the periphery they reach a value close to the values of HV after deformation by simple drawing by 51%. Such a picture of the change in microhardness in the central and peripheral regions of the rods correlates with the results of [12] on torsion with the simultaneous expansion of rods from low-carbon steel Fe-0.1C and is directly related to the heterogeneity of purely shear deformation occurring during torsion [11].
The change in microhardness due to an increase in the intensity of deformation is confirmed by metallographic studies. Fig. 5-6 show photographs of the microstructure of rods from low-carbon steel Fe-0.1C in the as-received state and after deformation treatment. As can be seen in Fig. 5a, basically equiaxed grains of ferrite with comparatively rectilinear boundaries and average sizes of dav ≈ 12
-13 µm are observed throughout the cross-sectional area of the bars. Rounded, often stretched into chains, particles of degenerate Fe3C
perlite of indefinite shape with dimensions dFe3C≈ 0.2-3.0 μm are
randomly distributed along the boundaries of the ferrite grains (Fig. 5).
Fig. 5. Microstructure of low-carbon steel Fe-0.1C, cross-section,
central areas of rods: a) the as-received state; b) deformation by drawing, 5 passes; x1000
Table 2 shows the values of the microstructure parameters in the cross sections of these rods.
Table 2. Average size of grains in rods from low-carbon steel
Fe-0.1C in the as-received and deformed states
Type of processing dЗ., µm, cross-section
As-received state 12.7
Drawing, 5 passes 7.5 Torsion deformation, 16
revolutions, central part of the rod
12.0
When studying the structure in the cross section of deformed rods after 5 deformation passes by simple drawing, it is established that the structure of the alloy is relatively uniform, the grains (ferrite) are non-equiaxed, strongly deformed, often curved, the boundaries are tortuous, the grain sizes are d3~ 7.5 μm (Fig. 5b). In general, the
microstructure in the central and peripheral areas of the rods is identical. The nature of the distribution and the dimensions of the particles of perlite practically have not changed.
In alloy samples subjected to torsional deformation, a different picture is observed. In the central part of a rod deformed by free torsion, the dimensions of the ferrite grains, as well as the perlite particles, practically did not change (Table 2), although chaotically distributed deformed grains of ferrite are present in the structure. At the same time, in the peripheral parts of the rods the structure is represented mainly by deformed ferrite grains with curved boundaries, similar to the one shown in Fig. 6a. In addition, in the peripheral regions of the samples near the lateral surface of the rods, after only 16 revolutions, single microcracks are observed, mainly at interphase boundaries.
Electron microscopic studies have shown that disoriented cells are observed over the entire volume of rods in deformed ferrite grains after drawing. They are, as a rule, elongated in the direction of
drawing, their dimensions are ≈ 0.3-0.5 μm wide and ≈ 1-3 μm in length. In samples subjected to free torsion by 16 revolutions, elongated cells are also observed in the peripheral regions, but they have a noticeably greater misorientation than after drawing. This is evidenced by the presence not only of azimuthal smear, but also of spot reflexes on electron diffraction patterns. In addition, the cells in the peripheral parts of the samples after torsion are smaller than the cells after drawing - their width does not exceed 0.2-0.3 μm, and the length is usually not more than 0.5-1 μm (Fig. 6 ).
shaped cells are observed (Fig. 6a). These results indicate a lower intensity of the accumulated strain in the central region of the samples during torsion, which correlates with the data on the measurement of microhardness and modeling results.
Fig. 6. Electron microscopic images of the structure of samples
from low-carbon steel Fe-0.1C, deformed by free torsion: a) the central region of the rod, the axis of the zone [111]; b) the peripheral region of the rod, the axis of the zone [110]; x29000.
In order to determine the margin of ductility during torsional deformation, a ductility diagram of low-carbon steel Fe-0.1C in the as-received state was constructed (Fig. 7). In addition to the basic regime (n = 16), torsion experiments were performed with a smaller (n = 10) and a larger number of revolutions (n = 22).
Fig. 7. The diagram of ductility of low-carbon steel Fe-0.1C in the
as-received state and the values of the accumulated strain during torsion: Λ'1 ≈ 1.5 (n = 10 rev.); Λ'2 ≈ 2.5 (n = 16 rev.); Λ'3 ≈ 3.5 (n
= 22 rev.); Λ'cr ≈ 2.8
As is known [7], the ductility diagram allows us to estimate the level of accumulated strain and determine the margin of the ductility reserve of the investigated material during deformation treatment. In Fig. 7 on the ordinate axis, the points are the value of the accumulated deformation for each number of revolutions during torsional deformation.
According to this diagram, the margin of ductility during torsion of rods from low-carbon steel Fe-0.1C is exhausted at a critical strain
degree Λ'cr≈ 2.8. The values of the strain degrees Λ'1≈ 1.5 (n = 10
rev.) and Λ'2≈ 2.5 (n = 16 rev.) are below the value Λ'cr and do not
exhaust the margin of ductility. Accordingly, at these strain degrees, microcracks practically do not form and do not develop. However,
at Λ'3≈ 3.5 (n = 22 rev.), a well-developed network of microcracks
is observed in the alloy structure (Fig. 8), since Λ'3> Λ'cr, which
leads to the destruction of the sample with further torsion.
Fig. 8. Deformation by torsion, 22 revolutions, the central part of
the rod, SEM, x4000, M - microcracks at the interface boundaries
As noted above, the establishment of direct dependence of the modeling parameters of the deformation processes of alloys and the structural changes that occur in them will allow us to realize new approaches to the development and management of technological processes of deformation processing of metallic materials for grinding the structure and forming the targeted set of their physico-mechanical properties.
As can be seen in Fig. 2 and 3, the strain intensity distribution Λ calculated by modeling is ~ 0.8 after simple drawing. For the degree
of deformation by drawing ε ≈ 51% (respectively, for Ø0 = 10 mm
and Ø1 = 7 mm), the value of the logarithmic stretching is e = ln So /
S1≈ ln 78.5 / 38.5 ≈ ln 2.04 ≈ 0.71. The closeness of the values of Λ
and e for the process of drawing testifies to a certain correspondence between the data obtained by modeling and in a physical experiment.
Obtained in a physical experiment, Λ after 16 revolutions of free torsion (Table 1) reaches a value of 2.5, which is close to the value
Λ '≈ 2.3. It should be noted that the change in the strain intensity
(Figures 2 and 3) also mainly correlates with the character of the change in microhardness along the radius of the cross section of deformed rods, the values of which are shown in Fig. 4.
Both in the model and in the real experiment it was established that deformation of the rod by free torsion leads to a significant structural heterogeneity and a gradient of mechanical properties from the center of the rod to its surface.
On the basis of the obtained results, it was proposed to study the shear drawing process to be able to improve the methods of deformation processing of long-length products and significantly increase their operational properties [13, 14]. This scheme, presumably, will allow realizing more fully the advantages of simple drawing and free torsion.
4. Conclusions:
1. Various types of cold deformation processing of rods from low-carbon steel Fe-0.1C were performed - traditional drawing and free torsion. A significant heterogeneity of the structural changes and the nature of the distribution of the intensity of plastic deformation under the given types of deformation processing of the alloy are revealed.
2. It is shown that deformation by simple drawing leads to a practically homogeneous structure refinement and, accordingly, to a uniform change in microhardness in the bulk of the billet. At the same time, under deformation by free torsion, a substantially heterogeneous, so-called gradient structure is formed.
3. The mutual correspondence of the ductility diagram of low-carbon steel Fe-0.1C and the nature of the structural changes in the samples deformed by free torsion is established. The marginal values of the ductility, the excess of which leads to the development of fracture processes, are established.
4. It is shown that the results of modeling of simple drawing and free torsion, basically, correspond to a real physical experiment with similar strain parameters. This testifies to the correctness of the applied approaches and the prospects of the mathematical modeling method for the development and improvement of new technological processes for metal working with pressure.
ACKNOWLEDGEMENTS: The authors acknowledge gratefully
financial support by the RFBR through project № 17-08-00720.
5.R
references
[1]. Valiev R.Z., Alexandrov I.V. Bulk nanostructured metallic materials: preparation, structure and properties. – M.: IKC "Akademkniga", 2007. – 398 p. (in Russian).
[2]. Kaibyshev O.A., Utyashev F.Z. Superplasticity, refinement of the structure and processing of hard-deformable alloys. – M.: Nauka, 2002. – 438 p. (in Russian).
[3]. Beygelzimer Ya.Yu., Varyukhin V.N., Orlov D.V., Synkov S. G. Screw extrusion – process of deformation accumulation. – Donetsk: Firm "TEAN", 2003. – 87 p. (in Russian).
[4]. Borodin M.A. Resistance of materials. – M.: Drofa, 2001. – 288 p. (in Russian).
[5]. Marochnik steels and alloys / V.G. Sorokin, A.V. Volosnikova, S. A. Vyatkin, etc., Moscow: Mashinostroenie. 1989. 640. (in Russian).
[6]. I.L. Perlin, M.Z. Ermanok. The theory of drawing. – M.: metallurgy, 1971, 447 p. (in Russian).
[7]. Kolmogorov V.L. Mechanics of metal forming // UPI. 2001. P. 836. (in Russian).
[8]. A.N. Levanov, V.L. Kolmogorov, S.P. Burkin, B.R. Kartak, etc. Contact friction in the processing of metals by pressure. – M.: "Metallurgy", 1976. – 416 p (in Russian).
[9]. Verbilo D.G. Peculiarities calculate the true curves of loading in torsion. Problems of strength, No. 3, 2011 Pp. 110 -123. (in Russian).
[10]. Saltykov S.A. Stereometric metallography. – M.: "Metallurgy", 1976. – 273 p. (in Russian).
[11]. Berdine V.K. The formation of microcrystalline structure in titanium VT6 alloy during hot deformation of two-component loading // Vestnik USATU. Industrial and manufacturing
engineering. – Ufa: USATU, 2011. Vol 15, No. 4 (44). P. 175-180. (in Russian).
[12]. Pashinskaya E.G., Tishchenko I.I., Stolyarov V.V., Kralik M.A. Peculiarities of plastic deformation of mild steel under impact loading combined torsion with tension. "Inzhenerna Mechanika. Naukow notatki". - Lutsk: LTU, Vol. 25, part II. 2009.- Pp. 182-189. (in Russian).
[13]. Patent No. 2347633 of the Russian Federation, the IPC 21 to 1/00. A method of obtaining ultrafine-grained semi-finished products by drawing with shift./ G.I. Raab, A.G. Raab, Publ. 27.02.2009. - Bull. No. 6. (in Russian).
![Fig. 6. from low-carbon steel Fe-0.1C, deformed by free torsion: a) the Electron microscopic images of the structure of samples central region of the rod, the axis of the zone [111]; b) the peripheral region of the rod, the axis of the zone [110]; x29000](https://thumb-us.123doks.com/thumbv2/123dok_us/8585267.1719765/4.595.48.280.92.328/deformed-torsion-electron-microscopic-structure-samples-central-peripheral.webp)
