215
INTERNATIONAL JOURNAL OF PHARMACEUTICAL, CHEMICAL AND BIOLOGICAL SCIENCES
Available online at www.ijpcbs.com
DEVELOPMENT OF NEW COLORIMETRIC METHOD AND VALIDATION
FOR DETERMINATION OF LOPERAMIDE IN BULK AND MARKETED
FORMULATION
Raval Kashyap1* and Kevin Makavana2* 1Noble college of pharmacy, Junagadh,Gujarat, India.
2Department of Quality Assurance, KNM Pharma Pvt Ltd, Ahmedabad, Gujarat, India.
.
INTRODUCTION
Spectroscopy deals with the transitions induced in a chemical species by its interaction with the photons of electromagnetic radiation or the measurement and interpretation of Electro Magnetic Radiation (EMR) absorbed or emitted when the molecule or atoms or ions of a sample move from one energy state to another energy state.1, 2In a modern industrialized society the analytical chemist has a very important role to play. Thus most manufacturing industries rely upon both qualitative and quantitative chemical analysis to ensure that the raw material used meet certain specification, and also to check the quality of the final product. The examination of raw materials is carried out to ensure that there is no unusual substance present which might be deleterious to the manufacturing process or appear as a harmful impurity in the final product.
Further, since the value of the raw material may be governed by the amount of the required ingredient which it contains, a quantitative analysis is performed to establish the proportion of the essential component: this procedure is often referred to as assaying.3, 4
Loperamide is an Anti-diarrheal drug. Loperamide IUPAC name is 4-[4-(4- chlorophenyl)-4-hydroxypiperidin-1-yl]-N,N-dimethyl-2, 2- Di-phenylbutanamide. Its formula is C29H33ClN2O2 and molecular
weight is 477.037.
Research Article
ABSTRACT
In the present work, simple, sensitive, specific, and validated colorimetric method has been developed for the quantitative estimation of Loperamide in bulk and pharmaceutical dosage form. Loperamide in presence of acidic medium reacts with excess amount of Potassium bromide bromate and remaining Potassium bromide-bromate reacts with crystal violet to produce blue colour. The λmaxwas found to be 590nm for assay. The linearity was found in concentration range of 3-18 µg/ml. The correlation coefficient was found 0.999. The regression equation was found as Y= 0.030X + 0.006. The method was validated for linearity, accuracy, precision and ruggedness. The LOD and LOQ for estimation ofLoperamide were found as 0.09784, 0.2951respectively. Recovery of Loperamide was found to be 96.93%. Proposed method was successfully applied for the quantitative estimation of Loperamide in marketed formulations.
216
It is soluble in methanol and
chloroform.Loperamide is a synthetic piperidine derivative, is an opioid drug effective against diarrhea resulting from gastroenteritis or inflammatory bowel disease. In most countries it is available generically and under brand names such as Lopex, Imodium, Dimor, Fortasec and Pepto Diarrhea Control. It was developed at Janssen Pharmaceutical.Loperamide is an opioid-receptor agonist and acts on the µ-opioid receptors in them enteric plexus of the large intestine; by itself it does not affect the central nervous system like other opioids. It works by decreasing the activity of the my enteric plexus; Loperamide also decreases colonic mass movements and suppresses the gastro colic reflex. Loperamide molecules do not cross the blood-brain barrier in significant amounts, and, thus, it has no analgesic or euphoric properties. Adverse drug reactions (ADRs)
associated with Loperamide includes
abdominal pain and bloating, nausea, vomiting and constipation. Rare side-effects associated with Loperamide are paralytic ileus, dizziness and rashes.5
Up to now there are many methods developed likespectrofluorimetric andDerivative absorption spectrophotometric, LC-MS spectroscopic method developed etc…6-11 but very few methods develop on colorimetric for Voriconazole. So here aim is to develop new colorimetric method on Voriconazole. And validation will be done on Voriconazole. The USP has published specific guidelines for method validation for compound evaluation. USP defines eight steps for validation: Accuracy, Precision, Specificity, Limit of detection, and Limit of quantitation, Linearity and range, Ruggedness, Robustness 12
MATERIALS AND METHODS
Loperamide was determined spectrophotometrically in bulk and marketed formulation by using Potassium bromide-bromate reagent in presence of HCl and crystal violet as dye.
EXPERIMENTAL
a) Instrumentation: JASCO V-630 UV spectrophotometer with 1 cm path length matched glass cuvettes were used in method development. b) Preparation of standard stock
solution of Loperamide: Standard stock solution prepared by accurately weighing 100 mg of Loperamide in 100 ml calibrated volumetric flask and made up the volume with methanol up to 100 ml. c) Preparation of working standard
solution of Loperamide: working standard was prepared by transferring of 10 ml standard stock solution into 100 ml calibrated volumetric flask and made up the volume with methanol to get concentration of 100µg/ml.
Preparation of solution
a) Preparation of330µg/ml of [(1:0.1)KBr:KBrO3]Potassium bromide-bromate reagent: weighed accurately 1.0 gm potassium bromide and 0.1 gm potassium bromate, transferred into 100 ml volumetric flask and made up the volume with distilled water. From that 3ml transferred in 100ml volumetric flask and made up volume up to 100ml with distilled water.
b) Preparation of 2M HCl: 17ml concentrated HCl dissolved in 100ml distilled water.
c) Preparation of 0.025% of crystal violet: Transferred 250mg of crystal violet into 100 ml volumetric flask and made up with distilled water. From that 10ml solution transferred into 100ml volumetric flask and made up with distilled water.
Preliminary investigation
217
made up the volume with methanol. Absorbance was recorded.
Parameter fixation
a) Determination of absorption maxima An absorption maxima (or) max are the wavelength at which maximum absorption takes place. It is important to know the absorption maxima of the substance under study, since it helps to avoid any interfering impurities.
PROCEDURE: Transferred 1.2ml of working standard of Loperamide into 10 ml volumetric flask. Then 1ml of 330µg/ml Potassium bromide-bromate reagent and 0.5 ml of 2M HCl were added, kept it for 15 minutes until completion of reaction. 0.5ml of 0.025% crystal violet was added and made up the volume with methanol. Absorbance was recorded against reagent blank. Show in figure no. 1. These solutions were scanned in UV spectrophotometer between 400-800 nm.
Model: JASCO V-630 Band width: 1.5 nm Response: Medium
Measurement: 800-400 nm No. of cycle: 1
λmax: 590 nm
Absorbance: 0.3795.
a) Stability of color
PROCEDURE: In 10 ml volumetric flask, 1.2 ml of working standard of Loperamide and 1ml of 330µg/ml Potassium bromide-bromate reagent were added. Then 0.5 ml of 2M HCl was added and kept it for 15 minutes until completion of reaction. 0.5ml of 0.025% crystal violet was added and made up the volume with methanol. Absorbance was recorded against reagent blank. Reading of same solution was taken for every 10 minutes intervals. The result is recorded in table no. 1 and graph is given in Figure no.2.
Investigation
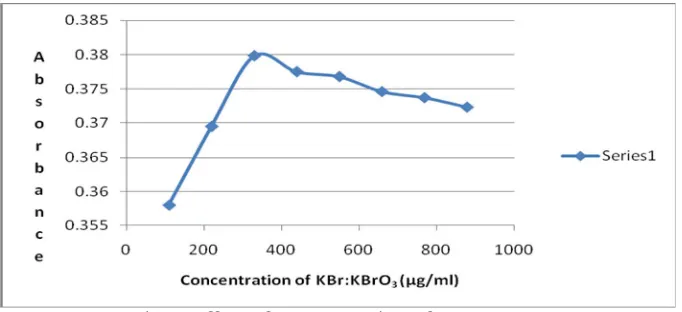
a) Effect of concentration of reagent (KBr:KBrO3)
Experiments was carried out to ascertain the optimum concentrations of reagents needed for rapid and quantitative formation of light blue colored species by
measuring the absorbance of series of solutions in which one parameter was varied and others fixed.
PROCEDURE: Eight 10ml volumetric flasks were taken. 1.2 ml of working standard solution of Loperamide was added. Then different concentration of Potassium bromide-bromate reagent and 1ml of 1M HCl were added, Kept for 15 minutes. 0.2ml of 0.1% crystal violet was added. Made up the volume with methanol. Absorbance was recorded against reagent blank. Reported in table no.2 and figure no. 3.
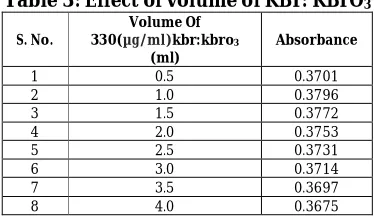
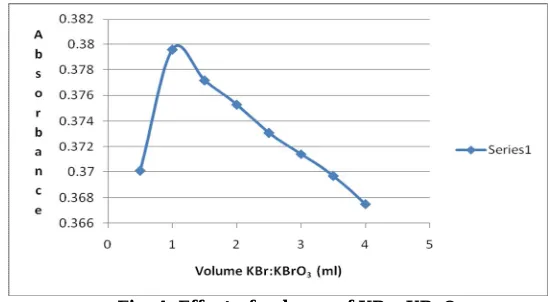
b) Effect of volume of 330µg/mlreagent (KBr:KBrO3)
PROCEDURE: Eight 10ml volumetric flasks were added. 1.2 ml of working standard solution of Loperamide was added. Then different volume of 330µg/ml Potassium bromide-bromate reagent and 1ml of 1M HCl were added, Kept for 15 minutes. 0.2ml of 0.1% crystal violet was added. Made up the volume with methanol. Absorbance was recorded against reagent blank. Reported in table no.3 and figure no. 4.
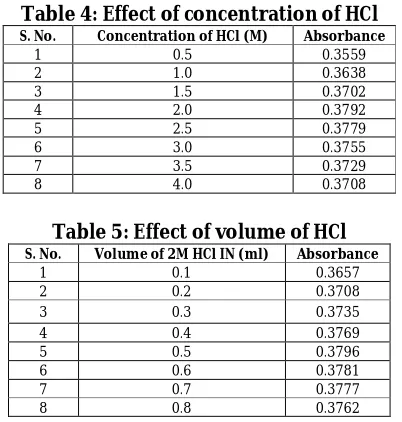
c) Effect of concentration of HCl
PROCEDURE: Eight 10ml volumetric flasks were taken. 1.2 ml of working standard solution of Loperamide was added. Then 1 ml of 330µg/ml Potassium bromide bromate reagent and 1ml of different concentration HCl were added, Kept for 15 minutes. 0.2ml of 0.1% crystal violet was added. Made up the volume with methanol. Absorbance was recorded against reagent blank.Absorbance was recorded against reagent blank. Reported in table no.4 and figure no. 5.
d) Effect of volume of 2M HCl
218
e) Effect of concentration of Crystal violet
PROCEDURE:Eight 10ml volumetric flasks were taken. 1.2 ml of working standard solution of Loperamide was added. Then 1 ml of 330µg/ml Potassium bromide bromate reagent and 0.5ml of 2M HCl were added, Kept for 15 minutes. 0.2ml of different concentration crystal violet was added. Made up the volume with methanol. Absorbance was recorded against reagent blank. Reported in table no.6 and figure no. 7.
f) Effect of volume of 0.025% Crystal violet
PROCEDURE:Eight no. of 10ml volumetric flasks were taken. 1.2 ml working standard solution of Loperamide was added. 1 ml of
330µg/ml Potassium bromide bromate
reagent and 0.5ml of 2M HCl were added, Kept for 15 minutes. Then different volume of 0.025% crystal violet was added. Made up the volume with methanol. Absorbance was recorded against reagent blank.. Reported in table no.7 and figure no. 8.
Optical characters
a) Determination of concentration range
For spectrophotometric analysis determination of the concentration range which obeys the Beer- Lambert’s law is necessary for accuracy and reproducibility.
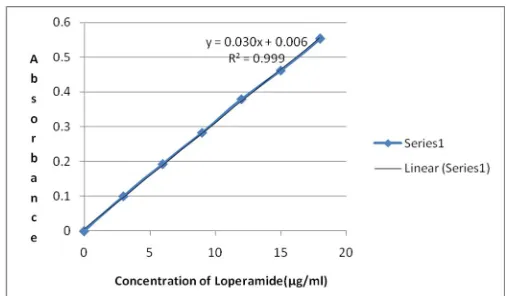
b) Preparation of standard curve Standard curve was prepared by using pure Loperamide in the concentration range of 3-18µg/ml by this method and selecting absorbance maximum at 590 nm.
Reagent and chemicals:
1. Working standard stock solution (100µg/ml)
2. 330µg/ml Potassium bromide bromate reagent
3. 2M HCl
4. 0.025% Crystal violet
c) Procedure: Seven 10ml volumetric flasks were taken. Then 0.3, 0.6, 0.9, 1.2, 1.5, 1.8 ml working standard solution of Loperamide was added. 1 ml `of
330µg/ml Potassium bromide bromate
reagent and 0.5ml of 2M HCl were
added, kept for 15 minutes. 0.5ml of 0.025% crystal violet was added. Made up the volume with methanol. Absorbance was taken at 590 nm. The result is recorded in table no. 8And graph is given in figure no. 9 .The six such linearity was taken for regression co-efficient and eight such linearity was taken for standard deviation separately.
d) Analysis of marketed formulation Loperamide is marketed as Loparet of 2mg tablet manufactured by Retort laboratories were taken for analysis.
Reagent and chemicals
1. Working standard stock solution (100µg/ml)
2. 330µg/ml Potassium bromide bromate reagent
3. 2M HCl
4. 0.025% Crystal violet Preparation of sample solution
Weighed accurately tablet powder equivalent to 100mg and transferred into 100ml volumetric flask and made up the volume with methanol to get 1000µg/ml concentration. This solution was further diluted to get concentration of 100µg/ml. Recovery experiments: To keep an additional check on accuracy of developed assay method, analytical recovery experiments were performed. The different solutions of different concentration like 3, 6
and 9 μg/ml were prepared in case of both
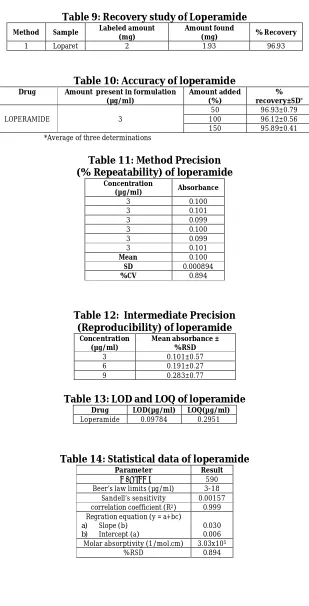
pure drug solution and formulation extract solution and these solutions were subjected to analysis by above developed method as mentioned in 5.2.6. (c) The six such samples were prepared and average of that readings taken for calculation of % recovery. This is reported in following table no.9.
Method validation 1. Linearity
Linearity was determined over the range of 3-18 μg/ml. Seven no. of 10ml volumetric
219
Absorbance was taken at 590 nm. The result is recorded in table no.8 and graph is given in figure no 9.
2. Recovery (%Accuracy)
The accuracy of the methods was determined by calculating % recovery of Loperamide by standard addition method. Known volumes of standard solutions of Loperamide were taken for recovery studies. It is mentioned in table no.10.
3. Method precision (% Repeatability) The precision of the methods was checked by repeated measurement of the absorbance of standard solutions (n = 6) of 3 µg/ml without changing the parameters for the method. The repeatability was expressed in terms of relative standard deviation (RSD). Reported in table no 11.
4. Intermediate precision (Reproducibility)
The intraday and interday precision of the proposed methods were performed by analyzing the corresponding responses three times on the same day and on three different days over a period of one week for three different concentrations of standard solutions of Loperamide ( 3, 6, 9 µg/ml). The results were reported in terms of relative standard deviation (RSD). Reported in table no 12.
5. Limit of detection and Limit of quantification
The limit of detection (LOD) and limit of quantification (LOQ) of the drug were
derived by calculating the signal-to-noise (i.e. 3.3 for LOD and 10 for LOQ) ratio using following equations designated by International Conference on Harmonization (ICH) guideline.Reported in table no 13.
LOD = 3.3 Χ σ/S and LOQ = 10 Χ σ/S
Where, σ = the standard deviation of the
response,
S = slope of the calibration curve.
6. Statistical evaluation
The precision of each proposed method was ascertained by analyzing the same concentration in freshly prepared sample solution of Voriconazole six times of each three samples combination of drug and extracted solutions of drug. The set absorbance values obtained were then used to calculate the drug content per tablet and this was used to obtain standard deviation (s), standard Error (S.E), and precision (P) value. Reported in table no. 14.
RESULT AND DISCUSSION
Potassium bromide bromateis strong oxidizing agent.Itsreact with loperamide in
present of acidic medium. When Potassium
bromide bromateadded in excess amount it
produced yellow color complex of
loperamide. Remaining Potassium bromide
220
CONCLUSION
For routine analytical purpose, it is always necessary to establish methods capable of analysing huge number of samples in a short time period with due accuracy and precision.Loperamide is official in Indian Pharmacopoeia. A very few analytical methods appeared in the literature for the determination of Loperamide includes LC, HPLC, HPTLC, and UV-Visible spectrophotometric methods. In view of the above fact, some simple analytical methodwas planned to develop with sensitivity, accuracy, precision and
economical.In the present investigation, colorimetric method for the quantitative estimation of Loperamide in bulk drug and pharmaceutical formulations has been developed. The results are expressed in Tablesand figures.
ACKNOWLEDGEMENT
The authors wish to thanks mates who helped me lot for my work. And how can we forget staffs of Noble College of Pharmacy, Junagadh and KNM PHARMA PVT LTD Ahemedabad who suggest us in all way.
Table 1: Stability of colored species in Loperamide
S. No.
volume of drug solution in 10ml vol. flask(100µg/ml)
Time in
minutes Absorbance
1 1.2 ml 0 0.3795
2 1.2 ml 10 0.3794
3 1.2 ml 20 0.3789
4 1.2 ml 30 0.3783
5 1.2 ml 40 0.3779
6 1.2 ml 50 0.3774
7 1.2 ml 60 0.3770
8 1.2 ml 70 0.3767
9 1.2 ml 80 0.3761
10 1.2 ml 90 0.3758
11 1.2 ml 100 0.3754
12 1.2 ml 110 0.3750
13 1.2 ml 120 0.3746
Table 2: Effect of concentration of KBr: KBrO3
S. No. Concentration Of
KBr:KBrO3 (µg/ml) Absorbance
1 110 0.3580
2 220 0.3695
3 330 0.3798
4 440 0.3775
5 550 0.3768
6 660 0.3746
7 770 0.3737
8 880 0.3723
Table 3: Effect of volume of KBr: KBrO3
S. No.
Volume Of
330(µg/ml)kbr:kbro3
(ml)
Absorbance
1 0.5 0.3701
2 1.0 0.3796
3 1.5 0.3772
4 2.0 0.3753
5 2.5 0.3731
6 3.0 0.3714
7 3.5 0.3697
221
Table 4: Effect of concentration of HCl
S. No. Concentration of HCl (M) Absorbance
1 0.5 0.3559
2 1.0 0.3638
3 1.5 0.3702
4 2.0 0.3792
5 2.5 0.3779
6 3.0 0.3755
7 3.5 0.3729
8 4.0 0.3708
Table 5: Effect of volume of HCl
S. No. Volume of 2M HCl IN (ml) Absorbance
1 0.1 0.3657
2 0.2 0.3708
3 0.3 0.3735
4 0.4 0.3769
5 0.5 0.3796
6 0.6 0.3781
7 0.7 0.3777
8 0.8 0.3762
Table 6: Effect of concentration of crystal violet
S. No. Concentration of crystal
violet (%) Absorbance
1 0.005% 0.3659
2 0.01% 0.3681
3 0.015% 0.3707
4 0.02% 0.3748
5 0.025% 0.3794
6 0.03% 0.3789
7 0.035% 0.3776
8 0.04% 0.3769
Table 7: Effect of volume of crystal violet
S. No. Volume of (0.025%)crystal
violet in (ml) Absorbance
1 0.1 0.3687
2 0.2 0.3709
3 0.3 0.3754
4 0.4 0.3779
5 0.5 0.3797
6 0.6 0.3788
7 0.7 0.3771
8 0.8 0.3765
Table 8: Standard curve for Loperamide
S. No.
Volume of working standard of drug
(ml)
Concentration of
drug (µg/ml) Absorbance
1 0.3 3 0.101
2 0.6 6 0.191
3 0.9 9 0.283
4 1.2 12 0.379
5 1.5 15 0.461
222
Table 9: Recovery study of Loperamide
Method Sample Labeled amount (mg) Amount found (mg) % Recovery
1 Loparet 2 1.93 96.93
Table 10: Accuracy of loperamide
Drug Amount present in formulation (µg/ml)
Amount added (%)
% recovery±SD*
LOPERAMIDE 3
50 96.93±0.79
100 96.12±0.56
150 95.89±0.41
*Average of three determinations
Table 11: Method Precision (% Repeatability) of loperamide
Concentration
(µg/ml) Absorbance
3 0.100
3 0.101
3 0.099
3 0.100
3 0.099
3 0.101
Mean 0.100
SD 0.000894
%CV 0.894
Table 12: Intermediate Precision (Reproducibility) of loperamide
Concentration (µg/ml)
Mean absorbance ± %RSD
3 0.101±0.57
6 0.191±0.27
9 0.283±0.77
Table 13: LOD and LOQ of loperamide
Drug LOD(µg/ml) LOQ(µg/ml)
Loperamide 0.09784 0.2951
Table 14: Statistical data of loperamide
Parameter Result
λmax (nm) 590
Beer’s law limits (µg/ml) 3-18
Sandell’s sensitivity 0.00157
correlation coefficient (R2) 0.999
Regration equation (y = a+bc)
a) Slope (b)
b) Intercept (a)
0.030 0.006
Molar absorptivity (1/mol.cm) 3.03x10⁵
%RSD 0.894
223
Fig. 1: Loperamide with Potassium bromide-bromate & crystal violet
Fig. 2: Stability of colored species in Loperamide
CONCLUSION: the stability study of color was performed and from graph it Proved that color was stable for at least 120 minutes.
Fig. 3: Effect of concentration of KBr: KBrO3
224
Fig. 4: Effect of volume of KBr: KBrO3
CONCLUSION: Highest absorbance was found in 1 ml of 330µg/ml conc. of Potassium bromide bromate.
Fig. 5: Effect of concentration of HCl
CONCLUSION: Highest absorbance was found in 2M of HCl
Fig. 6: Effect of volume of HCl
225
Fig. 7: Effect of concentration of crystal violet
CONCLUSION: Highest absorbance was found in 0.025% concentration of crystal violet solution.
Fig. 8: Effect of volume of crystal violet
CONCLUSION: Highest absorbance was found in 0.5 ml of (0.025%) crystal violet solution.
226
REFERENCES
1. Kaur H. Spectroscopy. 3rd ed. Meerut: PragatiPrakashan Educational publishers; 2007;1-5, 237-314.
2. Ravi Sankar S. Pharmaceutical Analysis. 3rd ed. Rx Publishing House; 2001;1-1, 2-2.
3. Kealey D and Haines PJ. Instant notes Analytical chemistry. UK: BIOS Scientific Publishers Ltd; 2002;1. 4. Jeffery GH, Bassett J, Mendham J and
Denny RC. Vogel’s Text book of Quantitative
5. Indian Pharmacopoeia. The Indian Pharmacopoeia Commission; 2007;2:694-96
6. El-Sherif ZA, Mohamed AO, Walash MI and Tarras FM. Spectrophotometric determination of loperamide hydrochloride by acid-dye and charge-transfer complexation methods in the presence of its degradation products. J Pharm Biomed Anal. 2000;22(1):13-23.
7. Hewalla II. Spectrofluorimetric and derivative absorption spectrophotometric techniques for the determination of loperamide hydrochloride in pharmaceutical formulations. J Pharm Biomed Anal. 1995;13(6):761-67.
8. Streel B, Ceccato A, Klinkenberg R, Hubert PH and Galephar MF.
Developed and Validation of a liquid chromatographic-tandem mass spectrometric method for the determination of loperamide in human plasma. J Chromatogr B AnalytTechnol Biomed Life Sci. 2005; 814(2):263-73.
9. Jin HY, Hye JK, Sibeum L, Sung JH, Won K and Cheol JM. LC-MS Determination and bioavailability study of loperamide hydrochloride after oral administration of loperamide capsule in human volunteers. J Pharm Biomed Anal. 2004;36(2):421-27.
10.Huizhong Z, Fei N and Jiuru L. Developmend and validation of loperamide hydrochloride by Post-chemiluminescence spectra and fluorescence spectra. Analytical letter. 2007;40(18):3405–16. 11.Huaibing H, Abu S, John CLE,
Alastair JJW and David LH. Development and validation of an LC–MS method for quantitation of loperamide in human plasma. J Chromatogr B Biomed Sci App. 2000;744(2): 323-31.